 16-Plex
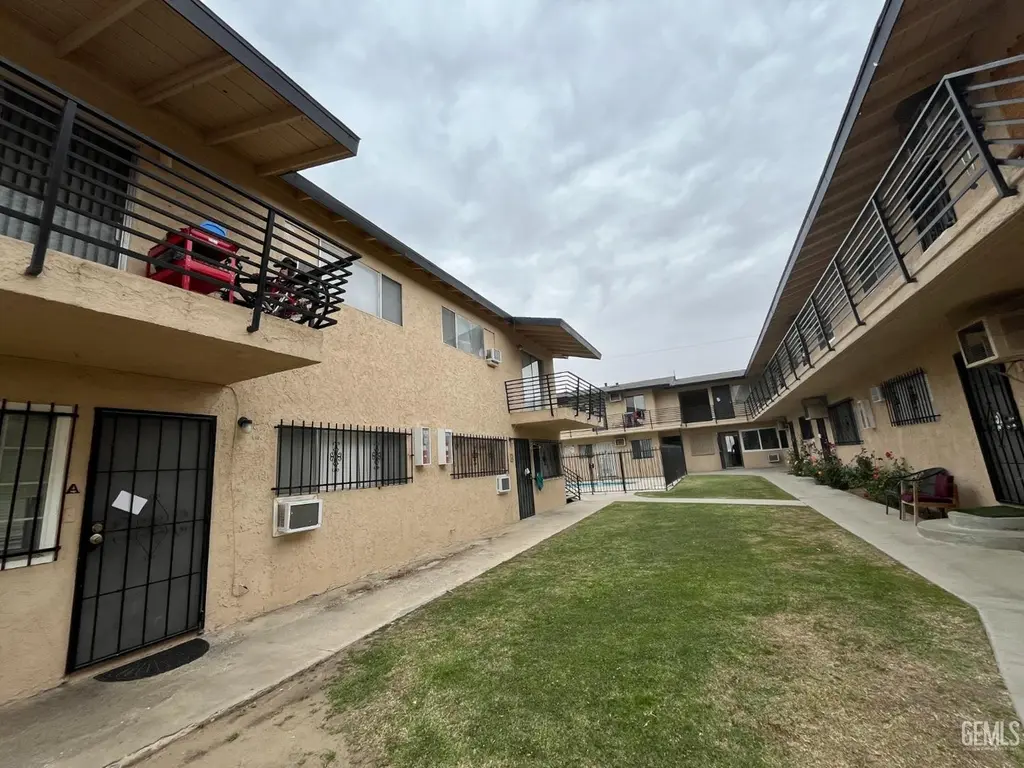
1300 Niles St · Bakersfield, CA
Flood risk 1/10 · Minimal
- FEMA flood zone
- X (unshaded)
- Chance of flooding over 30 yrs
- 0.0%
- Est. flood insurance / yr
- $507 – $1,088
Fire risk 1/10 · Minimal
- Est. fire insurance / yr
- $659 – $1,223
Heat risk 8/10 · Major
- Hot days now (above 105°F)
- 7 days/yr
- Hot days in 30 yrs
- 19 days/yr
Wind risk 1/10 · Minimal
- Chance of severe wind over 30 yrs
- —
Air-quality risk 10/10 · Severe
- Unhealthy air days now
- 39 days/yr
- Unhealthy air days in 30 yrs
- 45 days/yr
Risk factors via First Street. Map © Google.
Why this score? — see what drove the B grade
The composite is a weighted blend of 9 inputs, each scored 0–100. Each bar is that input's sub-score; the figure is the points it added to the 100-point composite (weight × sub-score).
- Cash flow +30.0/30.0
- 1% rule +10.0/10.0
- DSCR +10.0/10.0
- ARV discount +7.5/15.0
- Rent growth +4.2/5.0
- Schools +3.4/10.0
- Livability +2.9/5.0
- Condition / age +2.5/5.0
- Appreciation +0.0/10.0
$1,200,000
🖨 Deal sheet 📄 Offer letter ✓ Due diligence
Multi-family units
County records classify this as Multi-Family (5+ Unit). Listing-text estimate: 16 units. confirmed
5+ unit building — per-unit beds/baths from public records are typically unavailable; the breakdown below (if shown) is an estimate from the listing text.
Listing remarks MLS
16 units corner Lot, NE. Rents are low. Fenced swimming pool. Great opportunity
Key facts
- Newer roof
- Newer paint
- 0.35 acre lot
Tags
Property features AI
Finance
- Other: Occupant type: Tenant
- Financial info: 16-unit multifamily property; Annual gross income reported at $142,452; Annual net income reported at $106,452; Total annual expenses reported at $36,000; Actual income/expense data available; Annual Property Operating Data available; Vacancy factor assumed at 5%; Price per unit listed at $75,000; Some financial details noted as 'Other (See Remarks)'
- HOA & community: Community pool
Exterior
- Parking: Uncovered parking
- Security: Not specified
- Utilities: Sewer service available
- Home design: Two-story building; Zoned C1
- Construction: Composition roof; Slab foundation
- Exterior features: On a 0.35-acre site; Cross street: Miller
Interior
- Kitchen: Not specified
- Bedrooms: Mostly 2-bedroom units (14 units of this type)
- Flooring: Not specified
- Bathrooms: Mostly 1-bath units (14 units of this type)
- Heating & cooling: Floor or wall heaters; Other heating/cooling types listed
- Interior features: Tenant-occupied
- Laundry & utility: Laundry hookups available
Neighborhood map
What this means for you Summary
Snapshot
- This is a 16 × 2-bed/1-bath units multifamily listed at $1.20M.
Deal economics
- At list price, monthly cash flow is $7k ($84k/yr) — positive. Per door: $438/mo.
- The deal already cash-flows at list — no discount required.
- Meets the 1% rule at list price ($19k rent vs $1.20M).
- Recommended offer: $1.18M (1.5% below list) — sets the bar for market timing.
- Cap rate 13.3% vs local median 3.6% in Bakersfield — top-decile yield for the area; either an underpriced asset or a hidden risk that comps aren't pricing in. Stress-test before assuming the spread holds.
Location & tenants
- Location reads 58/100 on livability (#716 in CA) — a working-class tenant base; expect higher turnover. Strengths: housing A+; Watch: health & safety D, schools D-, crime F.
- Kern High (urban): math 21% / reading 51% proficiency, ranked #860 of 1,400 in CA (top 61%) — families likely to look elsewhere, expect single-tenant / working-renter base with shorter leases.
- Market conditions: Rents rising fast (+6.8%/yr); 143 active listings in the ZIP; lower-income renter base — watch delinquency; 3,244 units permitted in Kern County in 2024 (73 in 5+ unit buildings).
- At $19,400/mo this rent would consume 538% of the median local household income ($43k/yr) (locally 2376% of renters already pay >50% of income on rent) — very limited rent-growth headroom before tenants either downsize or default.
Forward outlook
- Local home prices are declining (-3.0%/yr); year-one equity from $8k of loan paydown is wiped out by about $36k of value loss. Plan a longer hold.
- Kern County population projected at +17% by 2050 — long-run rental-demand tailwind backs the buy-and-hold thesis.
- At projected returns (-3.0% appreciation + 6.8% rent growth), your $336k cash investment doubles in ~5 years — after that, you're playing with house money.
Negotiation context
- It's been on market 17 days — a 2% lower offer ($1.18M) is reasonable based on typical stale-listing flexibility.
- 2 sale attempts since 22y ago with the ask held roughly flat each time — persistent listings suggest the price (not the market) is what's stuck; bring a comps-based counter.
- Current owner paid $795k; list at $1.20M implies a 51% gain — meaningful room to come down on a strong offer.
Risks & watch-outs
- Climate carrying-cost: extreme-heat days projected 7→19/yr by 2055 (HVAC capex compounding) — expect insurance premiums to compound above CPI over the hold.
Questions for the listing agent
- Can we see the unit-by-unit rent roll, current vacancy, and any below-market leases? What's the average tenancy length?
- What capital expenditures (roof, boiler, parking lot, exteriors) have been made in the last 5 years, and what's planned in the next 2?
- Built in 1965 — when were the roof, HVAC, electrical panel, plumbing, and water heater last replaced?
- Is there a deadline driving the sale (1031 exchange, divorce, estate, relocation)? That informs how much negotiation room exists.
- Schools are D-rated, which usually means shorter tenancies and higher turnover. Who's the typical renter profile here, and what's been the actual vacancy rate?
- Crime grade is F in this area — have there been break-ins, vandalism, or insurance claims at this property in the last 3 years? What carrier currently insures it and at what premium?
- What's the average days-on-market for RENTAL listings here right now (not sales)? A rising rental-DOM trend means longer vacancies and softer asking-rent achievability than the comps imply.
- What's the recent tenant-quality profile in this submarket — average credit score on applications, eviction rate, late-payment / NSF rate, and stable-employment percentage? A property-management company in the area should have these aggregated.
- How much new apartment / multifamily construction is in the pipeline within 1–3 miles? Heavy new supply (>2% of stock underway) typically softens rents 12–24 months out; light construction supports rent growth.
Investment metrics
- 1% rule
- 1.62% ✓
- Cap rate
- 13.31%
- Cash-on-cash
- 25.05%
- DSCR
- 2.11
- GRM
- 5.2
CMA / ARV
No comps found within radius.
Projected returns pro-forma
-3.0% appreciation · 6.79% rent growth · sell at horizon
- IRR
- 22.8%
- Equity multiple
- 1.98×
- Total profit
- $329,319
- Equity at exit
- $178,924
- IRR
- 33.1%
- Equity multiple
- 4.58×
- Total profit
- $1,203,897
- Equity at exit
- $103,754
Cash invested: $336,000 (down + closing). Projections, not guarantees.
Landlord ↔ Tenant lean methodology
- Overall (STATE)
- 18 Strongly Tenant-Friendly
- State California
- 18 Strongly Tenant-Friendly · D+13
- County
- — inherits STATE
- City
- — inherits STATE
ZIP-level market 93305
- Home prices YoY
- -29.9%
- Rents YoY
- 6.8%
- Active inventory
- 143
- Price-to-rent
- 82.5×
Monthly cashflow live
- Estimated rent
- $19,400 high interval (Pro) →
- Mortgage (P&I)
- −$6,293
- Tax from tax record
- −$1,520 /mo · $18,239/yr
- Insurance
- −$500
- HOA
- −$0
- Vacancy / Maint / Mgmt
- −$4,074
- Net cashflow
- $7,013
Break-even live
16-unit breakdown (identical units grouped — click to expand)
| Units | Beds | Baths | Est. rent |
|---|---|---|---|
| 16× units | 2 | 1 | $19,392 |
| #1 | 2 | 1 | $1,212 |
| #2 | 2 | 1 | $1,212 |
| #3 | 2 | 1 | $1,212 |
| #4 | 2 | 1 | $1,212 |
| #5 | 2 | 1 | $1,212 |
| #6 | 2 | 1 | $1,212 |
| #7 | 2 | 1 | $1,212 |
| #8 | 2 | 1 | $1,212 |
| #9 | 2 | 1 | $1,212 |
| #10 | 2 | 1 | $1,212 |
| #11 | 2 | 1 | $1,212 |
| #12 | 2 | 1 | $1,212 |
| #13 | 2 | 1 | $1,212 |
| #14 | 2 | 1 | $1,212 |
| #15 | 2 | 1 | $1,212 |
| #16 | 2 | 1 | $1,212 |
| Total (16 units) | $19,400 | ||
UW: 25.0% down · 7.5% · 30yr · 1.5% tax · 5.0% vac · 8.0% maint · 8.0% mgmt
Financing live
Cash to close
- Down payment
- $300,000
- Closing costs
- $36,000
- Reserves months
- —
- Total cash needed
- —
Loan-product check · same deal, 3 products live
Conventional
25% down · 7.5% · 30yr
- Down + closing
- —
- Monthly P&I
- —
- Monthly cashflow
- —
- DSCR
- —
- Eligible?
- —
Personal DTI + credit; lowest rate.
DSCR
20% down · 8.5% · 30yr
- Down + closing
- —
- Monthly P&I
- —
- Monthly cashflow
- —
- DSCR
- —
- Eligible?
- —
No personal income docs; deal must DSCR.
Hard money
10% down · 12.0% · 12mo
- Down + closing
- —
- Monthly P&I
- —
- Monthly cashflow
- —
- DSCR
- —
- Eligible?
- —
Short-term bridge; refi at stabilization.
Listing history 14 events
-
2026-06-18days on market $1,200,000 Active 17 DOM
-
2026-06-17days on market $1,200,000 Active 16 DOM
-
2026-06-16days on market $1,200,000 Active 15 DOM
-
2026-06-15days on market $1,200,000 Active 14 DOM
-
2026-06-14days on market $1,200,000 Active 12 DOM
-
2026-06-10days on market $1,200,000 Active 9 DOM
-
2026-06-09days on market $1,200,000 Active 8 DOM
-
2026-06-08days on market $1,200,000 Active 7 DOM
-
2026-06-07days on market $1,200,000 Active 6 DOM
-
2026-06-05remarks 215-char remark
-
2026-06-05days on market $1,200,000 Active 3 DOM
-
2026-06-03days on market $1,200,000 Active 2 DOM
-
2026-06-02remarks 149-char remark
-
2026-06-02$1,200,000 Active 1 DOM
ⓘ Source: listings_history table (triggers on properties + properties_extension) + one-shot
backfill from property_details.listing_events for pre-trigger history.
Tax reassessment forecast CA · Resets to sale price
- Current annual tax
- $18,239 · $1,520/mo
- Projected year-2 tax
- $18,239 · $1,520/mo
- Expected delta
- $0/yr ($0/mo · 0.0%)
ⓘ Screening estimate from a state-policy table — verify with the county assessor before closing.
Climate risk First Street
- Flood 1/10 Low FEMA zone X (unshaded) · 0% chance over 30 yrs
- Wildfire 1/10 Low
- Heat 8/10 Severe 7 d/yr ≥105°F today · 19 d/yr by 30 yrs out
- Wind 1/10 Low
- Air quality 10/10 Extreme 39 unhealthy d/yr today · 45 by 30 yrs out
Nearby sold comps map
Loading sold comps map…
Walkable amenities ~0.75 mi
Loading nearby amenities…
Taxation est. · year 1
- Rental income
- $232,800
- − Mortgage interest
- −$67,219
- − Property taxes
- −$18,239
- − Insurance
- −$6,000
- − Repairs & maintenance
- −$18,624
- − Management
- −$18,624
- − Depreciation
- −$34,909
- Taxable income
- $69,185
- Est. tax owed @ 24.0%
- −$16,605
- After-tax cash flow
- $67,554/yr
For passive investors: Depreciation is non-cash, so a rental often shows a tax loss while cash-flowing — sheltering income. Rental losses are passive: they offset passive income freely, and up to $25,000/yr can offset ordinary (W-2) income if you actively participate and your MAGI is under $100k (phasing out to $0 by $150k); unused losses carry forward. On sale, claimed depreciation is recaptured at up to 25%, and gains may owe capital-gains tax (a 1031 exchange can defer both). Figures are a year-1 estimate at your 24.0% rate — not tax advice; consult a CPA.
Schools (NCES district)
- District
- Kern High
- NCES district ID
- 0619540
- Math proficiency
- 21% ▬ 0.00%
- Reading proficiency
- 51% ▲ 2.00%
- Median HH income
- $49,686
- Composite
- 33.68/100
- National rank
- #10443
- State rank
- #860 of 1400 in CA
Livability — Bakersfield
- Score
- 58/100
- State rank
- #716
- US rank
- #21355
Category grades
Schools grade is shown separately in the Schools card above.
Census & demographics
- Census place
- Bakersfield, CA
- County
- Kern County · 710,371 people
- City population
- 499,124
- Metro
- Bakersfield, CA
- Population (ZIP)
- 37,714
- Household income
- $43,244
- Rent vs Own
- Severe rent burden
- 2376.0
Population outlook (Kern County) Hauer SSP2
- Today (2025)
- 947,286 people
- By 2030
- 978,984 · +3.3%
- By 2040
- 1,045,018 · +10.3%
- By 2050
- 1,105,232 · +16.7%
- By 2075
- 1,229,538 · +29.8%
- By 2100
- 1,238,059 · +30.7%
Race, ethnicity, and origin ACS 2023
- Neighborhood character
- Predominantly Hispanic (76%)
- Race & ethnicity
- Hispanic / Latino 76% Two or more races 18% White 16% Black 5% Native American 3%
- Hispanic origin (detail)
- Mexican 69% Puerto Rican 1%
- Common ancestry
- Lithuanian 1% Serbian 1% Dutch 1%
- Foreign-born
- 22% · Canada
- Languages at home
- 45% English-only · Spanish 54%
Political lean MEDSL · Kern
- 2024 margin
- Strong R (+21.1) · D 38.2% · R 59.3% · Other 2.5%
- 2008→2024 swing
- -3.3pp toward R · 2008: -17.8pp · 2024: -21.1pp
- All cycles
- 2024: R+21.1 2020: R+10.2 2016: R+15.0 2012: R+20.9 2008: R+17.8
Not yet ingested
- Civics
- —
Market trends
- HPI YoY
- ▼ -181.24%
- Current HPI
- 424.6051
- Rent YoY
- ▲ 6.79%
- Metro
- Bakersfield, CA
- State GDP YoY
- ▲ 3.21%
- F500 in state
- 116
Industry mix (Fortune 500 HQ in CA)
| Industry | F500 HQs | Revenue |
|---|---|---|
| Technology | 27 | $1,492B |
|
||
| Financial Services | 3 | $174B |
|
||
| Retail | 3 | $44B |
|
||
| Insurance | 3 | $26B |
|
||
| Media / Entertainment | 2 | $115B |
|
||
| Pharmaceuticals / Biotech | 2 | $62B |
|
||
Price history
+50.9% since first listed5 events — show timeline
- 2026-06-01 Listed $1,200,000 GEMLS
- 2004-11-12 Sold (Public Records) $795,000 Public Records
- 2004-11-12 Sold (MLS) $795,000 GEMLS
- 2004-06-28 Delisted — GEMLS
- 2004-06-23 Listed $795,000 GEMLS
Property tax history
+6.5%/yrLatest (2025): $18,239 · +1.6% YoY. Source: county tax records.
Cash-flow waterfall
monthlySold comps — $/sqft
last 12 mo · ≤1 miLoading sold comps…