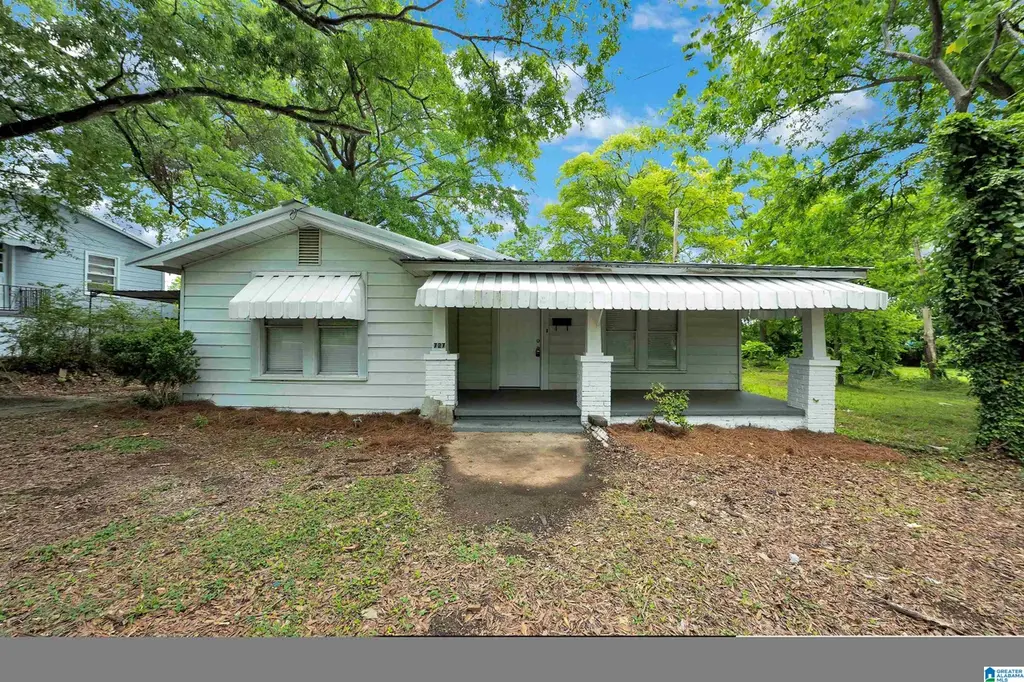
727 9th St · Bessemer, AL
Flood risk 1/10 · Minimal
- FEMA flood zone
- X (unshaded)
- Chance of flooding over 30 yrs
- 0.0%
- Est. flood insurance / yr
- $507 – $1,088
Fire risk 2/10 · Minimal
- Est. fire insurance / yr
- $916 – $1,700
Heat risk 7/10 · Major
- Hot days now (above 108°F)
- 7 days/yr
- Hot days in 30 yrs
- 19 days/yr
Wind risk 6/10 · Moderate
- Chance of severe wind over 30 yrs
- 36.0%
Air-quality risk 3/10 · Minor
- Unhealthy air days now
- 2 days/yr
- Unhealthy air days in 30 yrs
- 5 days/yr
Risk factors via First Street. Map © Google.
Why this score? — see what drove the C- grade
The composite is a weighted blend of 9 inputs, each scored 0–100. Each bar is that input's sub-score; the figure is the points it added to the 100-point composite (weight × sub-score).
- Cash flow +25.7/30.0
- DSCR +8.6/10.0
- 1% rule +7.0/10.0
- ARV discount +4.8/15.0
- Livability +3.0/5.0
- Condition / age +2.5/5.0
- Rent growth +1.7/5.0
- Schools +0.8/10.0
- Appreciation +0.0/10.0
$115,000
🖨 Deal sheet 📄 Offer letter ✓ Due diligence
Listing remarks MLS
Investment property Current Rent $1225 leased through2/28/27. This residence is an entertainer's delight with spacious bedrooms, granite countertops, and fresh paint exuding luxury. Enjoy the cozy charm of the front porch or retreat to the backyard patio for al fresco gatherings. Inside, revel in ample closet space and the beauty of easy-to-clean luxury vinyl plank floors. This isn't just a home; it's a lifestyle, offering comfort and excitement. Your dream rental, complete with front porch allure and a back patio oasis, is ready for you!
Key facts
- 8,276 sq ft lot
- 2 garage spots
- Built 1950
Neighborhood map
What this means for you Summary
Snapshot
- This is a 4-bed/1.0-bath single-family listed at $115k.
Deal economics
- At list price, monthly cash flow is $275 ($3k/yr) — positive.
- The deal already cash-flows at list — no discount required.
- Meets the 1% rule at list price ($1k rent vs $115k).
- Recommended offer: $101k (12.0% below list) — sets the bar for market timing.
- Cap rate 9.2% vs local median 5.9% in Bessemer — top-decile yield for the area; either an underpriced asset or a hidden risk that comps aren't pricing in. Stress-test before assuming the spread holds.
Location & tenants
- Location reads 59/100 on livability (#331 in AL) — a working-class tenant base; expect higher turnover. Strengths: commute A+, cost of living A+, housing A; Watch: schools D-, crime F, amenities F.
- Bessemer City (suburban): math 3% / reading 19% proficiency, ranked #120 of 129 in AL (top 93%) — low school quality limits family demand, transient renter base, plan for 1-2y turnover; 87% free/reduced lunch — lower-income household profile, screen leases tightly.
- Market conditions: Rents falling (-3.1%/yr); 115 active listings in the ZIP; 13 comparable units currently listed for rent nearby; rentals at typical pace (median 24d on market — plan ~3-4 weeks tenant-placement turnaround); lower-income renter base — watch delinquency; 2,114 units permitted in Jefferson County in 2024 (556 in 5+ unit buildings).
- At $1,376/mo this rent would consume 47% of the median local household income ($35k/yr) (locally 1001% of renters already pay >50% of income on rent) — very limited rent-growth headroom before tenants either downsize or default.
Forward outlook
- Local home prices are declining (-3.0%/yr); year-one equity from $795 of loan paydown is wiped out by about $3k of value loss. Plan a longer hold.
- Jefferson County population projected to shrink 4% by 2050 — rents likely to lag national; underwrite the cash flow, not the appreciation.
Negotiation context
- It's been on market 726 days — a 12% lower offer ($101k) is reasonable based on typical stale-listing flexibility.
- 2 sale attempts since 5y ago with the ask held roughly flat each time — persistent listings suggest the price (not the market) is what's stuck; bring a comps-based counter.
- Current owner paid $52k; list at $115k implies a 123% gain — meaningful room to come down on a strong offer.
Risks & watch-outs
- Watch-outs: built in 1950 — expect roof / HVAC / electrical / plumbing capex.
- Climate carrying-cost: major wind risk, 36% chance of damaging wind over 30y; extreme-heat days projected 7→19/yr by 2055 (HVAC capex compounding) — expect insurance premiums to compound above CPI over the hold.
Questions for the listing agent
- It's been on market 726 days. Have you received any prior offers? Is the seller open to a 12% concession, seller financing, or rate buy-down credit?
- Built in 1950 — when were the roof, HVAC, electrical panel, plumbing, and water heater last replaced?
- Why hasn't it sold? Are there any deal-killer items the seller is aware of (foundation, flood, title, zoning, code violations)?
- Is there a deadline driving the sale (1031 exchange, divorce, estate, relocation)? That informs how much negotiation room exists.
- Schools are D-rated, which usually means shorter tenancies and higher turnover. Who's the typical renter profile here, and what's been the actual vacancy rate?
- Crime grade is F in this area — have there been break-ins, vandalism, or insurance claims at this property in the last 3 years? What carrier currently insures it and at what premium?
- What's the average days-on-market for RENTAL listings here right now (not sales)? A rising rental-DOM trend means longer vacancies and softer asking-rent achievability than the comps imply.
- What's the recent tenant-quality profile in this submarket — average credit score on applications, eviction rate, late-payment / NSF rate, and stable-employment percentage? A property-management company in the area should have these aggregated.
- How much new for-sale + rental construction is in the pipeline within 1–3 miles? Heavy new supply typically softens prices + rents 12–24 months out; constrained supply supports both.
Investment metrics
- 1% rule
- 1.20% ✓
- Cap rate
- 9.16%
- Cash-on-cash
- 10.24%
- DSCR
- 1.46
- GRM
- 7.0
CMA / ARV
- ARV (median comp)
- $108,387
- List price
- $115,000
- Delta
- 6.10%
- Verdict
- FAIR
- Comps
- 20 within 1.0 mi
Show comp detail 4 sales within ~0.75 mi
| Address | Dist | Beds/Ba | Sqft | Sold | Price | $/sf | Match |
|---|---|---|---|---|---|---|---|
| 1025 Westlake Blvd | 0.41mi | 3/2.0 (-1) | 1,904 (+2%) | 19mo | $95,000 | $50 | 53 |
| 1531 N 7th Ave | 0.64mi | 4/1.0 | 1,898 (+2%) | 21mo | $20,000 | $11 | 50 |
| 817 4th Ave N | 0.34mi | 3/1.5 (-1) | 1,626 (-13%) | 21mo | $85,000 | $52 | 39 |
| 1520 3rd Ave | 0.72mi | 4/2.0 | 2,042 (+10%) | 12mo | $165,000 | $81 | 36 |
Match score weights: distance 35% · size 25% · config 20% · recency 20%. Top-matched comps best support the ARV.
Projected returns pro-forma
-3.0% appreciation · 0.0% rent growth · sell at horizon
- IRR
- -4.4%
- Equity multiple
- 0.84×
- Total profit
- $-5,138
- Equity at exit
- $17,147
- IRR
- 1.3%
- Equity multiple
- 1.08×
- Total profit
- $2,603
- Equity at exit
- $9,943
Cash invested: $32,200 (down + closing). Projections, not guarantees.
Landlord ↔ Tenant lean methodology
- Overall (STATE)
- 90 Strongly Landlord-Friendly
- State Alabama
- 90 Strongly Landlord-Friendly · R+15
- County
- — inherits STATE
- City
- — inherits STATE
ZIP-level market 35020
- Home prices YoY
- -24.2%
- Rents YoY
- -3.1%
- Active inventory
- 115
- Price-to-rent
- 7.0×
Monthly cashflow live
- Estimated rent
- $1,376 high interval (Pro) →
- Mortgage (P&I)
- −$603
- Tax from tax record
- −$161 /mo · $1,933/yr
- Insurance
- −$48
- HOA
- −$0
- Vacancy / Maint / Mgmt
- −$289
- Net cashflow
- $275
Break-even live
UW: 25.0% down · 7.5% · 30yr · 1.5% tax · 5.0% vac · 8.0% maint · 8.0% mgmt
Financing live
Cash to close
- Down payment
- $28,750
- Closing costs
- $3,450
- Reserves months
- —
- Total cash needed
- —
Loan-product check · same deal, 3 products live
Conventional
25% down · 7.5% · 30yr
- Down + closing
- —
- Monthly P&I
- —
- Monthly cashflow
- —
- DSCR
- —
- Eligible?
- —
Personal DTI + credit; lowest rate.
DSCR
20% down · 8.5% · 30yr
- Down + closing
- —
- Monthly P&I
- —
- Monthly cashflow
- —
- DSCR
- —
- Eligible?
- —
No personal income docs; deal must DSCR.
Hard money
10% down · 12.0% · 12mo
- Down + closing
- —
- Monthly P&I
- —
- Monthly cashflow
- —
- DSCR
- —
- Eligible?
- —
Short-term bridge; refi at stabilization.
Rent comps 13 comps
| Address | Beds | Baths | Sqft | Rent | $/sqft | DOM | Units | Dist |
|---|---|---|---|---|---|---|---|---|
| 1420 3rd Ave N Bessemer, AL | 5.0 | 3.0 | 2160 | $1,450 | $0.67 | 43d | 1 | 0.63mi |
| 1510 Berkley Ave Bessemer, AL | 4.0 | 2.0 | 2329 | $1,540 | $0.66 | 15d | 1 | 0.95mi |
| 18 Center St Bessemer, AL | 3.0 | 1.0 | 1418 | $1,100 | $0.78 | 43d | 1 | 1.00mi |
| 200 Center St Bessemer, AL | 3.0 | 1.5 | 1826 | $1,200 | $0.66 | 10d | 1 | 1.03mi |
| 434 Bryant St Bessemer, AL | 4.0 | 2.0 | 1540 | $1,523 | $0.99 | 3d | 1 | 1.11mi |
| 306 W Lake Cir SW Bessemer, AL | 1.0–3.0 | 1.0–2.0 | 1004 | $1,455 | $1.45 | 1d | 1 | 1.11mi |
| 320 16th St S Bessemer, AL | 3.0 | 1.5 | 1792 | $950 | $0.53 | 43d | 1 | 1.12mi |
| 2028 13th St N Bessemer, AL | 3.0 | 2.0 | 1372 | $1,073 | $0.78 | 23d | 1 | 1.13mi |
| 2129 13th St N Bessemer, AL | 4.0 | 1.0 | 1378 | $1,445 | $1.05 | 14d | 1 | 1.22mi |
| 236 Clifton St Bessemer, AL | 3.0 | 1.0 | 1450 | $1,100 | $0.76 | 43d | 1 | 1.26mi |
| 63 Bluebell St Bessemer, AL | 4.0 | 2.0 | 1232 | $1,399 | $1.14 | 15d | 1 | 1.32mi |
| 704 Avenue I Bessemer, AL | 3.0 | 1.0 | 1232 | $1,200 | $0.97 | 23d | 1 | 1.34mi |
| 1811 Fairfax Ave Bessemer, AL | 4.0 | 2.0 | 1732 | $1,350 | $0.78 | 23d | 1 | 1.44mi |
Listing history 20 events
-
2026-06-18days on market $115,000 Active 726 DOM
-
2026-06-17days on market $115,000 Active 725 DOM
-
2026-06-16days on market $115,000 Active 724 DOM
-
2026-06-15days on market $115,000 Active 723 DOM
-
2026-06-13days on market $115,000 Active 721 DOM
-
2026-06-10days on market $115,000 Active 718 DOM
-
2026-06-09days on market $115,000 Active 717 DOM
-
2026-06-08days on market $115,000 Active 716 DOM
-
2026-06-07days on market $115,000 Active 715 DOM
-
2026-06-05days on market $115,000 Active 712 DOM
-
2026-06-03days on market $115,000 Active 711 DOM
-
2026-06-02days on market $115,000 Active 710 DOM
-
2026-06-01days on market $115,000 Active 709 DOM
-
2026-05-31days on market $115,000 Active 708 DOM
-
2026-02-25price $115,000 545-char remark
Show marketing remark (545 chars)
Investment property Current Rent $1225 leased through2/28/27. This residence is an entertainer's delight with spacious bedrooms, granite countertops, and fresh paint exuding luxury. Enjoy the cozy charm of the front porch or retreat to the backyard patio for al fresco gatherings. Inside, revel in ample closet space and the beauty of easy-to-clean luxury vinyl plank floors. This isn't just a home; it's a lifestyle, offering comfort and excitement. Your dream rental, complete with front porch allure and a back patio oasis, is ready for you!
-
2024-06-22$120,000 Active 545-char remark
Show marketing remark (545 chars)
Investment property Current Rent $1225 leased through2/28/27. This residence is an entertainer's delight with spacious bedrooms, granite countertops, and fresh paint exuding luxury. Enjoy the cozy charm of the front porch or retreat to the backyard patio for al fresco gatherings. Inside, revel in ample closet space and the beauty of easy-to-clean luxury vinyl plank floors. This isn't just a home; it's a lifestyle, offering comfort and excitement. Your dream rental, complete with front porch allure and a back patio oasis, is ready for you!
-
2021-09-20soldstatus $51,500
-
2021-06-22soldstatus $104,000
-
2021-06-18soldstatus $104,000 94-char remark
Show marketing remark (94 chars)
Beautiful home in Bessemer with 4 bedrooms and 1 bathroom. Nice interior - living and kitchen!
-
2021-04-15$104,000 94-char remark
Show marketing remark (94 chars)
Beautiful home in Bessemer with 4 bedrooms and 1 bathroom. Nice interior - living and kitchen!
ⓘ Source: listings_history table (triggers on properties + properties_extension) + one-shot
backfill from property_details.listing_events for pre-trigger history.
Tax reassessment forecast AL · Resets to sale price
- Current annual tax
- $1,933 · $161/mo
- Projected year-2 tax
- $1,933 · $161/mo
- Expected delta
- $0/yr ($0/mo · -0.0%)
ⓘ Screening estimate from a state-policy table — verify with the county assessor before closing.
Climate risk First Street
- Flood 1/10 Low FEMA zone X (unshaded) · 0% chance over 30 yrs
- Wildfire 2/10 Low
- Heat 7/10 Severe 7 d/yr ≥108°F today · 19 d/yr by 30 yrs out
- Wind 6/10 Major 36% chance of damaging wind over 30 yrs
- Air quality 3/10 Moderate 2 unhealthy d/yr today · 5 by 30 yrs out
Nearby sold comps map
Loading sold comps map…
Walkable amenities ~0.75 mi
Loading nearby amenities…
Taxation est. · year 1
- Rental income
- $16,509
- − Mortgage interest
- −$6,442
- − Property taxes
- −$1,933
- − Insurance
- −$575
- − Repairs & maintenance
- −$1,321
- − Management
- −$1,321
- − Depreciation
- −$3,345
- Taxable income
- $1,572
- Est. tax owed @ 24.0%
- −$377
- After-tax cash flow
- $2,919/yr
For passive investors: Depreciation is non-cash, so a rental often shows a tax loss while cash-flowing — sheltering income. Rental losses are passive: they offset passive income freely, and up to $25,000/yr can offset ordinary (W-2) income if you actively participate and your MAGI is under $100k (phasing out to $0 by $150k); unused losses carry forward. On sale, claimed depreciation is recaptured at up to 25%, and gains may owe capital-gains tax (a 1031 exchange can defer both). Figures are a year-1 estimate at your 24.0% rate — not tax advice; consult a CPA.
Schools (NCES district)
- District
- Bessemer City
- NCES district ID
- 0100330
- Math proficiency
- 3% ▼ -18.00%
- Reading proficiency
- 19% ▼ -3.00%
- Median HH income
- $29,721
- Composite
- 8.45/100
- National rank
- #9905
- State rank
- #120 of 129 in AL
Livability — Bessemer
- Score
- 59/100
- State rank
- #331
- US rank
- #20078
Category grades
Schools grade is shown separately in the Schools card above.
Census & demographics
- Census place
- Bessemer, AL
- County
- Jefferson County · 527,445 people
- City population
- 48,018
- Metro
- Birmingham-Hoover, AL
- Population (ZIP)
- 24,892
- Household income
- $35,362
- Rent vs Own
- Severe rent burden
- 1001.0
Population outlook (Jefferson County) Hauer SSP2
- Today (2025)
- 669,185 people
- By 2030
- 669,694 · +0.1%
- By 2040
- 661,388 · -1.2%
- By 2050
- 643,086 · -3.9%
- By 2075
- 577,267 · -13.7%
- By 2100
- 474,758 · -29.1%
Race, ethnicity, and origin ACS 2023
- Neighborhood character
- Predominantly Black (74%)
- Race & ethnicity
- Black 74% Hispanic / Latino 13% White 11% Two or more races 6%
- Hispanic origin (detail)
- Mexican 10%
- Foreign-born
- 5% · Canada
- Languages at home
- 89% English-only · Spanish 11%
Political lean MEDSL · Jefferson
- 2024 margin
- D (+10.4) · D 54.6% · R 44.2% · Other 1.2%
- 2008→2024 swing
- +5.4pp toward D · 2008: 5.1pp · 2024: 10.4pp
- All cycles
- 2024: D+10.4 2020: D+13.2 2016: D+7.2 2012: D+6.0 2008: D+5.1
Not yet ingested
- Civics
- —
Market trends
- HPI YoY
- ▼ -57.54%
- Current HPI
- 179.7702
- Rent YoY
- ▼ -3.12%
- Metro
- Birmingham-Hoover, AL
- State GDP YoY
- ▲ 2.94%
- F500 in state
- 4
Industry mix (Fortune 500 HQ in AL)
| Industry | F500 HQs | Revenue |
|---|---|---|
| Financial Services | 1 | $8B |
|
||
| Healthcare | 1 | $5B |
|
||
Price history
+10.6% since first listed6 events — show timeline
- 2026-02-25 Price Changed $115,000 Greater Alabama MLS
- 2024-06-22 Listed $120,000 Greater Alabama MLS
- 2021-09-20 Sold (Public Records) $51,500 Public Records
- 2021-06-22 Sold (Public Records) $104,000 Public Records
- 2021-06-18 Sold (MLS) $104,000 Greater Alabama MLS
- 2021-04-15 Listed $104,000 Greater Alabama MLS
Property tax history
+17.1%/yrLatest (2025): $1,933 · +0.0% YoY. Source: county tax records.
Cash-flow waterfall
monthlySold comps — $/sqft
last 12 mo · ≤1 miLoading sold comps…