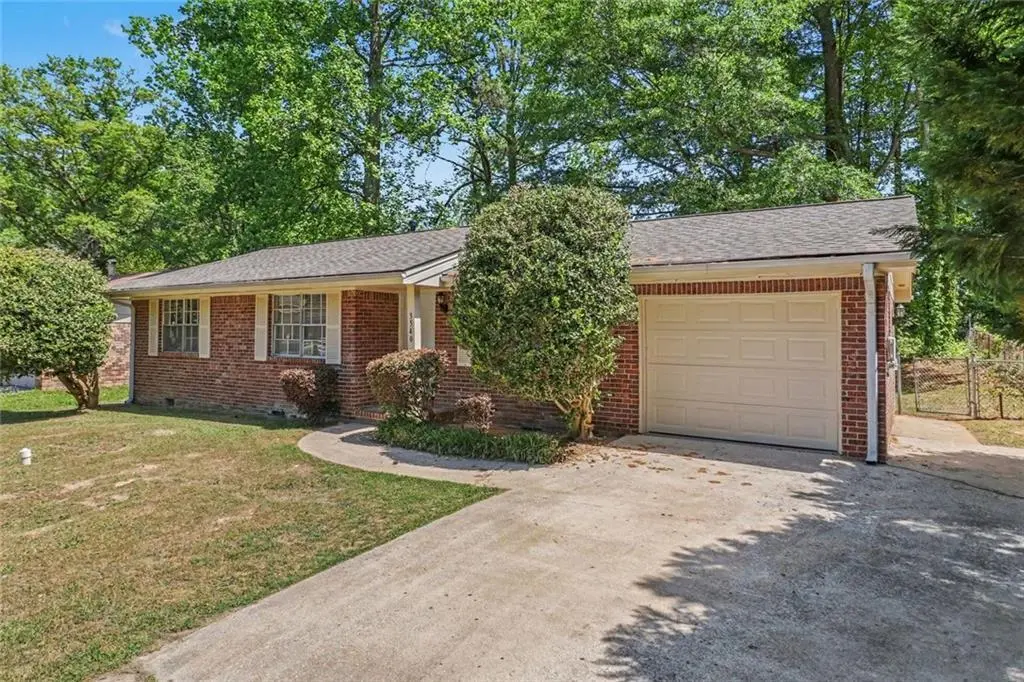
3540 Leisure Ln · South Fulton, GA
Flood risk 1/10 · Minimal
- FEMA flood zone
- X (unshaded)
- Chance of flooding over 30 yrs
- 0.0%
- Est. flood insurance / yr
- $473 – $860
Fire risk 3/10 · Minor
- Est. fire insurance / yr
- $963 – $1,789
Heat risk 6/10 · Moderate
- Hot days now (above 105°F)
- 7 days/yr
- Hot days in 30 yrs
- 18 days/yr
Wind risk 6/10 · Moderate
- Chance of severe wind over 30 yrs
- 27.0%
Air-quality risk 4/10 · Minor
- Unhealthy air days now
- 4 days/yr
- Unhealthy air days in 30 yrs
- 6 days/yr
Risk factors via First Street. Map © Google.
Why this score? — see what drove the C grade
The composite is a weighted blend of 9 inputs, each scored 0–100. Each bar is that input's sub-score; the figure is the points it added to the 100-point composite (weight × sub-score).
- ARV discount +14.4/15.0
- Cash flow +13.9/30.0
- Appreciation +10.0/10.0
- Schools +4.5/10.0
- DSCR +4.2/10.0
- 1% rule +4.0/10.0
- Rent growth +2.7/5.0
- Livability +2.5/5.0
- Condition / age +2.5/5.0
$204,900
🖨 Deal sheet 📄 Offer letter ✓ Due diligence
Listing remarks MLS
This three-bedroom, two-bathroom home is located in the Point Ridge neighborhood. The interior features a huge living area that serves as the centerpiece of the home, complemented by a functional layout with a mix of carpet and tile flooring throughout. The kitchen is equipped with granite and laminate countertops and features a mix of black and stainless steel appliances. The primary bedroom includes a large walk-in closet for ample storage. For added convenience, the home features an attached one-car garage with a dedicated laundry room area located inside. Situated with easy access to major Atlanta thoroughfares, this property ensures a convenient commute to local employers and the airport. Schedule your private showing today!
Key facts
- Large walk-in closet
- Huge living area
- 0.26 acre lot
Tags
Neighborhood map
What this means for you Summary
Snapshot
- This is a 3-bed/2.0-bath single-family listed at $205k.
Deal economics
- At list price, monthly cash flow is $21 ($254/yr) — positive.
- The deal already cash-flows at list — no discount required.
- To meet the 1% rule (rent ≥ 1% of price), the offer needs to be $185k (9.6% below list).
- Recommended offer: $185k (9.6% below list) — sets the bar for 1% rule.
- Cap rate 6.4% vs local median 4.6% in South Fulton — top-decile yield for the area; either an underpriced asset or a hidden risk that comps aren't pricing in. Stress-test before assuming the spread holds.
Location & tenants
- Location reads: area grade C — affects rentability + tenant quality, not the cash-flow math above.
- Fulton County (suburban): math 49% / reading 53% proficiency, ranked #12 of 174 in GA (top 7%) — acceptable for families but not a draw, mixed tenant base, ~2y average lease.
- Market conditions: Rents flat; 651 active listings in the ZIP; 24 comparable units currently listed for rent nearby; rentals at typical pace (median 25d on market — plan ~3-4 weeks tenant-placement turnaround); 11,565 units permitted in Fulton County in 2024 (8,159 in 5+ unit buildings).
- This rent runs 33% of the median local income ($67k/yr) — at the standard rent-burdened threshold; future hikes will face affordability resistance.
Forward outlook
- In year one you build about $22k of equity ($1k loan paydown + $20k appreciation (10.0% local appreciation)).
- Fulton County population projected at +38% by 2050 — long-run rental-demand tailwind backs the buy-and-hold thesis.
- At projected returns (10.0% appreciation + 0.9% rent growth), your $57k cash investment doubles in ~3 years — after that, you're playing with house money.
- By year 2, paydown + projected appreciation supports a ~$35k cash-out refi (75% LTV) — recoverable capital for the next deal without selling this one.
Negotiation context
- It's been on market 58 days — a 3% lower offer ($199k) is reasonable based on typical stale-listing flexibility.
- 4 sale attempts since 4y ago with the ask held roughly flat each time — persistent listings suggest the price (not the market) is what's stuck; bring a comps-based counter.
Risks & watch-outs
- Climate carrying-cost: major wind risk, 27% chance of damaging wind over 30y; extreme-heat days projected 7→18/yr by 2055 (HVAC capex compounding) — expect insurance premiums to compound above CPI over the hold.
Questions for the listing agent
- It's been on market 58 days. Have you received any prior offers? Is the seller open to a 10% concession, seller financing, or rate buy-down credit?
- Built in 1971 — when were the roof, HVAC, electrical panel, plumbing, and water heater last replaced?
- Is there a deadline driving the sale (1031 exchange, divorce, estate, relocation)? That informs how much negotiation room exists.
- What's the average days-on-market for RENTAL listings here right now (not sales)? A rising rental-DOM trend means longer vacancies and softer asking-rent achievability than the comps imply.
- What's the recent tenant-quality profile in this submarket — average credit score on applications, eviction rate, late-payment / NSF rate, and stable-employment percentage? A property-management company in the area should have these aggregated.
- How much new for-sale + rental construction is in the pipeline within 1–3 miles? Heavy new supply typically softens prices + rents 12–24 months out; constrained supply supports both.
Investment metrics
- 1% rule
- 0.90% ✗
- Cap rate
- 6.42%
- Cash-on-cash
- 0.44%
- DSCR
- 1.02
- GRM
- 9.2
CMA / ARV
- ARV (median comp)
- $241,718
- List price
- $204,900
- Delta
- -15.23%
- Verdict
- UNDERPRICED
- Comps
- 20 within 1.0 mi
Show comp detail 12 sales within ~0.75 mi
| Address | Dist | Beds/Ba | Sqft | Sold | Price | $/sf | Match |
|---|---|---|---|---|---|---|---|
| 3510 Leisure Ln | 0.04mi | 3/2.0 | 1,297 (+4%) | 18mo | $205,000 | $158 | 76 |
| 3400 Flat Shoals Rd | 0.42mi | 3/2.0 | 1,238 (-1%) | 8mo | $140,000 | $113 | 72 |
| 3420 Leisure Ln | 0.16mi | 3/2.0 | 1,388 (+11%) | 11mo | $225,000 | $162 | 65 |
| 3205 Cadiz Cir | 0.31mi | 4/2.0 (+1) | 1,309 (+5%) | 16mo | $217,000 | $166 | 60 |
| 3580 Keels Ln | 0.17mi | 3/2.0 | 1,368 (+10%) | 24mo | $234,999 | $172 | 57 |
| 245 Adena Ln W | 0.36mi | 4/2.0 (+1) | 1,348 (+8%) | 13mo | $230,000 | $171 | 54 |
| 6470 Cedar Hurst Trl | 0.39mi | 4/2.5 (+1) | 1,150 (-8%) | 9mo | $125,000 | $109 | 54 |
| 6850 Brown Dr S | 0.59mi | 3/2.0 | 1,344 (+8%) | 20mo | $207,000 | $154 | 43 |
| 6945 Brown Dr S | 0.70mi | 3/2.0 | 1,130 (-10%) | 13mo | $190,000 | $168 | 40 |
| 6949 Merrywood Dr | 0.67mi | 3/3.0 | 1,150 (-8%) | 20mo | $205,000 | $178 | 35 |
| 6878 Merrywood Dr | 0.58mi | 3/2.5 | 1,392 (+11%) | 22mo | $265,000 | $190 | 34 |
| 6900 Kimberly Mill Rd | 0.68mi | 4/2.0 (+1) | 1,118 (-10%) | 17mo | $229,000 | $205 | 32 |
Match score weights: distance 35% · size 25% · config 20% · recency 20%. Top-matched comps best support the ARV.
Projected returns pro-forma
10.0% appreciation · 0.95% rent growth · sell at horizon
- IRR
- 23.9%
- Equity multiple
- 2.90×
- Total profit
- $109,239
- Equity at exit
- $184,590
- IRR
- 20.7%
- Equity multiple
- 6.47×
- Total profit
- $313,740
- Equity at exit
- $398,076
Cash invested: $57,372 (down + closing). Projections, not guarantees.
Landlord ↔ Tenant lean methodology
- Overall (STATE)
- 90 Strongly Landlord-Friendly
- State Georgia
- 90 Strongly Landlord-Friendly · R+3
- County
- — inherits STATE
- City
- — inherits STATE
ZIP-level market 30349
- Home prices YoY
- 4.6%
- Rents YoY
- 0.9%
- Active inventory
- 651
- Price-to-rent
- 9.2×
Monthly cashflow live
- Estimated rent
- $1,853 high interval (Pro) →
- Mortgage (P&I)
- −$1,075
- Tax from tax record
- −$282 /mo · $3,390/yr
- Insurance
- −$85
- HOA
- −$0
- Vacancy / Maint / Mgmt
- −$389
- Net cashflow
- $21
Break-even live
UW: 25.0% down · 7.5% · 30yr · 1.5% tax · 5.0% vac · 8.0% maint · 8.0% mgmt
Financing live
Cash to close
- Down payment
- $51,225
- Closing costs
- $6,147
- Reserves months
- —
- Total cash needed
- —
Loan-product check · same deal, 3 products live
Conventional
25% down · 7.5% · 30yr
- Down + closing
- —
- Monthly P&I
- —
- Monthly cashflow
- —
- DSCR
- —
- Eligible?
- —
Personal DTI + credit; lowest rate.
DSCR
20% down · 8.5% · 30yr
- Down + closing
- —
- Monthly P&I
- —
- Monthly cashflow
- —
- DSCR
- —
- Eligible?
- —
No personal income docs; deal must DSCR.
Hard money
10% down · 12.0% · 12mo
- Down + closing
- —
- Monthly P&I
- —
- Monthly cashflow
- —
- DSCR
- —
- Eligible?
- —
Short-term bridge; refi at stabilization.
Rent comps 24 comps
| Address | Beds | Baths | Sqft | Rent | $/sqft | DOM | Units | Dist |
|---|---|---|---|---|---|---|---|---|
| 325 Pointer Ct Atlanta, GA | 3.0 | 2.0 | 1474 | $1,620 | $1.10 | 5d | 1 | 0.05mi |
| 6440 Connell Rd Atlanta, GA | 3.0 | 2.0 | 1391 | $1,695 | $1.22 | 24d | 1 | 0.13mi |
| 3500 Keels Ln Atlanta, GA | 3.0 | 2.0 | 1272 | $1,755 | $1.38 | 2d | 1 | 0.15mi |
| 6445 Connell Rd Atlanta, GA | 3.0 | 2.0 | 1357 | $1,856 | $1.37 | 43d | 1 | 0.16mi |
| 6500 Connell Rd Atlanta, GA | 3.0 | 2.0 | 1483 | $1,650 | $1.11 | 24d | 1 | 0.21mi |
| 2560 Foxlair Trl Atlanta, GA | 4.0 | 2.0 | 1485 | $1,795 | $1.21 | 24d | 1 | 0.26mi |
| 3800 Leisure Ln Atlanta, GA | 3.0 | 2.0 | 1198 | $2,350 | $1.96 | 22d | 1 | 0.38mi |
| 6415 El Caudillo Ct Atlanta, GA | 3.0 | 3.0 | 1498 | $2,800 | $1.87 | 4d | 1 | 0.46mi |
| 7045 Birling Dr Atlanta, GA | 4.0 | 3.0 | 1488 | $1,765 | $1.19 | 43d | 1 | 0.87mi |
| 6770 Buffington Rd Union City, GA | 1.0–3.0 | 1.0–2.0 | 950 | $1,699 | $1.79 | 2d | 24 | 0.87mi |
| 6345 Peppermill Ln Atlanta, GA | 3.0 | 2.5 | 1224 | $1,800 | $1.47 | 43d | 1 | 0.91mi |
| 6450 Peppermill Ln Atlanta, GA | 4.0 | 2.0 | 1188 | $1,531 | $1.29 | 24d | 1 | 0.91mi |
| 7060 Kimberly Mill Rd Atlanta, GA | 3.0 | 1.0 | 1056 | $1,425 | $1.35 | 5d | 1 | 0.95mi |
| 2820 Greenbower Ct Atlanta, GA | 3.0 | 2.0 | 1338 | $1,730 | $1.29 | 4d | 1 | 0.98mi |
| 4050 Morgan Rd Union City, GA | 1.0–3.0 | 1.0–2.0 | 988 | $1,750 | $1.77 | 5d | 21 | 1.11mi |
| 3105 Garnet Way Atlanta, GA | 3.0 | 2.0 | 1470 | $1,660 | $1.13 | 12d | 1 | 1.11mi |
| 3206 Pine Tree Trl Unit 15C Atlanta, GA | 3.0 | 2.5 | 1466 | $1,950 | $1.33 | 4d | 1 | 1.15mi |
| 6230 Cedar Wood Dr Atlanta, GA | 3.0 | 2.0 | 1238 | $1,694 | $1.37 | 43d | 1 | 1.27mi |
| 6560 Emerald Pointe Cir Atlanta, GA | 3.0 | 2.0 | 1309 | $1,500 | $1.15 | 22d | 1 | 1.34mi |
| 855 Old Rocky Rd Atlanta, GA | 3.0 | 2.0 | 1310 | $1,710 | $1.31 | 24d | 1 | 1.36mi |
| 2865 Spruce Point Rd Atlanta, GA | 4.0 | 2.0 | 1050 | $1,910 | $1.82 | 43d | 1 | 1.41mi |
| 2667 Rocky Ct Atlanta, GA | 3.0 | 2.5 | 1432 | $2,200 | $1.54 | 43d | 1 | 1.43mi |
| 2550 Hallie Mill Rd Atlanta, GA | 3.0 | 2.0 | 1372 | $1,600 | $1.17 | 12d | 1 | 1.44mi |
| 2592 Rocky Ct Atlanta, GA | 2.0 | 2.5 | 1424 | $2,000 | $1.40 | 43d | 1 | 1.47mi |
Listing history 26 events
-
2026-06-18days on market $204,900 Active 58 DOM
-
2026-06-17days on market $204,900 Active 57 DOM
-
2026-06-16days on market $204,900 Active 56 DOM
-
2026-06-15days on market $204,900 Active 55 DOM
-
2026-06-13pricedays on market $204,900 Active 53 DOM
-
2026-06-09days on market $209,900 Active 49 DOM
-
2026-06-08days on market $209,900 Active 48 DOM
-
2026-06-07days on market $209,900 Active 47 DOM
-
2026-06-04days on market $209,900 Active 44 DOM
-
2026-06-03days on market $209,900 Active 43 DOM
-
2026-06-01days on market $209,900 Active 41 DOM
-
2026-05-31days on market $209,900 Active 40 DOM
-
2026-04-21$214,900 New 741-char remark
Show marketing remark (741 chars)
This three-bedroom, two-bathroom home is located in the Point Ridge neighborhood. The interior features a huge living area that serves as the centerpiece of the home, complemented by a functional layout with a mix of carpet and tile flooring throughout. The kitchen is equipped with granite and laminate countertops and features a mix of black and stainless steel appliances. The primary bedroom includes a large walk-in closet for ample storage. For added convenience, the home features an attached one-car garage with a dedicated laundry room area located inside. Situated with easy access to major Atlanta thoroughfares, this property ensures a convenient commute to local employers and the airport. Schedule your private showing today!
-
2026-04-21$214,900 Active 741-char remark
Show marketing remark (741 chars)
This three-bedroom, two-bathroom home is located in the Point Ridge neighborhood. The interior features a huge living area that serves as the centerpiece of the home, complemented by a functional layout with a mix of carpet and tile flooring throughout. The kitchen is equipped with granite and laminate countertops and features a mix of black and stainless steel appliances. The primary bedroom includes a large walk-in closet for ample storage. For added convenience, the home features an attached one-car garage with a dedicated laundry room area located inside. Situated with easy access to major Atlanta thoroughfares, this property ensures a convenient commute to local employers and the airport. Schedule your private showing today!
-
2022-07-07soldstatus $251,000
-
2022-07-06soldstatus $251,000 Closed
-
2022-07-06soldstatus $251,000 Sold
-
2022-06-24status Pending
-
2022-06-21status Pending
-
2022-06-16historical Active Under Contract
-
2022-06-16historical Active Under Contract
-
2022-06-10$249,900 Active
-
2022-06-10$249,900 New
-
2007-06-13soldstatus $389,278
-
1994-01-27soldstatus $63,000
-
1980-07-29soldstatus $39,754
ⓘ Source: listings_history table (triggers on properties + properties_extension) + one-shot
backfill from property_details.listing_events for pre-trigger history.
Tax reassessment forecast GA · Resets to sale price
- Current annual tax
- $3,390 · $282/mo
- Projected year-2 tax
- $3,390 · $282/mo
- Expected delta
- $0/yr ($0/mo · 0.0%)
ⓘ Screening estimate from a state-policy table — verify with the county assessor before closing.
Climate risk First Street
- Flood 1/10 Low FEMA zone X (unshaded) · 0% chance over 30 yrs
- Wildfire 3/10 Moderate
- Heat 6/10 Major 7 d/yr ≥105°F today · 18 d/yr by 30 yrs out
- Wind 6/10 Major 27% chance of damaging wind over 30 yrs
- Air quality 4/10 Moderate 4 unhealthy d/yr today · 6 by 30 yrs out
Nearby sold comps map
Loading sold comps map…
Walkable amenities ~0.75 mi
Loading nearby amenities…
Taxation est. · year 1
- Rental income
- $22,230
- − Mortgage interest
- −$11,478
- − Property taxes
- −$3,390
- − Insurance
- −$1,024
- − Repairs & maintenance
- −$1,778
- − Management
- −$1,778
- − Depreciation
- −$5,961
- Taxable loss
- −$3,179
- Est. tax savings @ 24.0%
- +$763
- After-tax cash flow
- $1,016/yr
For passive investors: Depreciation is non-cash, so a rental often shows a tax loss while cash-flowing — sheltering income. Rental losses are passive: they offset passive income freely, and up to $25,000/yr can offset ordinary (W-2) income if you actively participate and your MAGI is under $100k (phasing out to $0 by $150k); unused losses carry forward. On sale, claimed depreciation is recaptured at up to 25%, and gains may owe capital-gains tax (a 1031 exchange can defer both). Figures are a year-1 estimate at your 24.0% rate — not tax advice; consult a CPA.
Schools (NCES district)
- District
- Fulton County
- NCES district ID
- 1302280
- Math proficiency
- 49% ▼ -2.00%
- Reading proficiency
- 53% ▬ 0.00%
- Median HH income
- $68,035
- Composite
- 45.33/100
- National rank
- #2640
- State rank
- #12 of 174 in GA
Livability — South Fulton
No livability data for this city. (Only ~50 U.S. cities are tracked.)
Census & demographics
- Census place
- South Fulton, GA
- County
- Fulton County · 1,094,430 people
- City population
- 127,674
- Metro
- Atlanta-Sandy Springs-Alpharetta, GA
- Population (ZIP)
- 79,872
- Household income
- $67,023
- Rent vs Own
- Severe rent burden
- 4258.0
Population outlook (Fulton County) Hauer SSP2
- Today (2025)
- 1,203,707 people
- By 2030
- 1,299,706 · +8.0%
- By 2040
- 1,488,256 · +23.6%
- By 2050
- 1,664,580 · +38.3%
- By 2075
- 2,036,072 · +69.2%
- By 2100
- 2,222,402 · +84.6%
Race, ethnicity, and origin ACS 2023
- Neighborhood character
- Predominantly Black (89%)
- Race & ethnicity
- Black 89% Hispanic / Latino 5% Two or more races 4% White 3%
- Foreign-born
- 9% · Canada
- Languages at home
- 88% English-only · Spanish 6% French/Haitian/Cajun 1%
Political lean MEDSL · Fulton
- 2024 margin
- Solid D (+44.9) · D 71.9% · R 27.0% · Other 1.1%
- 2008→2024 swing
- +9.8pp toward D · 2008: 35.0pp · 2024: 44.9pp
- All cycles
- 2024: D+44.9 2020: D+46.4 2016: D+42.1 2012: D+29.6 2008: D+35.0
Not yet ingested
- Civics
- —
Market trends
- HPI YoY
- ▲ 18.01%
- Current HPI
- 407.99
- Rent YoY
- ▲ 0.95%
- Metro
- Atlanta-Sandy Springs-Alpharetta, GA
- State GDP YoY
- ▲ 2.66%
- F500 in state
- 28
Industry mix (Fortune 500 HQ in GA)
| Industry | F500 HQs | Revenue |
|---|---|---|
| Paper / Packaging | 2 | $29B |
|
||
| Retail | 1 | $160B |
|
||
| Transportation / Logistics | 1 | $91B |
|
||
| Airlines | 1 | $62B |
|
||
| Consumer Goods | 1 | $47B |
|
||
| Utilities | 1 | $25B |
|
||
Price history
+440.6% since first listed14 events — show timeline
- 2026-04-21 Listed $214,900 FMLS
- 2026-04-21 Listed $214,900 GAMLS
- 2022-07-07 Sold (Public Records) $251,000 Public Records
- 2022-07-06 Sold (MLS) $251,000 GAMLS
- 2022-07-06 Sold (MLS) $251,000 FMLS
- 2022-06-24 Pending — FMLS
- 2022-06-21 Pending — FMLS
- 2022-06-16 Contingent — FMLS
- 2022-06-16 Contingent — GAMLS
- 2022-06-10 Listed $249,900 GAMLS
- 2022-06-10 Listed $249,900 FMLS
- 2007-06-13 Sold (Public Records) $389,278 Public Records
- 1994-01-27 Sold (Public Records) $63,000 Public Records
- 1980-07-29 Sold (Public Records) $39,754 Public Records
Property tax history
+7.2%/yrLatest (2025): $3,390 · -0.0% YoY. Source: county tax records.
Cash-flow waterfall
monthlySold comps — $/sqft
last 12 mo · ≤1 miLoading sold comps…