2850 Somerset Dr Unit 105L · Lauderdale Lakes, FL
Flood risk 1/10 · Minimal
- FEMA flood zone
- AH
- Chance of flooding over 30 yrs
- 0.0%
- Est. flood insurance / yr
- $1,142 – $2,507
Fire risk 1/10 · Minimal
- Est. fire insurance / yr
- $947 – $1,759
Heat risk 10/10 · Severe
- Hot days now (above 105°F)
- 7 days/yr
- Hot days in 30 yrs
- 26 days/yr
Wind risk 10/10 · Severe
- Chance of severe wind over 30 yrs
- 99.0%
Air-quality risk 3/10 · Minor
- Unhealthy air days now
- 3 days/yr
- Unhealthy air days in 30 yrs
- 3 days/yr
Risk factors via First Street. Map © Google.
Why this score? — see what drove the B grade
The composite is a weighted blend of 9 inputs, each scored 0–100. Each bar is that input's sub-score; the figure is the points it added to the 100-point composite (weight × sub-score).
- Cash flow +29.5/30.0
- 1% rule +10.0/10.0
- DSCR +10.0/10.0
- ARV discount +7.5/15.0
- Schools +4.1/10.0
- Livability +4.0/5.0
- Rent growth +3.2/5.0
- Condition / age +2.5/5.0
- Appreciation +0.0/10.0
$77,500
🖨 Deal sheet 📄 Offer letter ✓ Due diligence
Listing remarks
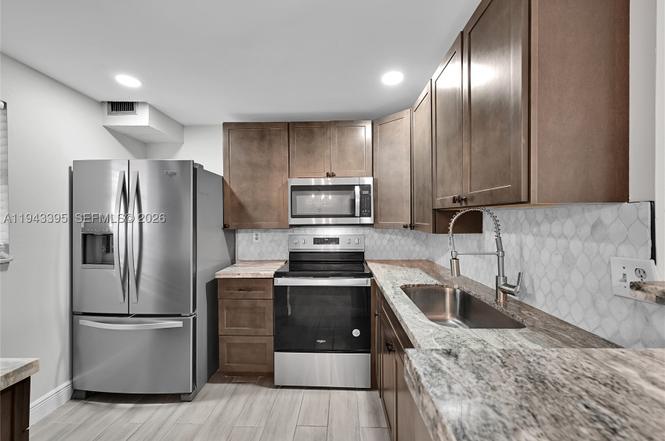
* * * PRICE IMPROVEMENT FOR QUICK SALE * * * Impeccably maintained 1-bedroom, 1-bath residence located in the desirable Somerset at Lauderdale Lakes. This inviting unit features ample walk-in closet space, a beautifully remodeled bathroom, and generous storage throughout. The upgraded kitchen offers a rare open-concept design, combining convenience and modern style. Enjoy relaxing sunset views from the screened balcony. The community offers 24-hour gated security and is designated for 55+ residents. Ideally located close to transportation and just minutes from area beaches, shopping, and dining.
Key facts
- $492 HOA
- Parking
- Community pool
Property features AI
Finance
- Other: Pets allowed with restrictions or possible restrictions
- HOA & community: Monthly association fee; Association fees cover amenities, common areas, parking and pool(s); Association includes a pool; Senior community
Exterior
- Parking: Guest parking; One assigned space
- Security: Complex fenced
- Home design: Attached property; 1st floor entry; 4-story building; Resale unit
- Construction: Block construction
- Exterior features: Balcony; Screened balcony; Complex is fenced; Association pool
Interior
- Kitchen: Dishwasher; Electric range; Refrigerator
- Flooring: Tile flooring
- Bathrooms: 1 full bathroom
- Heating & cooling: Central heating; Central air conditioning
- Interior features: First-floor entry; Bedroom on main level
Neighborhood map
What this means for you Summary
Snapshot
- This is a 1-bed/1.0-bath condo listed at $78k.
Deal economics
- At list price, monthly cash flow is $124 ($1k/yr) — positive.
- The deal already cash-flows at list — no discount required.
- Meets the 1% rule at list price ($2k rent vs $78k).
- Recommended offer: $68k (12.0% below list) — sets the bar for market timing.
- Cap rate 10.6% vs local median 5.6% in Lauderdale Lakes — top-decile yield for the area; either an underpriced asset or a hidden risk that comps aren't pricing in. Stress-test before assuming the spread holds.
Location & tenants
- Location reads 81/100 on livability (#100 in FL, #1,527 nationally) — a professional / high-income tenant draw. Strengths: commute A+, cost of living A+, housing A+; Watch: schools C-, crime D+, amenities F.
- Broward (suburban): math 42% / reading 53% proficiency, ranked #46 of 73 in FL (top 63%) — families likely to look elsewhere, expect single-tenant / working-renter base with shorter leases.
- Market conditions: Rents rising (+2.8%/yr); 585 active listings in the ZIP; 33 comparable units currently listed for rent nearby; rentals at typical pace (median 22d on market — plan ~3-4 weeks tenant-placement turnaround); 2,111 units permitted in Broward County in 2024 (1,265 in 5+ unit buildings).
- This rent runs 35% of the median local income ($54k/yr) — at the standard rent-burdened threshold; future hikes will face affordability resistance.
Forward outlook
- Local home prices are declining (-3.0%/yr); year-one equity from $536 of loan paydown is wiped out by about $2k of value loss. Plan a longer hold.
- Broward County population projected at +34% by 2050 — long-run rental-demand tailwind backs the buy-and-hold thesis.
Negotiation context
- It's been on market 158 days — a 12% lower offer ($68k) is reasonable based on typical stale-listing flexibility.
- 8 sale attempts since 2y ago; this cycle's ask is 5436% above the opening price — seller raised mid-cycle; expect resistance to lowballs.
- Current owner paid $14k; list at $78k implies a 474% gain — meaningful room to come down on a strong offer.
Risks & watch-outs
- Watch-outs: flood insurance adds $152/mo; HOA is 31% of rent.
- Climate carrying-cost: in FEMA flood zone AH (mandatory federal flood insurance); severe wind risk, 99% chance of damaging wind over 30y; extreme-heat days projected 7→26/yr by 2055 (HVAC capex compounding) — expect insurance premiums to compound above CPI over the hold.
Questions for the listing agent
- It's been on market 158 days. Have you received any prior offers? Is the seller open to a 12% concession, seller financing, or rate buy-down credit?
- What's the actual annual flood-insurance premium (NFIP or private), and is the property in a SFHA with mandatory coverage?
- What does the HOA fee cover, when was the last increase, and are there any pending special assessments or reserve-fund shortfalls?
- Any open or pending special assessments — roof, HVAC, plumbing, elevator, façade? What's the per-unit balance and payoff schedule, and is the seller paying it off at close or rolling it to the buyer?
- Why hasn't it sold? Are there any deal-killer items the seller is aware of (foundation, flood, title, zoning, code violations)?
- Is there a deadline driving the sale (1031 exchange, divorce, estate, relocation)? That informs how much negotiation room exists.
- Crime grade is D in this area — have there been break-ins, vandalism, or insurance claims at this property in the last 3 years? What carrier currently insures it and at what premium?
- What's the average days-on-market for RENTAL listings here right now (not sales)? A rising rental-DOM trend means longer vacancies and softer asking-rent achievability than the comps imply.
- What's the recent tenant-quality profile in this submarket — average credit score on applications, eviction rate, late-payment / NSF rate, and stable-employment percentage? A property-management company in the area should have these aggregated.
- How much new apartment / multifamily construction is in the pipeline within 1–3 miles? Heavy new supply (>2% of stock underway) typically softens rents 12–24 months out; light construction supports rent growth.
Investment metrics
- 1% rule
- 2.02% ✓
- Cap rate
- 10.57%
- Cash-on-cash
- 15.27%
- DSCR
- 1.68
- GRM
- 4.1
CMA / ARV
No comps found within radius.
Projected returns pro-forma
-3.0% appreciation · 2.78% rent growth · sell at horizon
- IRR
- -5.7%
- Equity multiple
- 0.79×
- Total profit
- $-4,624
- Equity at exit
- $11,556
- IRR
- 4.0%
- Equity multiple
- 1.29×
- Total profit
- $6,271
- Equity at exit
- $6,701
Cash invested: $21,700 (down + closing). Projections, not guarantees.
Landlord ↔ Tenant lean methodology
- Overall (STATE)
- 87 Strongly Landlord-Friendly
- State Florida
- 87 Strongly Landlord-Friendly · R+3
- County
- — inherits STATE
- City
- — inherits STATE
ZIP-level market 33311
- Rents YoY
- 2.8%
- Active inventory
- 585
- Price-to-rent
- 4.1×
Monthly cashflow live
- Estimated rent
- $1,563 high interval (Pro) →
- Mortgage (P&I)
- −$406
- Tax from tax record
- −$28 /mo · $334/yr
- Insurance
- −$32
- Flood insurance flood zone
- −$152 /mo · $1,824/yr
- HOA
- −$492
- Vacancy / Maint / Mgmt
- −$328
- Net cashflow
- $124
Break-even live
UW: 25.0% down · 7.5% · 30yr · 1.5% tax · 5.0% vac · 8.0% maint · 8.0% mgmt
Financing live
Cash to close
- Down payment
- $19,375
- Closing costs
- $2,325
- Reserves months
- —
- Total cash needed
- —
Loan-product check · same deal, 3 products live
Conventional
25% down · 7.5% · 30yr
- Down + closing
- —
- Monthly P&I
- —
- Monthly cashflow
- —
- DSCR
- —
- Eligible?
- —
Personal DTI + credit; lowest rate.
DSCR
20% down · 8.5% · 30yr
- Down + closing
- —
- Monthly P&I
- —
- Monthly cashflow
- —
- DSCR
- —
- Eligible?
- —
No personal income docs; deal must DSCR.
Hard money
10% down · 12.0% · 12mo
- Down + closing
- —
- Monthly P&I
- —
- Monthly cashflow
- —
- DSCR
- —
- Eligible?
- —
Short-term bridge; refi at stabilization.
Rent comps 33 comps
| Address | Beds | Baths | Sqft | Rent | $/sqft | DOM | Units | Dist |
|---|---|---|---|---|---|---|---|---|
| 2821 Somerset Dr #217 Lauderdale Lakes, FL | 1.0 | 1.0 | 748 | $1,400 | $1.87 | 3d | 1 | 0.07mi |
| 2841 Somerset Dr Lauderdale Lakes, FL | 1.0 | 1.0 | 696 | $1,598 | $2.30 | 11d | 3 | 0.16mi |
| 2851 Somerset Dr Lauderdale Lakes, FL | 1.0–2.0 | 1.0–2.0 | 827 | $1,300 | $1.57 | 3d | 2 | 0.17mi |
| 2871 Somerset Dr #207 Lauderdale Lakes, FL | 1.0 | 1.0 | 644 | $1,400 | $2.17 | 24d | 1 | 0.21mi |
| 3541 NW 30th Pl Lauderdale Lakes, FL | 1.0–3.0 | 1.0–2.0 | 865 | $1,739 | $2.01 | 2d | 14 | 0.51mi |
| 4141 NW 26th St #316 Lauderhill, FL | 1.0 | 1.0 | 624 | $1,450 | $2.32 | 24d | 1 | 0.95mi |
| 4121 NW 26th St Unit T16 Lauderhill, FL | 1.0 | 1.5 | 750 | $1,500 | $2.00 | 24d | 1 | 0.98mi |
| 3960 NW 31st Ter Unit 2 Lauderdale Lakes, FL | 1.0 | 1.0 | 720 | $1,500 | $2.08 | 24d | 1 | 0.98mi |
| 2417 NW 20th St Unit 1 Fort Lauderdale, FL | 2.0 | 1.0 | 649 | $1,700 | $2.62 | 8d | 1 | 1.05mi |
| 3033 NW 43rd Ave #108 Lauderdale Lakes, FL | 1.0 | 1.0 | 650 | $1,590 | $2.45 | 14d | 1 | 1.08mi |
| 3030 NW 43rd Ter #102 Lauderdale Lakes, FL | 1.0 | 1.0 | 710 | $1,450 | $2.04 | 24d | 1 | 1.10mi |
| 1816 NW 25th Ter Unit 2 Fort Lauderdale, FL | 1.0 | 1.0 | 450 | $1,600 | $3.56 | 3d | 1 | 1.11mi |
| 1816 NW 25th Ter Unit 2 Fort Lauderdale, FL | 1.0 | 1.0 | 450 | $1,600 | $3.56 | 14d | 1 | 1.11mi |
| 3030 NW 43rd Ter Lauderdale Lakes, FL | 1.0 | 1.0 | 592 | $1,400 | $2.36 | 2d | 2 | 1.11mi |
| 4160 NW 21st St Lauderhill, FL | 1.0–2.0 | 1.0 | 810 | $1,675 | $2.07 | 24d | 3 | 1.15mi |
| 4160 NW 21st St Lauderhill, FL | 1.0–2.0 | 1.0 | 810 | $1,599 | $1.97 | 8d | 2 | 1.15mi |
| 4130 NW 31st Ter Unit 1 Lauderdale Lakes, FL | 2.0 | 1.0 | 700 | $1,900 | $2.71 | 12d | 1 | 1.17mi |
| 2070 NW 43rd Ter #6 Lauderhill, FL | 1.0 | 1.0 | 600 | $1,600 | $2.67 | 22d | 1 | 1.26mi |
| 2707 NW 15th St Unit 2 Fort Lauderdale, FL | — | 1.0 | 375 | $1,175 | $3.13 | 15d | 1 | 1.27mi |
| 4047 NW 16th St #109 Lauderhill, FL | 1.0 | 1.0 | 725 | $1,300 | $1.79 | 24d | 1 | 1.29mi |
| 2708 NW 15th St Fort Lauderdale, FL | 2.0 | 1.0 | 750 | $1,700 | $2.27 | 24d | 1 | 1.31mi |
| 2620 NW 18th Ter #3 Oakland Park, FL | 2.0 | 1.0 | 744 | $2,000 | $2.69 | 24d | 1 | 1.37mi |
| 211 Lake Pointe Dr Oakland Park, FL | 1.0–2.0 | 1.0–2.0 | 805 | $1,650 | $2.05 | 3d | 2 | 1.43mi |
| 2554 NW 14th St Fort Lauderdale, FL | 1.0 | 1.0 | 400 | $1,500 | $3.75 | 24d | 1 | 1.46mi |
| 2571 NW 13th Ct Unit C Fort Lauderdale, FL | 2.0 | 1.0 | 700 | $1,600 | $2.29 | 21d | 1 | 1.47mi |
| 2571 NW 13th Ct Unit 3 Fort Lauderdale, FL | 2.0 | 1.0 | 700 | $1,600 | $2.29 | 24d | 1 | 1.47mi |
| 3061 NW 47th Ter Unit 327B Lauderdale Lakes, FL | 1.0 | 1.5 | 662 | $1,600 | $2.42 | 8d | 1 | 1.48mi |
| 3061 NW 47th Ter #327 Lauderdale Lakes, FL | 1.0 | 1.5 | 662 | $1,500 | $2.27 | 24d | 1 | 1.48mi |
| 3061 NW 47th Ter Unit 132C Lauderdale Lakes, FL | 1.0 | 1.0 | 610 | $1,500 | $2.46 | 24d | 1 | 1.48mi |
| 2901 NW 47th Ter Unit 247B Lauderdale Lakes, FL | 1.0 | 1.5 | 662 | $1,450 | $2.19 | 24d | 1 | 1.48mi |
| 2901 NW 47th Ter Unit 348B Lauderdale Lakes, FL | 1.0 | 1.5 | 662 | $1,350 | $2.04 | 24d | 1 | 1.48mi |
| 4299 NW 16th St #103 Lauderhill, FL | 1.0 | 1.0 | 700 | $1,400 | $2.00 | 24d | 1 | 1.49mi |
| 4299 NW 16th St #103 Lauderhill, FL | 1.0 | 1.0 | 700 | $1,400 | $2.00 | 8d | 1 | 1.49mi |
HOA detail condo
- Monthly dues
- $492 · $5,904/yr
- Likely covers
- security
- Assessments
- None detected in remarks — confirm with the listing agent.
Listing history 40 events
-
2026-06-18days on market $77,500 Active 158 DOM
-
2026-06-17days on market $77,500 Active 157 DOM
-
2026-06-16days on market $77,500 Active 156 DOM
-
2026-06-15days on market $77,500 Active 155 DOM
-
2026-06-13remarks 607-char remark
-
2026-06-13pricedays on market $77,500 Active 153 DOM
-
2026-06-09days on market $81,000 Active 149 DOM
-
2026-06-07days on market $81,000 Active 147 DOM
-
2026-06-04days on market $81,000 Active 144 DOM
-
2026-06-03days on market $81,000 Active 143 DOM
-
2026-06-02days on market $81,000 Active 142 DOM
-
2026-06-01days on market $81,000 Active 141 DOM
-
2026-05-31days on market $81,000 Active 140 DOM
-
2026-04-16$1,400
-
2026-04-15price $81,000
-
2026-02-05price $85,000
-
2026-01-10$89,900 Active
-
2025-09-21historical $1,300
-
2025-09-20historical
-
2025-06-30$1,300
-
2025-06-08historical $1,300
-
2025-04-16$1,300
-
2025-04-04price $90,000
-
2025-03-14$99,500 Active
-
2025-02-08historical $1,300
-
2025-02-08historical
-
2025-01-15price $85,000
-
2024-12-05$1,300
-
2024-12-05historical $1,300
-
2024-12-05$1,300
-
2024-12-04price $86,000
-
2024-12-02price $89,000
-
2024-11-30price $95,000
-
2024-11-18price $90,000
-
2024-10-07price $110,000
-
2024-06-14price $120,000
-
2024-06-04$125,000 Active
-
1997-07-03soldstatus $13,500
-
1993-09-23soldstatus $18,000
-
1980-02-01soldstatus $35,000
ⓘ Source: listings_history table (triggers on properties + properties_extension) + one-shot
backfill from property_details.listing_events for pre-trigger history.
Tax reassessment forecast FL · Resets to sale price
- Current annual tax
- $334 · $28/mo
- Projected year-2 tax
- $643 · $54/mo
- Expected delta
- +$309/yr (+$26/mo · 92.7%)
ⓘ Screening estimate from a state-policy table — verify with the county assessor before closing.
Climate risk First Street
- Flood 1/10 Low FEMA zone AH · 0% chance over 30 yrs
- Wildfire 1/10 Low
- Heat 10/10 Extreme 7 d/yr ≥105°F today · 26 d/yr by 30 yrs out
- Wind 10/10 Extreme 99% chance of damaging wind over 30 yrs
- Air quality 3/10 Moderate 3 unhealthy d/yr today · 3 by 30 yrs out
Nearby sold comps map
Loading sold comps map…
Walkable amenities ~0.75 mi
Loading nearby amenities…
Taxation est. · year 1
- Rental income
- $18,754
- − Mortgage interest
- −$4,341
- − Property taxes
- −$334
- − Insurance
- −$2,212
- − Repairs & maintenance
- −$1,500
- − Management
- −$1,500
- − HOA
- −$5,904
- − Depreciation
- −$2,255
- Taxable income
- $708
- Est. tax owed @ 24.0%
- −$170
- After-tax cash flow
- $1,319/yr
For passive investors: Depreciation is non-cash, so a rental often shows a tax loss while cash-flowing — sheltering income. Rental losses are passive: they offset passive income freely, and up to $25,000/yr can offset ordinary (W-2) income if you actively participate and your MAGI is under $100k (phasing out to $0 by $150k); unused losses carry forward. On sale, claimed depreciation is recaptured at up to 25%, and gains may owe capital-gains tax (a 1031 exchange can defer both). Figures are a year-1 estimate at your 24.0% rate — not tax advice; consult a CPA.
Schools (NCES district)
- District
- Broward
- NCES district ID
- 1200180
- Math proficiency
- 42% ▼ -18.00%
- Reading proficiency
- 53% ▼ -5.00%
- Median HH income
- $52,139
- Composite
- 40.88/100
- National rank
- #3621
- State rank
- #46 of 73 in FL
Livability — Lauderdale Lakes
- Score
- 81/100
- State rank
- #100
- US rank
- #1527
Category grades
Schools grade is shown separately in the Schools card above.
Census & demographics
- Census place
- Lauderdale Lakes, FL
- County
- Broward County · 1,963,430 people
- Metro
- Miami-Fort Lauderdale-Pompano Beach, FL
- Population (ZIP)
- 74,898
- Household income
- $53,973
- Rent vs Own
- Severe rent burden
- 5068.0
Population outlook (Broward County) Hauer SSP2
- Today (2025)
- 2,207,033 people
- By 2030
- 2,360,704 · +7.0%
- By 2040
- 2,661,208 · +20.6%
- By 2050
- 2,946,698 · +33.5%
- By 2075
- 3,602,273 · +63.2%
- By 2100
- 3,970,984 · +79.9%
Race, ethnicity, and origin ACS 2023
- Neighborhood character
- Predominantly Black (77%)
- Race & ethnicity
- Black 77% Two or more races 9% White 9% Hispanic / Latino 9%
- Hispanic origin (detail)
- Mexican 1% Puerto Rican 2% Cuban 1%
- Common ancestry
- Hispanic 15% Lithuanian 1% Romanian 0%
- Foreign-born
- 24% · Canada, Jamaica
- Languages at home
- 78% English-only · French/Haitian/Cajun 14% Spanish 6% Other Indo-European 1%
Political lean MEDSL · Broward
- 2024 margin
- D (+17.0) · D 58.0% · R 41.0%
- 2008→2024 swing
- -17.8pp toward R · 2008: 34.7pp · 2024: 17.0pp
- All cycles
- 2024: D+17.0 2020: D+29.8 2016: D+35.0 2012: D+34.9 2008: D+34.7
Not yet ingested
- Civics
- —
Market trends
- HPI YoY
- ▼ -300.68%
- Current HPI
- 535.2504
- Rent YoY
- ▲ 2.78%
- Metro
- Miami-Fort Lauderdale-Pompano Beach, FL
- State GDP YoY
- ▲ 3.28%
- F500 in state
- 36
Industry mix (Fortune 500 HQ in FL)
| Industry | F500 HQs | Revenue |
|---|---|---|
| Industrial Technology | 2 | $29B |
|
||
| Insurance | 2 | $17B |
|
||
| Retail | 1 | $60B |
|
||
| Technology Distribution | 1 | $58B |
|
||
| Homebuilding | 1 | $35B |
|
||
| Technology Manufacturing | 1 | $35B |
|
||
Price history
-96.0% since first listed27 events — show timeline
- 2026-04-16 Listed for Rent $1,400 MARMLS
- 2026-04-15 Price Changed $81,000 MARMLS
- 2026-02-05 Price Changed $85,000 MARMLS
- 2026-01-10 Listed $89,900 MARMLS
- 2025-09-21 Rental Removed $1,300 MARMLS
- 2025-09-20 Listing Removed — MARMLS
- 2025-06-30 Listed for Rent $1,300 MARMLS
- 2025-06-08 Rental Removed $1,300 MARMLS
- 2025-04-16 Listed for Rent $1,300 MARMLS
- 2025-04-04 Price Changed $90,000 MARMLS
- 2025-03-14 Listed $99,500 MARMLS
- 2025-02-08 Rental Removed $1,300 RMLSFL
- 2025-02-08 Listing Removed — Beaches MLS
- 2025-01-15 Price Changed $85,000 Beaches MLS
- 2024-12-05 Listed for Rent $1,300 RMLSFL
- 2024-12-05 Rental Removed $1,300 GFLMLS
- 2024-12-05 Listed for Rent $1,300 GFLMLS
- 2024-12-04 Price Changed $86,000 Beaches MLS
- 2024-12-02 Price Changed $89,000 Beaches MLS
- 2024-11-30 Price Changed $95,000 Beaches MLS
- 2024-11-18 Price Changed $90,000 Beaches MLS
- 2024-10-07 Price Changed $110,000 Beaches MLS
- 2024-06-14 Price Changed $120,000 Beaches MLS
- 2024-06-04 Listed $125,000 Beaches MLS
- 1997-07-03 Sold (Public Records) $13,500 Public Records
- 1993-09-23 Sold (Public Records) $18,000 Public Records
- 1980-02-01 Sold (Public Records) $35,000 Public Records
Property tax history
-4.7%/yrLatest (2025): $334 · +0.0% YoY. Source: county tax records.
Cash-flow waterfall
monthlySold comps — $/sqft
last 12 mo · ≤1 miLoading sold comps…