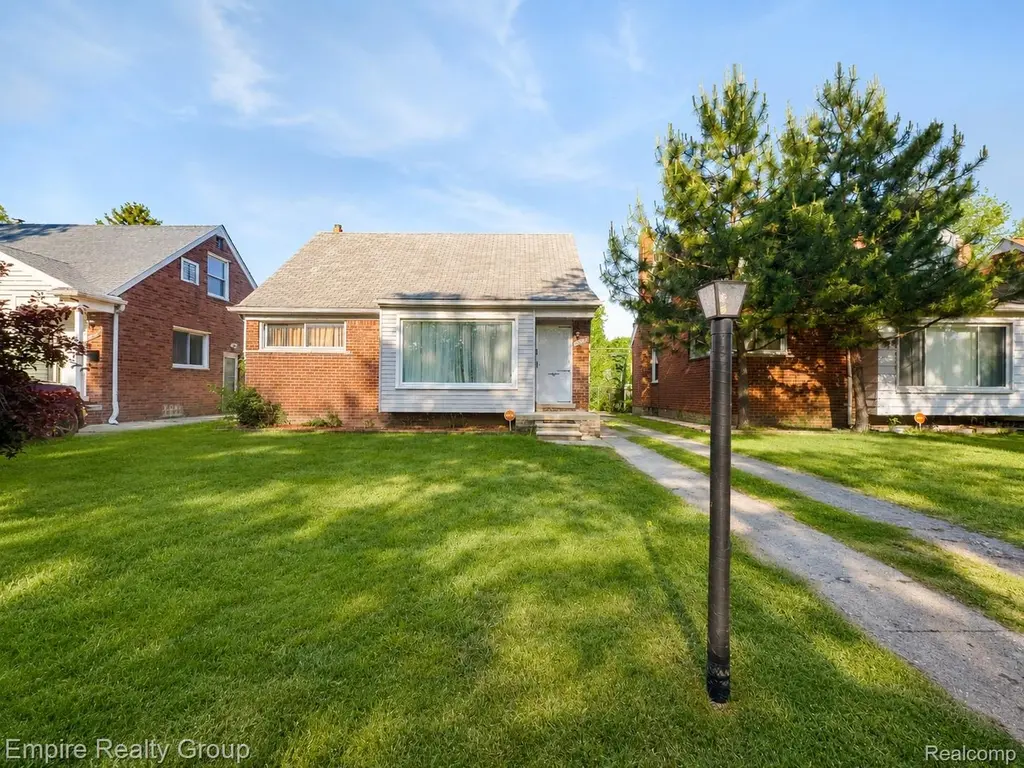
12852 Wormer · Redford, MI
Flood risk 1/10 · Minimal
- FEMA flood zone
- X (unshaded)
- Chance of flooding over 30 yrs
- 0.0%
- Est. flood insurance / yr
- $473 – $860
Fire risk 1/10 · Minimal
- Est. fire insurance / yr
- $784 – $1,456
Heat risk 3/10 · Minor
- Hot days now (above 98°F)
- 7 days/yr
- Hot days in 30 yrs
- 15 days/yr
Wind risk 2/10 · Minimal
- Chance of severe wind over 30 yrs
- —
Air-quality risk 3/10 · Minor
- Unhealthy air days now
- 2 days/yr
- Unhealthy air days in 30 yrs
- 3 days/yr
Risk factors via First Street. Map © Google.
Why this score? — see what drove the F grade
The composite is a weighted blend of 9 inputs, each scored 0–100. Each bar is that input's sub-score; the figure is the points it added to the 100-point composite (weight × sub-score).
- Cash flow +5.1/30.0
- Rent growth +3.3/5.0
- Livability +2.5/5.0
- Condition / age +2.5/5.0
- Schools +1.8/10.0
- 1% rule +1.7/10.0
- DSCR +0.0/10.0
- ARV discount +0.0/15.0
- Appreciation +0.0/10.0
$179,900
🖨 Deal sheet 📄 Offer letter ✓ Due diligence
Listing remarks MLS
Welcome home to this beautifully maintained 3-bedroom brick bungalow in the heart of Redford! Boasting nearly 1,300 square feet of comfortable above-grade living space, this home features a spacious living room and formal dining room with cozy carpeting, perfect for entertaining. The kitchen is highlighted by durable ceramic tile flooring and functional design. Two entry-level bedrooms share a full bath, while the expansive primary bedroom upstairs offers a private retreat. Head downstairs to find a fantastic, fully finished basement adding additional square feet of living space - ideal for a family room, home office, or rec space, complete with a convenient half-bath/lavatory and dedicated laundry area. Outside, enjoy a deep 133-foot lot and a detached 2-car garage providing plenty of storage. Perfectly situated just north of Schoolcraft and east of Beech Daly, you're just minutes from parks, shopping, and easy highway access. Schedule your showing today!
Key facts
- Brick bungalow
- Deep lot
- Detached garage
Tags
Property features AI
Exterior
- Parking: Detached 2-car garage
- Utilities: Public water; Public sewer
- Home design: Single-family residence; Two levels; Ground-level entry
- Construction: Brick construction; Block foundation; Asphalt roof; Built as single-family residence
- Exterior features: Paved road access; Lot approximately 0.12 acres (40 x 133)
Interior
- Bathrooms: 1 full bathroom; 1 half bathroom
- Heating & cooling: Forced air heating (natural gas); No central air cooling
- Interior features: Finished basement; Total of 8 rooms
Neighborhood map
What this means for you Summary
Snapshot
- This is a 3-bed/1.0-bath single-family listed at $180k.
Deal economics
- At list price, monthly cash flow is $-419 ($-5k/yr) — negative.
- To cash-flow at today's rent, offer at most $106k (41.2% below list).
- To meet the 1% rule (rent ≥ 1% of price), the offer needs to be $121k (32.8% below list).
- Recommended offer: $106k (41.2% below list) — sets the bar for cash-flow.
Location & tenants
- Location reads: area grade F — affects rentability + tenant quality, not the cash-flow math above.
- South Redford School District (suburban): math 11% / reading 29% proficiency, ranked #455 of 540 in MI (top 84%) — low school quality limits family demand, transient renter base, plan for 1-2y turnover.
- Market conditions: Rents rising (+3.2%/yr); 188 active listings in the ZIP; 40 comparable units currently listed for rent nearby; rentals lingering (median 44d on market — plan ~5-8 weeks vacancy on turnover, expect pricing pressure); 88% of comp listings sitting > 30 days — soft ceiling on asking rent; 2,639 units permitted in Wayne County in 2024 (1,216 in 5+ unit buildings).
Forward outlook
- Local home prices are declining (-3.0%/yr); year-one equity from $1k of loan paydown is wiped out by about $5k of value loss. Plan a longer hold.
- Wayne County population projected at -17% by 2050 — secular population decline; favor cash flow + early exit over multi-decade hold.
Negotiation context
- Only 8 days on market — expect competitive offers; lowballing is unlikely to land.
- 18 sale attempts since 6y ago with the ask held roughly flat each time — persistent listings suggest the price (not the market) is what's stuck; bring a comps-based counter.
- Current owner paid $125k; 44% above their basis — modest negotiation headroom, anchor on the comps not their cost.
Risks & watch-outs
- Watch-outs: built in 1952 — expect roof / HVAC / electrical / plumbing capex.
Questions for the listing agent
- What do current leases actually rent for vs. the listed asking? Can we see a recent rent roll and the last 12 months of T-12 income?
- Built in 1952 — when were the roof, HVAC, electrical panel, plumbing, and water heater last replaced?
- Is there a deadline driving the sale (1031 exchange, divorce, estate, relocation)? That informs how much negotiation room exists.
- The area grade is low — what's the realistic commute time and amenity access for the typical tenant pool here? Any planned neighborhood developments (good or bad) we should know about?
- What's the average days-on-market for RENTAL listings here right now (not sales)? A rising rental-DOM trend means longer vacancies and softer asking-rent achievability than the comps imply.
- What's the recent tenant-quality profile in this submarket — average credit score on applications, eviction rate, late-payment / NSF rate, and stable-employment percentage? A property-management company in the area should have these aggregated.
- How much new for-sale + rental construction is in the pipeline within 1–3 miles? Heavy new supply typically softens prices + rents 12–24 months out; constrained supply supports both.
Investment metrics
- 1% rule
- 0.67% ✗
- Cap rate
- 3.50%
- Cash-on-cash
- -9.99%
- DSCR
- 0.56
- GRM
- 12.4
CMA / ARV
- ARV (on-the-fly)
- $130,356
- Comps found
- 12
Show comp detail 12 sales within ~0.75 mi
| Address | Dist | Beds/Ba | Sqft | Sold | Price | $/sf | Match |
|---|---|---|---|---|---|---|---|
| 12956 Wormer | 0.10mi | 2/1.0 (-1) | 1,200 (-6%) | 8mo | $99,999 | $83 | 74 |
| 13563 Lenore | 0.20mi | 2/1.0 (-1) | 1,209 (-5%) | 8mo | $113 | — | 70 |
| 12784 Dale St | 0.20mi | 3/2.0 | 1,277 (-0%) | 20mo | $130,000 | $102 | 69 |
| 11770 Riverdale | 0.70mi | 3/2.0 | 1,228 (-4%) | 0mo | $190,000 | $155 | 56 |
| 13973 Dixie | 0.46mi | 3/1.5 | 1,384 (+8%) | 8mo | $235,000 | $170 | 56 |
| 12891 Riverdale Ave | 0.41mi | 4/1.5 (+1) | 1,349 (+6%) | 12mo | $133,000 | $99 | 54 |
| 12922 Grayfield St | 0.50mi | 3/1.0 | 1,399 (+10%) | 8mo | $95,000 | $68 | 54 |
| 13974 Brady | 0.56mi | 3/1.5 | 1,199 (-6%) | 14mo | $242,000 | $202 | 50 |
| 12930 Riverdale Ave | 0.44mi | 3/1.0 | 1,382 (+8%) | 20mo | $105,000 | $76 | 49 |
| 12878 Bramell St | 0.73mi | 3/1.5 | 1,184 (-7%) | 4mo | $155,000 | $131 | 48 |
| 12705 Beaverland St | 0.66mi | 3/1.5 | 1,092 (-15%) | 0mo | $63,000 | $58 | 43 |
| 13973 Sarasota | 0.54mi | 3/2.0 | 1,411 (+10%) | 20mo | $210,500 | $149 | 37 |
Match score weights: distance 35% · size 25% · config 20% · recency 20%. Top-matched comps best support the ARV.
Projected returns pro-forma
-3.0% appreciation · 3.25% rent growth · sell at horizon
- IRR
- -33.8%
- Equity multiple
- -0.10×
- Total profit
- $-55,456
- Equity at exit
- $26,824
- IRR
- -40.1%
- Equity multiple
- -0.61×
- Total profit
- $-81,021
- Equity at exit
- $15,554
Cash invested: $50,372 (down + closing). Projections, not guarantees.
Landlord ↔ Tenant lean methodology
- Overall (STATE)
- 62 Landlord-Friendly
- State Michigan
- 62 Landlord-Friendly · EVEN
- County
- — inherits STATE
- City
- — inherits STATE
ZIP-level market 48239
- Rents YoY
- 3.2%
- Active inventory
- 188
- Price-to-rent
- 12.4×
Monthly cashflow live
- Estimated rent
- $1,209 high interval (Pro) →
- Mortgage (P&I)
- −$943
- Tax from tax record
- −$356 /mo · $4,272/yr
- Insurance
- −$75
- HOA
- −$0
- Vacancy / Maint / Mgmt
- −$254
- Net cashflow
- $-419
Break-even live
UW: 25.0% down · 7.5% · 30yr · 1.5% tax · 5.0% vac · 8.0% maint · 8.0% mgmt
Financing live
Cash to close
- Down payment
- $44,975
- Closing costs
- $5,397
- Reserves months
- —
- Total cash needed
- —
Loan-product check · same deal, 3 products live
Conventional
25% down · 7.5% · 30yr
- Down + closing
- —
- Monthly P&I
- —
- Monthly cashflow
- —
- DSCR
- —
- Eligible?
- —
Personal DTI + credit; lowest rate.
DSCR
20% down · 8.5% · 30yr
- Down + closing
- —
- Monthly P&I
- —
- Monthly cashflow
- —
- DSCR
- —
- Eligible?
- —
No personal income docs; deal must DSCR.
Hard money
10% down · 12.0% · 12mo
- Down + closing
- —
- Monthly P&I
- —
- Monthly cashflow
- —
- DSCR
- —
- Eligible?
- —
Short-term bridge; refi at stabilization.
Rent comps 40 comps
| Address | Beds | Baths | Sqft | Rent | $/sqft | DOM | Units | Dist |
|---|---|---|---|---|---|---|---|---|
| 23846 Schoolcraft Rd Detroit, MI | 2.0 | 1.0 | 900 | $1,050 | $1.17 | 43d | 1 | 0.33mi |
| 23832 Schoolcraft Rd Detroit, MI | 2.0 | 1.0 | 900 | $1,050 | $1.17 | 43d | 1 | 0.34mi |
| 23826 Schoolcraft Rd Detroit, MI | 2.0 | 1.0 | 900 | $1,050 | $1.17 | 43d | 1 | 0.35mi |
| 23822 Schoolcraft Rd Detroit, MI | 2.0 | 1.0 | 900 | $1,050 | $1.17 | 43d | 1 | 0.35mi |
| 23836 Schoolcraft Rd Detroit, MI | 2.0 | 1.0 | 900 | $1,050 | $1.17 | 43d | 1 | 0.36mi |
| 14005 Riverview St Detroit, MI | 2.0 | 1.0 | 900 | $1,050 | $1.17 | 43d | 1 | 0.36mi |
| 23814 Schoolcraft Rd Detroit, MI | 2.0 | 1.0 | 900 | $1,050 | $1.17 | 43d | 1 | 0.36mi |
| 14025 Riverview St Detroit, MI | 2.0 | 1.0 | 900 | $1,050 | $1.17 | 43d | 1 | 0.38mi |
| 14093 Dale St Detroit, MI | 2.0 | 1.0 | 900 | $985 | $1.09 | 43d | 1 | 0.38mi |
| 14095 Dale St Detroit, MI | 2.0 | 1.0 | 900 | $900 | $1.00 | 43d | 1 | 0.38mi |
| 14081 Dale St Detroit, MI | 2.0 | 1.0 | 900 | $985 | $1.09 | 43d | 1 | 0.38mi |
| 14085 Dale St Detroit, MI | 2.0 | 1.0 | 900 | $900 | $1.00 | 43d | 1 | 0.38mi |
| 14077 Dale St Detroit, MI | 2.0 | 1.0 | 900 | $985 | $1.09 | 43d | 1 | 0.38mi |
| 14089 Dale St Detroit, MI | 2.0 | 1.0 | 900 | $985 | $1.09 | 43d | 1 | 0.38mi |
| 14079 Dale St Detroit, MI | 2.0 | 1.0 | 900 | $985 | $1.09 | 43d | 1 | 0.38mi |
| 14075 Dale St Detroit, MI | 2.0 | 1.0 | 900 | $985 | $1.09 | 43d | 1 | 0.38mi |
| 14000 Riverview St Detroit, MI | 2.0 | 1.0 | 900 | $1,050 | $1.17 | 43d | 1 | 0.38mi |
| 23644 Schoolcraft Rd Detroit, MI | 2.0 | 1.0 | 900 | $1,050 | $1.17 | 43d | 1 | 0.39mi |
| 14065 Dale St Detroit, MI | 2.0 | 1.0 | 900 | $985 | $1.09 | 43d | 1 | 0.39mi |
| 14067 Dale St Detroit, MI | 2.0 | 1.0 | 900 | $985 | $1.09 | 43d | 1 | 0.39mi |
| 14041 Riverview St Detroit, MI | 2.0 | 1.0 | 900 | $1,000 | $1.11 | 24d | 1 | 0.39mi |
| 14010 Riverview St Detroit, MI | 2.0 | 1.0 | 900 | $1,050 | $1.17 | 43d | 1 | 0.39mi |
| 23652 Schoolcraft Rd Detroit, MI | 2.0 | 1.0 | 900 | $1,050 | $1.17 | 24d | 1 | 0.39mi |
| 14020 Riverview St Detroit, MI | 2.0 | 1.0 | 900 | $1,050 | $1.17 | 43d | 1 | 0.39mi |
| 23656 Schoolcraft Rd Detroit, MI | 2.0 | 1.0 | 900 | $1,050 | $1.17 | 43d | 1 | 0.39mi |
| 14043 Riverview St Detroit, MI | 2.0 | 1.0 | 900 | $985 | $1.09 | 43d | 1 | 0.39mi |
| 14045 Riverview St Detroit, MI | 2.0 | 1.0 | 900 | $1,000 | $1.11 | 24d | 1 | 0.40mi |
| 14030 Riverview St Detroit, MI | 2.0 | 1.0 | 900 | $1,050 | $1.17 | 43d | 1 | 0.40mi |
| 14047 Riverview St Detroit, MI | 2.0 | 1.0 | 900 | $985 | $1.09 | 43d | 1 | 0.40mi |
| 14063 Dale St Detroit, MI | 2.0 | 1.0 | 900 | $1,000 | $1.11 | 24d | 1 | 0.40mi |
| 14091 Dale St Detroit, MI | 2.0 | 1.0 | 900 | $985 | $1.09 | 43d | 1 | 0.40mi |
| 14078 Riverview St Detroit, MI | 2.0 | 1.0 | 900 | $1,050 | $1.17 | 43d | 1 | 0.41mi |
| 14105 Dale St Detroit, MI | 2.0 | 1.0 | 900 | $900 | $1.00 | 43d | 1 | 0.41mi |
| 14038 Riverview St Detroit, MI | 2.0 | 1.0 | 900 | $1,050 | $1.17 | 43d | 1 | 0.41mi |
| 14070 Riverview St Detroit, MI | 2.0 | 1.0 | 900 | $985 | $1.09 | 43d | 1 | 0.41mi |
| 14107 Dale St Detroit, MI | 2.0 | 1.0 | 900 | $1,000 | $1.11 | 24d | 1 | 0.41mi |
| 14066 Riverview St Detroit, MI | 2.0 | 1.0 | 900 | $1,050 | $1.17 | 43d | 1 | 0.41mi |
| 14111 Dale St Detroit, MI | 2.0 | 1.0 | 900 | $985 | $1.09 | 43d | 1 | 0.41mi |
| 14101 Dale St Detroit, MI | 2.0 | 1.0 | 900 | $985 | $1.09 | 43d | 1 | 0.41mi |
| 14115 Dale St Detroit, MI | 2.0 | 1.0 | 900 | $985 | $1.09 | 43d | 1 | 0.42mi |
Listing history 6 events
-
2026-06-18days on market $179,900 Active 8 DOM
-
2026-06-17days on market $179,900 Active 7 DOM
-
2026-06-16days on market $179,900 Active 6 DOM
-
2026-06-15days on market $179,900 Active 5 DOM
-
2026-06-13remarks 693-char remark
-
2026-06-13$179,900 Active 3 DOM
ⓘ Source: listings_history table (triggers on properties + properties_extension) + one-shot
backfill from property_details.listing_events for pre-trigger history.
Tax reassessment forecast MI · Partial reset (capped growth)
- Current annual tax
- $4,272 · $356/mo
- Projected year-2 tax
- $4,272 · $356/mo
- Expected delta
- $0/yr ($0/mo · 0.0%)
ⓘ Screening estimate from a state-policy table — verify with the county assessor before closing.
Climate risk First Street
- Flood 1/10 Low FEMA zone X (unshaded) · 0% chance over 30 yrs
- Wildfire 1/10 Low
- Heat 3/10 Moderate 7 d/yr ≥98°F today · 15 d/yr by 30 yrs out
- Wind 2/10 Low
- Air quality 3/10 Moderate 2 unhealthy d/yr today · 3 by 30 yrs out
Nearby sold comps map
Loading sold comps map…
Walkable amenities ~0.75 mi
Loading nearby amenities…
Taxation est. · year 1
- Rental income
- $14,507
- − Mortgage interest
- −$10,077
- − Property taxes
- −$4,272
- − Insurance
- −$900
- − Repairs & maintenance
- −$1,161
- − Management
- −$1,161
- − Depreciation
- −$5,233
- Taxable loss
- −$8,296
- Est. tax savings @ 24.0%
- +$1,991
- After-tax cash flow
- $-3,041/yr
For passive investors: Depreciation is non-cash, so a rental often shows a tax loss while cash-flowing — sheltering income. Rental losses are passive: they offset passive income freely, and up to $25,000/yr can offset ordinary (W-2) income if you actively participate and your MAGI is under $100k (phasing out to $0 by $150k); unused losses carry forward. On sale, claimed depreciation is recaptured at up to 25%, and gains may owe capital-gains tax (a 1031 exchange can defer both). Figures are a year-1 estimate at your 24.0% rate — not tax advice; consult a CPA.
Schools (NCES district)
- District
- South Redford School District
- NCES district ID
- 2632280
- Math proficiency
- 11% ▼ -9.00%
- Reading proficiency
- 29% ▼ -7.00%
- Median HH income
- $52,775
- Composite
- 18.1/100
- National rank
- #8972
- State rank
- #455 of 540 in MI
Livability — Redford
No livability data for this city. (Only ~50 U.S. cities are tracked.)
Census & demographics
- County
- Wayne County · 1,562,939 people
- City population
- 36,976
- Metro
- Detroit-Warren-Dearborn, MI
- Population (ZIP)
- 36,976
- Household income
- $71,151
- Rent vs Own
- Severe rent burden
- 1052.0
Population outlook (Wayne County) Hauer SSP2
- Today (2025)
- 1,675,273 people
- By 2030
- 1,620,300 · -3.3%
- By 2040
- 1,502,341 · -10.3%
- By 2050
- 1,384,039 · -17.4%
- By 2075
- 1,124,592 · -32.9%
- By 2100
- 881,193 · -47.4%
Race, ethnicity, and origin ACS 2023
- Neighborhood character
- Majority Black (58%)
- Race & ethnicity
- Black 58% White 34% Hispanic / Latino 4% Two or more races 4%
- Common ancestry
- Romanian 7% Slovak 2% Lithuanian 2%
- Foreign-born
- 2% · Canada
- Languages at home
- 96% English-only · Spanish 1% Other Indo-European 1% Arabic 1%
Political lean MEDSL · Wayne
- 2024 margin
- Strong D (+29.0) · D 62.7% · R 33.7% · Other 3.6%
- 2008→2024 swing
- -20.5pp toward R · 2008: 49.5pp · 2024: 29.0pp
- All cycles
- 2024: D+29.0 2020: D+38.1 2016: D+37.3 2012: D+46.9 2008: D+49.5
Not yet ingested
- Civics
- —
Market trends
- HPI YoY
- ▼ -202.97%
- Current HPI
- 236.1136
- Rent YoY
- ▲ 3.25%
- Metro
- Detroit-Warren-Dearborn, MI
- State GDP YoY
- ▲ 1.37%
- F500 in state
- 28
Industry mix (Fortune 500 HQ in MI)
| Industry | F500 HQs | Revenue |
|---|---|---|
| Automotive Parts | 3 | $48B |
|
||
| Automotive | 2 | $372B |
|
||
| Chemicals | 1 | $45B |
|
||
| Automotive Retail | 1 | $29B |
|
||
| Healthcare / Medical Devices | 1 | $23B |
|
||
| Automotive Technology | 1 | $20B |
|
||
Price history
+56.4% since first listed62 events — show timeline
- 2026-06-10 Listed $179,900 REALCOMP
- 2026-06-10 Listed $179,900 MiRealSource-MiMLS
- 2022-09-20 Listing Removed — REALCOMP
- 2022-08-27 Pending — MiRealSource-MiMLS
- 2022-08-27 Pending — REALCOMP
- 2022-08-27 Listing Removed — MiRealSource-MiMLS
- 2022-08-16 Contingent — MiRealSource-MiMLS
- 2022-08-16 Contingent — REALCOMP
- 2022-08-16 Price Changed $165,000 MiRealSource-MiMLS
- 2022-08-16 Price Changed $165,000 REALCOMP
- 2022-08-05 Relisted — REALCOMP
- 2022-08-03 Listing Removed — REALCOMP
- 2022-07-31 Price Changed $168,900 MiRealSource-MiMLS
- 2022-07-30 Price Changed $168,900 REALCOMP
- 2022-07-14 Price Changed $173,000 MiRealSource-MiMLS
- 2022-07-13 Price Changed $173,000 REALCOMP
- 2022-07-04 Price Changed $175,000 MiRealSource-MiMLS
- 2022-07-03 Price Changed $175,000 REALCOMP
- 2022-06-20 Price Changed $179,999 MiRealSource-MiMLS
- 2022-06-19 Price Changed $179,999 REALCOMP
- 2022-06-19 Relisted — MiRealSource-MiMLS
- 2022-06-19 Relisted — REALCOMP
- 2022-06-10 Pending — REALCOMP
- 2022-06-10 Pending — MiRealSource-MiMLS
- 2022-05-26 Price Changed $175,000 MiRealSource-MiMLS
- 2022-05-26 Price Changed $175,000 REALCOMP
- 2022-05-18 Listed $180,000 MiRealSource-MiMLS
- 2022-05-18 Listed $180,000 REALCOMP
- 2022-05-15 Coming Soon — MiRealSource-MiMLS
- 2022-05-15 Coming Soon — REALCOMP
- 2020-10-22 Sold (Public Records) $125,000 Public Records
- 2020-09-23 Sold (MLS) $125,000 SW Michigan MLS
- 2020-09-23 Sold (MLS) $125,000 MiRealSource-MiMLS
- 2020-09-23 Sold (MLS) $125,000 MiRealSource-MiMLS
- 2020-09-23 Sold (MLS) $125,000 REALCOMP
- 2020-09-23 Sold (MLS) $125,000 AAMLS
- 2020-09-21 Pending — MiRealSource-MiMLS
- 2020-09-21 Pending — AAMLS
- 2020-09-17 Contingent — MiRealSource-MiMLS
- 2020-09-17 Contingent — AAMLS
- 2020-09-15 Relisted — MiRealSource-MiMLS
- 2020-09-14 Relisted — AAMLS
- 2020-09-14 Pending — MiRealSource-MiMLS
- 2020-09-14 Price Changed $125,000 AAMLS
- 2020-09-14 Pending — AAMLS
- 2020-09-14 Relisted — AAMLS
- 2020-05-05 Pending — MiRealSource-MiMLS
- 2020-05-05 Pending — AAMLS
- 2020-05-04 Listing Removed — MiRealSource-MiMLS
- 2020-05-04 Price Changed $125,000 MiRealSource-MiMLS
- 2020-04-21 Relisted — MiRealSource-MiMLS
- 2020-04-21 Relisted — AAMLS
- 2020-03-30 Contingent — MiRealSource-MiMLS
- 2020-03-28 Contingent — AAMLS
- 2020-03-27 Relisted — MiRealSource-MiMLS
- 2020-03-27 Relisted — AAMLS
- 2020-03-21 Contingent — MiRealSource-MiMLS
- 2020-03-21 Contingent — AAMLS
- 2020-03-17 Listed $125,000 SW Michigan MLS
- 2020-03-17 Listed $125,000 MiRealSource-MiMLS
- 2020-03-17 Listed $125,000 REALCOMP
- 2020-03-17 Listed $115,000 AAMLS
Property tax history
+9.1%/yrLatest (2025): $4,272 · -5.9% YoY. Source: county tax records.
Cash-flow waterfall
monthlySold comps — $/sqft
last 12 mo · ≤1 miLoading sold comps…