52 Walnut Dr · Newberry, PA
Flood risk 1/10 · Minimal
- FEMA flood zone
- X (unshaded)
- Chance of flooding over 30 yrs
- 0.0%
- Est. flood insurance / yr
- $507 – $1,088
Fire risk 3/10 · Minor
- Est. fire insurance / yr
- $511 – $949
Heat risk 5/10 · Moderate
- Hot days now (above 101°F)
- 7 days/yr
- Hot days in 30 yrs
- 15 days/yr
Wind risk 3/10 · Minor
- Chance of severe wind over 30 yrs
- 7.0%
Air-quality risk 3/10 · Minor
- Unhealthy air days now
- 2 days/yr
- Unhealthy air days in 30 yrs
- 4 days/yr
Risk factors via First Street. Map © Google.
Why this score? — see what drove the B- grade
The composite is a weighted blend of 9 inputs, each scored 0–100. Each bar is that input's sub-score; the figure is the points it added to the 100-point composite (weight × sub-score).
- Cash flow +30.0/30.0
- 1% rule +10.0/10.0
- DSCR +10.0/10.0
- ARV discount +7.5/15.0
- Schools +4.1/10.0
- Rent growth +2.5/5.0
- Livability +2.5/5.0
- Condition / age +1.0/5.0
- Appreciation +0.0/10.0
$89,900
🖨 Deal sheet 📄 Offer letter ✓ Due diligence
Listing remarks
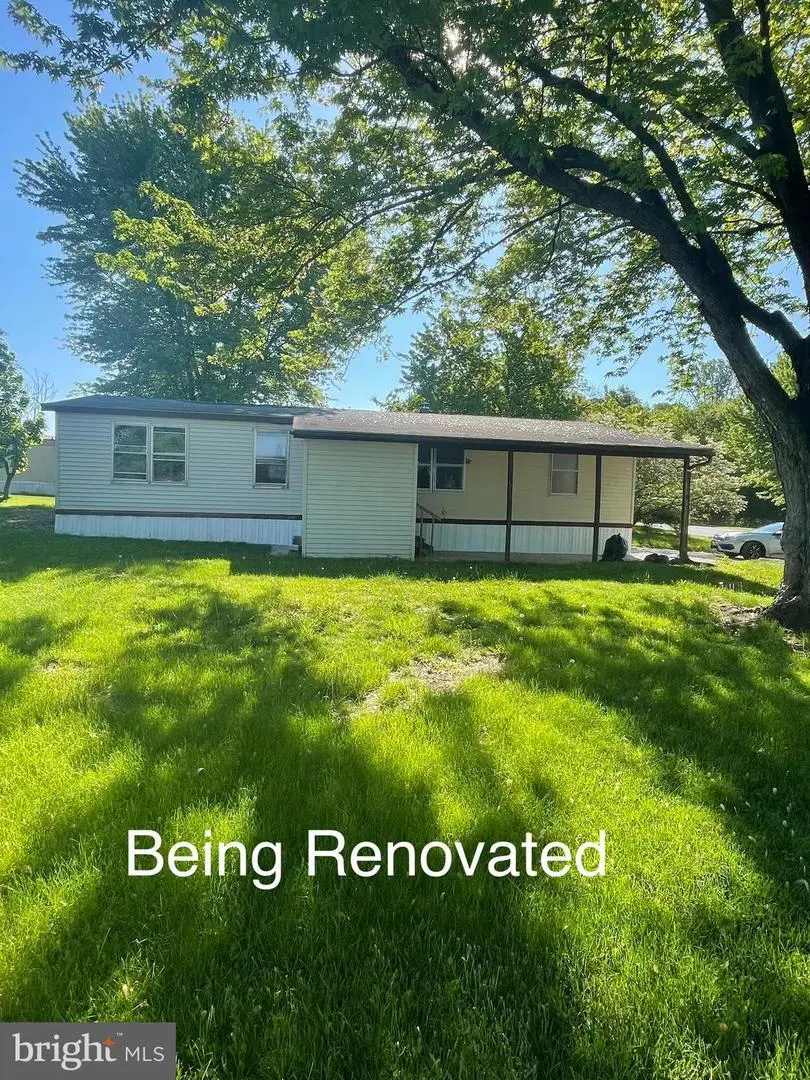
Welcome to Newberry Estates! This 3/2 doublewide home is currently being renovated. If you have been looking for an affordable option that will be like new when it is complete, come check out this home! Renovations just started, so here's an opportunity to see what repairs are actually being done before the cosmetic work is done. Expect to be ACTIVE as soon as subflooring is replaced and it it safe to walk through.
Key facts
- Built 1985
- Listed 45 days
Property features AI
Finance
- HOA & community: Monthly ground rent: $690
Exterior
- Parking: Driveway parking
- Utilities: Public sewer; Public and community water
- Home design: Manufactured home; Estimated year of major renovation: 2026; Above-grade living space
- Construction: Vinyl siding; Above grade structure
- Exterior features: Not in a federal flood zone; Ground rent arrangement with monthly payment
Interior
- Bedrooms: Three bedrooms on the main level
- Bathrooms: Two full bathrooms (both on the main level)
- Heating & cooling: Forced air heating (electric); Central air conditioning (electric); Electric hot water
- Interior features: Estimated living area; No basement
Neighborhood map
What this means for you Summary
Snapshot
- This is a 3-bed/2.0-bath single-family listed at $90k. Condition is rated poor.
Deal economics
- At list price, monthly cash flow is $496 ($6k/yr) — positive.
- The deal already cash-flows at list — no discount required.
- Meets the 1% rule at list price ($1k rent vs $90k).
- Recommended offer: $87k (3.0% below list) — sets the bar for market timing.
Location & tenants
- Location reads: area grade B — affects rentability + tenant quality, not the cash-flow math above.
- West Shore SD (suburban): math 37% / reading 56% proficiency, ranked #222 of 539 in PA (top 41%) — families likely to look elsewhere, expect single-tenant / working-renter base with shorter leases.
- Market conditions: 36 active listings in the ZIP; 1,328 units permitted in York County in 2024 (338 in 5+ unit buildings).
Forward outlook
- Local home prices are declining (-3.0%/yr); year-one equity from $622 of loan paydown is wiped out by about $3k of value loss. Plan a longer hold.
- At projected returns (-3.0% appreciation + 3.0% rent growth), your $25k cash investment doubles in ~6 years — after that, you're playing with house money.
Negotiation context
- It's been on market 45 days — a 3% lower offer ($87k) is reasonable based on typical stale-listing flexibility.
Risks & watch-outs
- Climate carrying-cost: extreme-heat days projected 7→15/yr by 2055 (HVAC capex compounding) — expect insurance premiums to compound above CPI over the hold.
Questions for the listing agent
- It's been on market 45 days. Have you received any prior offers? Is the seller open to a 3% concession, seller financing, or rate buy-down credit?
- Have any recent inspections been done? Can we get a copy of the seller's disclosures and any deferred-maintenance estimates?
- Is there a deadline driving the sale (1031 exchange, divorce, estate, relocation)? That informs how much negotiation room exists.
- What's the average days-on-market for RENTAL listings here right now (not sales)? A rising rental-DOM trend means longer vacancies and softer asking-rent achievability than the comps imply.
- What's the recent tenant-quality profile in this submarket — average credit score on applications, eviction rate, late-payment / NSF rate, and stable-employment percentage? A property-management company in the area should have these aggregated.
- How much new for-sale + rental construction is in the pipeline within 1–3 miles? Heavy new supply typically softens prices + rents 12–24 months out; constrained supply supports both.
Investment metrics
- 1% rule
- 1.57% ✓
- Cap rate
- 12.92%
- Cash-on-cash
- 23.66%
- DSCR
- 2.05
- GRM
- 5.3
CMA / ARV
- ARV (median comp)
- $225,423
- List price
- $89,900
- Delta
- -60.12%
- Verdict
- UNDERPRICED
- Comps
- 17 within 1.0 mi
Show comp detail 3 sales within ~0.75 mi
| Address | Dist | Beds/Ba | Sqft | Sold | Price | $/sf | Match |
|---|---|---|---|---|---|---|---|
| 32 Walnut Dr | 0.08mi | 3/2.0 | 1,134 (+7%) | 4mo | $85,000 | $75 | 80 |
| 75 Wilson Rd | 0.05mi | 3/2.0 | 1,152 (+9%) | 3mo | $60,000 | $52 | 80 |
| 190 Northcrest Dr | 0.63mi | 3/2.0 | 1,056 (0%) | 11mo | $275,000 | $260 | 62 |
Match score weights: distance 35% · size 25% · config 20% · recency 20%. Top-matched comps best support the ARV.
Projected returns pro-forma
-3.0% appreciation · 3.0% rent growth · sell at horizon
- IRR
- 16.8%
- Equity multiple
- 1.68×
- Total profit
- $17,060
- Equity at exit
- $13,404
- IRR
- 25.4%
- Equity multiple
- 3.21×
- Total profit
- $55,640
- Equity at exit
- $7,773
Cash invested: $25,172 (down + closing). Projections, not guarantees.
Landlord ↔ Tenant lean methodology
- Overall (STATE)
- 62 Landlord-Friendly
- State Pennsylvania
- 62 Landlord-Friendly · EVEN
- County
- — inherits STATE
- City
- — inherits STATE
ZIP-level market 17370
- Home prices YoY
- -31.1%
- Active inventory
- 36
- Price-to-rent
- 5.3×
Monthly cashflow live
- Estimated rent
- $1,415 medium interval (Pro) →
- Mortgage (P&I)
- −$471
- Tax est. 1.5%
- −$112 /mo · $1,348/yr
- Insurance
- −$37
- HOA
- −$0
- Vacancy / Maint / Mgmt
- −$297
- Net cashflow
- $496
Break-even live
UW: 25.0% down · 7.5% · 30yr · 1.5% tax · 5.0% vac · 8.0% maint · 8.0% mgmt
Financing live
Cash to close
- Down payment
- $22,475
- Closing costs
- $2,697
- Reserves months
- —
- Total cash needed
- —
Loan-product check · same deal, 3 products live
Conventional
25% down · 7.5% · 30yr
- Down + closing
- —
- Monthly P&I
- —
- Monthly cashflow
- —
- DSCR
- —
- Eligible?
- —
Personal DTI + credit; lowest rate.
DSCR
20% down · 8.5% · 30yr
- Down + closing
- —
- Monthly P&I
- —
- Monthly cashflow
- —
- DSCR
- —
- Eligible?
- —
No personal income docs; deal must DSCR.
Hard money
10% down · 12.0% · 12mo
- Down + closing
- —
- Monthly P&I
- —
- Monthly cashflow
- —
- DSCR
- —
- Eligible?
- —
Short-term bridge; refi at stabilization.
Listing history 16 events
-
2026-06-18days on market $89,900 Coming Soon 45 DOM
-
2026-06-17days on market $89,900 Coming Soon 44 DOM
-
2026-06-16days on market $89,900 Coming Soon 43 DOM
-
2026-06-15days on market $89,900 Coming Soon 42 DOM
-
2026-06-14days on market $89,900 Coming Soon 40 DOM
-
2026-06-10days on market $89,900 Coming Soon 37 DOM
-
2026-06-09days on market $89,900 Coming Soon 36 DOM
-
2026-06-08days on market $89,900 Coming Soon 35 DOM
-
2026-06-07days on market $89,900 Coming Soon 34 DOM
-
2026-06-05days on market $89,900 Coming Soon 31 DOM
-
2026-06-03days on market $89,900 Coming Soon 30 DOM
-
2026-06-02days on market $89,900 Coming Soon 29 DOM
-
2026-06-01days on market $89,900 Coming Soon 28 DOM
-
2026-05-31days on market $89,900 Coming Soon 27 DOM
-
2026-05-31days on market $89,900 Coming Soon 26 DOM
-
2026-05-04historical $89,900 420-char remark
ⓘ Source: listings_history table (triggers on properties + properties_extension) + one-shot
backfill from property_details.listing_events for pre-trigger history.
Climate risk First Street
- Flood 1/10 Low FEMA zone X (unshaded) · 0% chance over 30 yrs
- Wildfire 3/10 Moderate
- Heat 5/10 Major 7 d/yr ≥101°F today · 15 d/yr by 30 yrs out
- Wind 3/10 Moderate 7% chance of damaging wind over 30 yrs
- Air quality 3/10 Moderate 2 unhealthy d/yr today · 4 by 30 yrs out
Nearby sold comps map
Loading sold comps map…
Walkable amenities ~0.75 mi
Loading nearby amenities…
Taxation est. · year 1
- Rental income
- $16,975
- − Mortgage interest
- −$5,036
- − Property taxes
- −$1,348
- − Insurance
- −$450
- − Repairs & maintenance
- −$1,358
- − Management
- −$1,358
- − Depreciation
- −$2,615
- Taxable income
- $4,810
- Est. tax owed @ 24.0%
- −$1,154
- After-tax cash flow
- $4,801/yr
For passive investors: Depreciation is non-cash, so a rental often shows a tax loss while cash-flowing — sheltering income. Rental losses are passive: they offset passive income freely, and up to $25,000/yr can offset ordinary (W-2) income if you actively participate and your MAGI is under $100k (phasing out to $0 by $150k); unused losses carry forward. On sale, claimed depreciation is recaptured at up to 25%, and gains may owe capital-gains tax (a 1031 exchange can defer both). Figures are a year-1 estimate at your 24.0% rate — not tax advice; consult a CPA.
Condition & rehab AI · 1 photo
This single-family home requires extensive repairs and updates to bring it up to a livable condition. Immediate focus should be on the roof, exterior, flooring, interior walls, HVAC, and landscaping to significantly increase its resale and rental value.
Repairs flagged
- Major roof — No visible roof in the satellite image.
- Major exterior — No visible exterior in the satellite image.
- Major flooring — No visible flooring in the satellite image.
- Major interior walls/paint — No visible interior walls/paint in the satellite image.
- Major HVAC/mechanicals — No visible HVAC/mechanicals in the satellite image.
- Major landscaping/curb appeal — No visible landscaping/curb appeal in the satellite image.
Value-add opportunities
- Both roof replacement — A new roof would significantly improve the home's appearance and safety.
- Both exterior painting/staining — A fresh coat of paint/staining would enhance curb appeal and value.
- Both flooring replacement — New flooring would improve the home's condition and appeal.
- Both interior painting — Fresh paint would improve the home's condition and appeal.
- Both HVAC system upgrade — A new HVAC system would improve comfort and energy efficiency.
- Both landscaping and curb appeal — A well-maintained yard and landscaping would significantly enhance the home's curb appeal and value.
Renovation cost estimate screening
| Repair item | Severity | Est. cost |
|---|---|---|
| roof · No visible roof in the satellite image. | Major | $15,000–50,000 |
| exterior · No visible exterior in the satellite image. | Major | $15,000–50,000 |
| flooring · No visible flooring in the satellite image. | Major | $15,000–50,000 |
| interior walls/paint · No visible interior walls/paint in the satellite image. | Major | $15,000–50,000 |
| HVAC/mechanicals · No visible HVAC/mechanicals in the satellite image. | Major | $15,000–50,000 |
| landscaping/curb appeal · No visible landscaping/curb appeal in the satellite image. | Major | $15,000–50,000 |
| Total estimated repair cost · 6 items | $90,000–300,000 |
Value-add ROI direction
- Both roof replacement — A new roof would significantly improve the home's appearance and safety. ↑
- Both exterior painting/staining — A fresh coat of paint/staining would enhance curb appeal and value. ↑
- Both flooring replacement — New flooring would improve the home's condition and appeal. ↑
- Both interior painting — Fresh paint would improve the home's condition and appeal. ↑
- Both HVAC system upgrade — A new HVAC system would improve comfort and energy efficiency. ↑
- Both landscaping and curb appeal — A well-maintained yard and landscaping would significantly enhance the home's curb appeal and value. ↑
ⓘ Cost ranges are severity-bucket heuristics (US national rule-of-thumb). Get contractor quotes + a written scope before underwriting a rehab budget.
Schools (NCES district)
- District
- West Shore SD
- NCES district ID
- 4225830
- Math proficiency
- 37% ▼ -12.00%
- Reading proficiency
- 56% ▼ -10.00%
- Median HH income
- $61,398
- Composite
- 40.9/100
- National rank
- #3617
- State rank
- #222 of 539 in PA
Livability — Newberry
No livability data for this city. (Only ~50 U.S. cities are tracked.)
Census & demographics
- Population (ZIP)
- 6,970
Population outlook (York County) Hauer SSP2
- Today (2025)
- 454,205 people
- By 2030
- 457,407 · +0.7%
- By 2040
- 457,529 · +0.7%
- By 2050
- 448,261 · -1.3%
- By 2075
- 427,388 · -5.9%
- By 2100
- 384,218 · -15.4%
Race, ethnicity, and origin ACS 2023
- Neighborhood character
- Predominantly White (87%)
- Race & ethnicity
- White 87% Two or more races 6% Hispanic / Latino 5% Black 4%
- Hispanic origin (detail)
- Puerto Rican 3%
- Common ancestry
- Romanian 5% Polish 3% Lithuanian 1%
- Foreign-born
- 1% · Canada
- Languages at home
- 98% English-only · Spanish 2%
Political lean MEDSL · York
- 2024 margin
- Strong R (+25.3) · D 36.9% · R 62.1%
- 2008→2024 swing
- -11.7pp toward R · 2008: -13.6pp · 2024: -25.3pp
- All cycles
- 2024: R+25.3 2020: R+24.6 2016: R+29.3 2012: R+21.2 2008: R+13.6
Not yet ingested
- Civics
- —
Market trends
- HPI YoY
- ▼ -112.20%
- Current HPI
- 248.9386
- Rent YoY
- —
- Metro
- —
- State GDP YoY
- ▲ 1.68%
- F500 in state
- 34
Industry mix (Fortune 500 HQ in PA)
| Industry | F500 HQs | Revenue |
|---|---|---|
| Healthcare | 2 | $309B |
|
||
| Insurance | 2 | $27B |
|
||
| Telecommunications / Media | 1 | $124B |
|
||
| Industrial Distribution | 1 | $22B |
|
||
| Financial Services | 1 | $20B |
|
||
| Chemicals / Materials | 1 | $18B |
|
||
Price history
1 event — show timeline
- 2026-05-04 Coming Soon $89,900 BRIGHT MLS
Cash-flow waterfall
monthlySold comps — $/sqft
last 12 mo · ≤1 miLoading sold comps…