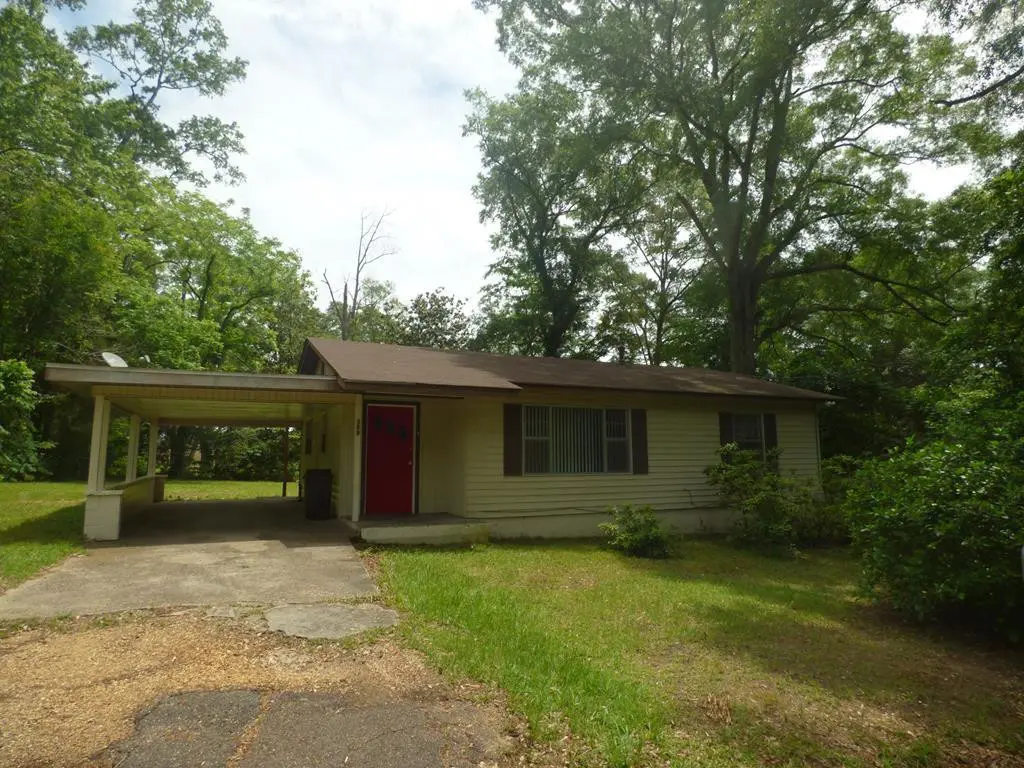
309 West Ave S · McComb, MS
Flood risk 1/10 · Minimal
- FEMA flood zone
- X (unshaded)
- Chance of flooding over 30 yrs
- 0.0%
- Est. flood insurance / yr
- $507 – $1,088
Fire risk 4/10 · Minor
- Est. fire insurance / yr
- $1,241 – $2,305
Heat risk 8/10 · Major
- Hot days now (above 109°F)
- 7 days/yr
- Hot days in 30 yrs
- 20 days/yr
Wind risk 8/10 · Major
- Chance of severe wind over 30 yrs
- 99.0%
Air-quality risk 1/10 · Minimal
- Unhealthy air days now
- 0 days/yr
- Unhealthy air days in 30 yrs
- 0 days/yr
Risk factors via First Street. Map © Google.
Why this score? — see what drove the C- grade
The composite is a weighted blend of 9 inputs, each scored 0–100. Each bar is that input's sub-score; the figure is the points it added to the 100-point composite (weight × sub-score).
- Cash flow +24.4/30.0
- DSCR +7.9/10.0
- 1% rule +5.9/10.0
- ARV discount +5.3/15.0
- Livability +3.5/5.0
- Rent growth +2.5/5.0
- Condition / age +2.5/5.0
- Schools +1.2/10.0
- Appreciation +0.0/10.0
$79,500
🖨 Deal sheet (PDF) 📄 Offer letter ✓ Due diligence
Listing remarks MLS
Looking for a cute starter home or an investment property, this is the home for you. Located on a peaceful, dead end street, this property has a large backyard and is convenient to schools and shopping.
Key facts
- Lots of shopping
- Close to schools
- Lots of shade trees
Tags
Neighborhood map
What this means for you Summary
Snapshot
- This is a 2-bed/1.0-bath single-family listed at $80k.
Deal economics
- At list price, monthly cash flow is $162 ($2k/yr) — positive.
- The deal already cash-flows at list — no discount required.
- Meets the 1% rule at list price ($866 rent vs $80k).
- Cap rate 8.7% vs local median 6.4% in McComb — top-decile yield for the area; either an underpriced asset or a hidden risk that comps aren't pricing in. Stress-test before assuming the spread holds.
Location & tenants
- Location reads 69/100 on livability (#50 in MS) — a middle-class / working-renter tenant base. Strengths: cost of living A+, health & safety A+, housing A-; Watch: schools D-, amenities F, commute F.
- Mccomb School District (town): math 15% / reading 16% proficiency, ranked #106 of 130 in MS (top 82%) — low school quality limits family demand, transient renter base, plan for 1-2y turnover; 93% free/reduced lunch — lower-income household profile, screen leases tightly.
- Market conditions: 191 active listings in the ZIP; 3 comparable units currently listed for rent nearby; rentals lingering (median 44d on market — plan ~5-8 weeks vacancy on turnover, expect pricing pressure); 100% of comp listings sitting > 30 days — soft ceiling on asking rent; 10 units permitted in Pike County in 2024 (0 in 5+ unit buildings).
Forward outlook
- Local home prices are declining (-3.0%/yr); year-one equity from $550 of loan paydown is wiped out by about $2k of value loss. Plan a longer hold.
- Pike County population projected at -14% by 2050 — secular population decline; favor cash flow + early exit over multi-decade hold.
Negotiation context
- Only 8 days on market — expect competitive offers; lowballing is unlikely to land.
- 5 sale attempts since 9y ago with the ask held roughly flat each time — persistent listings suggest the price (not the market) is what's stuck; bring a comps-based counter.
Risks & watch-outs
- Climate carrying-cost: severe wind risk, 99% chance of damaging wind over 30y; extreme-heat days projected 7→20/yr by 2055 (HVAC capex compounding) — expect insurance premiums to compound above CPI over the hold.
Questions for the listing agent
- Built in 1965 — when were the roof, HVAC, electrical panel, plumbing, and water heater last replaced?
- Is there a deadline driving the sale (1031 exchange, divorce, estate, relocation)? That informs how much negotiation room exists.
- Schools are D-rated, which usually means shorter tenancies and higher turnover. Who's the typical renter profile here, and what's been the actual vacancy rate?
- What's the average days-on-market for RENTAL listings here right now (not sales)? A rising rental-DOM trend means longer vacancies and softer asking-rent achievability than the comps imply.
- What's the recent tenant-quality profile in this submarket — average credit score on applications, eviction rate, late-payment / NSF rate, and stable-employment percentage? A property-management company in the area should have these aggregated.
- How much new for-sale + rental construction is in the pipeline within 1–3 miles? Heavy new supply typically softens prices + rents 12–24 months out; constrained supply supports both.
Investment metrics
- 1% rule
- 1.09% ✓
- Cap rate
- 8.74%
- Cash-on-cash
- 8.73%
- DSCR
- 1.39
- GRM
- 7.7
CMA / ARV
- ARV (median comp)
- $75,769
- List price
- $79,500
- Delta
- 4.92%
- Verdict
- FAIR
- Comps
- 20 within 1.0 mi
Show comp detail 2 sales within ~0.75 mi
| Address | Dist | Beds/Ba | Sqft | Sold | Price | $/sf | Match |
|---|---|---|---|---|---|---|---|
| 302 Laurel | 0.53mi | 2/1.0 | 972 (+7%) | 20mo | $84,500 | $87 | 47 |
| 507 N James Ave | 0.69mi | 2/1.0 | 1,030 (+13%) | 22mo | $49,000 | $48 | 28 |
Match score weights: distance 35% · size 25% · config 20% · recency 20%. Top-matched comps best support the ARV.
Projected returns pro-forma
-3.0% appreciation · 3.0% rent growth · sell at horizon
- IRR
- -3.1%
- Equity multiple
- 0.88×
- Total profit
- $-2,575
- Equity at exit
- $11,854
- IRR
- 6.6%
- Equity multiple
- 1.50×
- Total profit
- $11,020
- Equity at exit
- $6,874
Cash invested: $22,260 (down + closing). Projections, not guarantees.
Landlord ↔ Tenant lean methodology
- Overall (STATE)
- 90 Strongly Landlord-Friendly
- State Mississippi
- 90 Strongly Landlord-Friendly · R+11
- County
- — inherits STATE
- City
- — inherits STATE
ZIP-level market 39648
- Active inventory
- 191
- Price-to-rent
- 7.7×
Monthly cashflow live
- Estimated rent
- $866 medium interval (Pro) →
- Mortgage (P&I)
- −$417
- Tax from tax record
- −$72 /mo · $863/yr
- Insurance
- −$33
- HOA
- −$0
- Vacancy / Maint / Mgmt
- −$182
- Net cashflow
- $162
Break-even live
Sensitivity live
| Price | -10% $207 | -5% $184 | +0% $162 | +5% $139 | +10% $117 |
|---|---|---|---|---|---|
| Rent | -10% $94 | -5% $128 | +0% $162 | +5% $196 | +10% $230 |
| Rate | -1.0pp $202 | -0.5pp $182 | base $162 | +0.5pp $141 | +1.0pp $120 |
UW: 25.0% down · 7.5% · 30yr · 1.5% tax · 5.0% vac · 8.0% maint · 8.0% mgmt
Financing live
Cash to close
- Down payment
- $19,875
- Closing costs
- $2,385
- Reserves months
- —
- Total cash needed
- —
Loan-product check · same deal, 3 products live
Conventional
25% down · 7.5% · 30yr
- Down + closing
- —
- Monthly P&I
- —
- Monthly cashflow
- —
- DSCR
- —
- Eligible?
- —
Personal DTI + credit; lowest rate.
DSCR
20% down · 8.5% · 30yr
- Down + closing
- —
- Monthly P&I
- —
- Monthly cashflow
- —
- DSCR
- —
- Eligible?
- —
No personal income docs; deal must DSCR.
Hard money
10% down · 12.0% · 12mo
- Down + closing
- —
- Monthly P&I
- —
- Monthly cashflow
- —
- DSCR
- —
- Eligible?
- —
Short-term bridge; refi at stabilization.
Rent comps 3 comps
| Address | Beds | Baths | Sqft | Rent | $/sqft | DOM | Units | Dist |
|---|---|---|---|---|---|---|---|---|
| 919 25th St McComb, MS | 3.0 | 3.0 | 1107 | $595 | $0.54 | 44d | 1 | 0.83mi |
| 1210 Parklane Rd McComb, MS | 1.0–2.0 | 1.0–2.0 | 844 | $1,171 | $1.39 | 44d | 5 | 0.96mi |
| 1240 Parklane Rd McComb, MS | 1.0–3.0 | 1.0–2.0 | 994 | $836 | $0.84 | 44d | 1 | 1.05mi |
Listing history 18 events
-
2026-06-21days on market $79,500 Active 8 DOM
-
2026-06-18days on market $79,500 Active 6 DOM
-
2026-06-17days on market $79,500 Active 5 DOM
-
2026-06-16days on market $79,500 Active 4 DOM
-
2026-06-15days on market $79,500 Active 3 DOM
-
2026-06-13remarks 367-char remark
-
2026-06-13statusdays on market $79,500 Active 1 DOM
-
2026-04-22price $79,500
-
2025-12-02status Active
-
2025-11-18status Pending
-
2025-11-18historical
-
2025-05-01$89,000 Active
-
2018-10-04soldstatus
-
2018-06-07soldstatus 203-char remark
Show marketing remark (203 chars)
Looking for a cute starter home or an investment property, this is the home for you. Located on a peaceful, dead end street, this property has a large backyard and is convenient to schools and shopping.
-
2018-06-07soldstatus
Show marketing remark (203 chars)
Looking for a cute starter home or an investment property, this is the home for you. Located on a peaceful, dead end street, this property has a large backyard and is convenient to schools and shopping.
-
2018-03-29$39,900 203-char remark
Show marketing remark (203 chars)
Looking for a cute starter home or an investment property, this is the home for you. Located on a peaceful, dead end street, this property has a large backyard and is convenient to schools and shopping.
-
2018-02-23historical
-
2017-08-23$44,500
ⓘ Source: listings_history table (triggers on properties + properties_extension) + one-shot
backfill from property_details.listing_events for pre-trigger history.
Tax reassessment forecast MS · Resets to sale price
- Current annual tax
- $863 · $72/mo
- Projected year-2 tax
- $863 · $72/mo
- Expected delta
- $0/yr ($0/mo · 0.0%)
ⓘ Screening estimate from a state-policy table — verify with the county assessor before closing.
Climate risk First Street
- Flood 1/10 Low FEMA zone X (unshaded) · 0% chance over 30 yrs
- Wildfire 4/10 Moderate
- Heat 8/10 Severe 7 d/yr ≥109°F today · 20 d/yr by 30 yrs out
- Wind 8/10 Severe 99% chance of damaging wind over 30 yrs
- Air quality 1/10 Low 0 unhealthy d/yr today · 0 by 30 yrs out
Nearby sold comps map
Loading sold comps map…
Walkable amenities ~0.75 mi
Loading nearby amenities…
Taxation est. · year 1
- Rental income
- $10,388
- − Mortgage interest
- −$4,453
- − Property taxes
- −$863
- − Insurance
- −$398
- − Repairs & maintenance
- −$831
- − Management
- −$831
- − Depreciation
- −$2,313
- Taxable income
- $699
- Est. tax owed @ 24.0%
- −$168
- After-tax cash flow
- $1,775/yr
For passive investors: Depreciation is non-cash, so a rental often shows a tax loss while cash-flowing — sheltering income. Rental losses are passive: they offset passive income freely, and up to $25,000/yr can offset ordinary (W-2) income if you actively participate and your MAGI is under $100k (phasing out to $0 by $150k); unused losses carry forward. On sale, claimed depreciation is recaptured at up to 25%, and gains may owe capital-gains tax (a 1031 exchange can defer both). Figures are a year-1 estimate at your 24.0% rate — not tax advice; consult a CPA.
Schools (NCES district)
- District
- Mccomb School District
- NCES district ID
- 2802880
- Math proficiency
- 15% ▼ -20.00%
- Reading proficiency
- 16% ▼ -5.00%
- Median HH income
- $29,855
- Composite
- 12.26/100
- National rank
- #9645
- State rank
- #106 of 130 in MS
Livability — McComb
- Score
- 69/100
- State rank
- #50
- US rank
- #8347
Category grades
Schools grade is shown separately in the Schools card above.
Census & demographics
- Census place
- McComb, MS
- Population (ZIP)
- 19,767
Population outlook (Pike County) Hauer SSP2
- Today (2025)
- 38,766 people
- By 2030
- 37,874 · -2.3%
- By 2040
- 35,743 · -7.8%
- By 2050
- 33,276 · -14.2%
- By 2075
- 26,799 · -30.9%
- By 2100
- 18,562 · -52.1%
Race, ethnicity, and origin ACS 2023
- Neighborhood character
- Majority Black (64%)
- Race & ethnicity
- Black 64% White 32% Two or more races 2% Hispanic / Latino 2%
- Common ancestry
- Slovak 2% Lithuanian 1% Italian 1%
- Foreign-born
- 1%
- Languages at home
- 98% English-only · Spanish 1%
Political lean MEDSL · Pike
- 2024 margin
- Toss-up / Even · D 47.8% · R 51.3%
- 2008→2024 swing
- -7.0pp toward R · 2008: 3.5pp · 2024: -3.5pp
- All cycles
- 2024: R+3.5 2020: D+1.0 2016: R+0.7 2012: D+7.6 2008: D+3.5
Not yet ingested
- Civics
- —
Market trends
- HPI YoY
- ▼ -88.61%
- Current HPI
- 92.2495
- Rent YoY
- —
- Metro
- —
- State GDP YoY
- —
- F500 in state
- 0
Price history
+78.7% since first listed12 events — show timeline
- 2026-06-13 Listed $79,500 FSBO.com
- 2026-04-22 Price Changed $79,500 MLSU
- 2025-12-02 Relisted — MLSU
- 2025-11-18 Pending — MLSU
- 2025-11-18 Listing Removed — MLSU
- 2025-05-01 Listed $89,000 MLSU
- 2018-10-04 Sold (Public Records) — Public Records
- 2018-06-07 Sold (Public Records) — Public Records
- 2018-06-07 Sold (MLS) — MLSU
- 2018-03-29 Listed $39,900 MLSU
- 2018-02-23 Listing Removed — MLSU
- 2017-08-23 Listed $44,500 MLSU
Property tax history
+0.7%/yrLatest (2024): $863 · +1.1% YoY. Source: county tax records.
Cash-flow waterfall
monthlySold comps — $/sqft
last 12 mo · ≤1 miLoading sold comps…