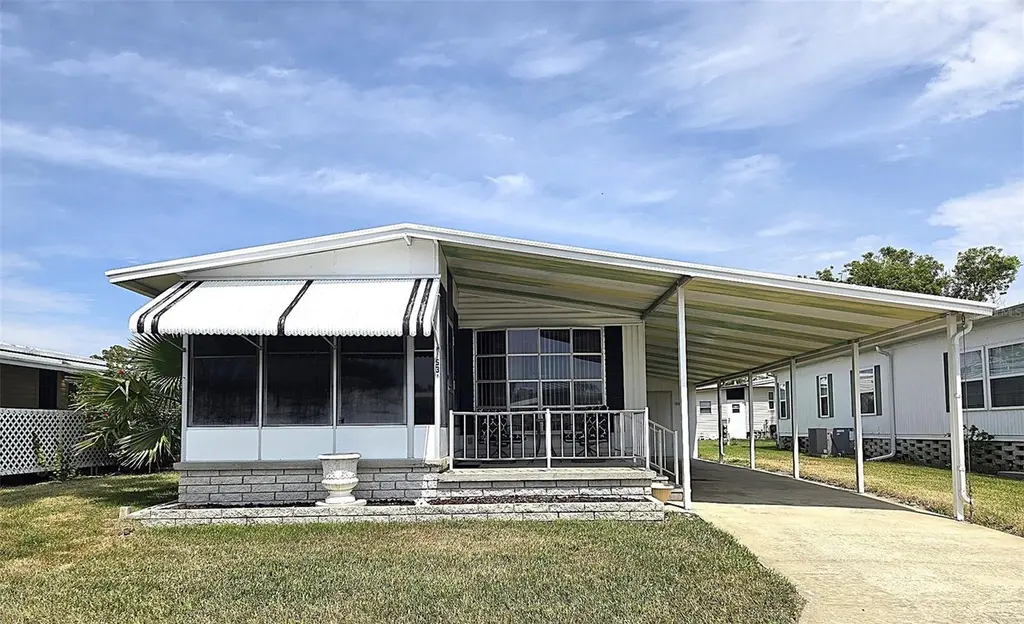
39820 US Highway 19 N #153 · Tarpon Springs, FL
Flood risk 1/10 · Minimal
- FEMA flood zone
- X (unshaded)
- Chance of flooding over 30 yrs
- 0.0%
- Est. flood insurance / yr
- $507 – $1,088
Fire risk 1/10 · Minimal
- Est. fire insurance / yr
- $947 – $1,759
Heat risk 10/10 · Severe
- Hot days now (above 109°F)
- 7 days/yr
- Hot days in 30 yrs
- 25 days/yr
Wind risk 10/10 · Severe
- Chance of severe wind over 30 yrs
- 99.0%
Air-quality risk 3/10 · Minor
- Unhealthy air days now
- 2 days/yr
- Unhealthy air days in 30 yrs
- 2 days/yr
Risk factors via First Street. Map © Google.
Why this score? — see what drove the B grade
The composite is a weighted blend of 9 inputs, each scored 0–100. Each bar is that input's sub-score; the figure is the points it added to the 100-point composite (weight × sub-score).
- Cash flow +26.5/30.0
- ARV discount +15.0/15.0
- 1% rule +10.0/10.0
- DSCR +9.0/10.0
- Schools +4.3/10.0
- Livability +3.4/5.0
- Condition / age +2.5/5.0
- Rent growth +2.2/5.0
- Appreciation +0.0/10.0
$119,000
🖨 Deal sheet (PDF) 📄 Offer letter ✓ Due diligence
Listing remarks
Welcome to resort-style living in the highly sought-after Stonehedge On The Hill 55+ community! This charming and well-maintained 2-bedroom, 2-bath home offers the perfect blend of comfort, convenience, and affordable Florida living — and best of all, YOU OWN THE LAND. .. NO LOT RENT! The share price for the land is included in the list price. This move-in-ready home features an updated oversized kitchen with abundant cabinet space, closet pantry, eat-in dining area, all appliances included, and a fully equipped kitchen. The spacious dining room and open living areas make this home ideal for entertaining family and friends. The bonus room is currently used as an office. Enjoy relaxing
Key facts
- Non flood zone
- Storage shed
- You own the land
Tags
Property features AI
Finance
- Other: Lease restrictions apply
- Financial info: Total annual fees $4,560; Monthly fees $380
- HOA & community: HOA required (Ameri-Tech Community Mgmt); Monthly HOA fee $380; Association amenities: Cable TV, Clubhouse, Laundry, Pool, Recreation facilities, Shuffleboard court, Wheelchair access, Gated community, Maintenance, Management, Private road, Trash, Water, Sewer, Insurance, Escrow reserves; Association approval required; Senior community; Pets allowed (cats allowed, number limit)
Exterior
- Parking: Covered parking; Driveway parking; On-street parking; Tandem spaces; 2-car carport
- Security: Smoke detectors
- Utilities: Public water and well; Public sewer; Electricity connected; Cable available; BB/HS internet available; Sewer connected; Water connected; Sprinkler well
- Home design: Manufactured home (double wide); One story; West-facing entry; Completed condition; Entry level: One
- Construction: Metal frame construction; Membrane roof; Metal roof; Pillar/post/pier foundation; Built in (manufactured home)
- Exterior features: Enclosed patio; Front porch; Awnings; Exterior lighting; Rain gutters; Sidewalk; Sliding doors; Sprinkler (metered); Storage shed; Irrigation equipment
Interior
- Kitchen: Dishwasher; Microwave; Range; Refrigerator; Ice maker; Eat-in kitchen
- Bedrooms: 2 bedrooms
- Flooring: Carpet; Ceramic tile; Laminate
- Bathrooms: 2 full bathrooms
- Heating & cooling: Central heating; Central air
- Interior features: Built-in features; Ceiling fans; Eat-in kitchen; Living room/dining room combo; Solid wood cabinets; Thermostat; Walk-in closets; Window treatments; Blinds
- Laundry & utility: Washer; Dryer; Exterior laundry (outside); Electric water heater
Neighborhood map
What this means for you Summary
Snapshot
- This is a 2-bed/2.0-bath manufactured listed at $119k.
Deal economics
- At list price, monthly cash flow is $313 ($4k/yr) — positive.
- The deal already cash-flows at list — no discount required.
- Meets the 1% rule at list price ($2k rent vs $119k).
- Recommended offer: $115k (3.0% below list) — sets the bar for market timing.
- Cap rate 9.4% vs local median 3.3% in Tarpon Springs — top-decile yield for the area; either an underpriced asset or a hidden risk that comps aren't pricing in. Stress-test before assuming the spread holds.
Location & tenants
- Location reads 68/100 on livability (#502 in FL) — a middle-class / working-renter tenant base. Strengths: housing A+, cost of living A; Watch: employment C-, amenities F, commute F.
- Pinellas (suburban): math 51% / reading 51% proficiency, ranked #31 of 73 in FL (top 42%) — acceptable for families but not a draw, mixed tenant base, ~2y average lease.
- Zoned schools: Tarpon Springs Elementary School (math 57% / reading 41%, grade D, #1,134 of 2,144 statewide, top 54%, 506 students, 80% FRL); Tarpon Springs Middle School (math 59% / reading 61%, grade B, #135 of 571 statewide, top 24%, 644 students, 50% FRL); Tarpon Springs High School (math 30% / reading 47%, grade F, #321 of 667 statewide, top 49%, 1,139 students, 46% FRL).
- Market conditions: Rents soft (-1.2%/yr); 404 active listings in the ZIP; 26 comparable units currently listed for rent nearby; rentals at typical pace (median 24d on market — plan ~3-4 weeks tenant-placement turnaround); 2,676 units permitted in Pinellas County in 2024 (1,422 in 5+ unit buildings).
- This rent runs 30% of the median local income ($75k/yr) — at the standard rent-burdened threshold; future hikes will face affordability resistance.
Forward outlook
- Local home prices are declining (-3.0%/yr); year-one equity from $823 of loan paydown is wiped out by about $4k of value loss. Plan a longer hold.
- Pinellas County population projected at +14% by 2050 — modest demand growth; plan on rents tracking national, not racing it.
Negotiation context
- It's been on market 40 days — a 3% lower offer ($115k) is reasonable based on typical stale-listing flexibility.
Risks & watch-outs
- Watch-outs: HOA is 20% of rent.
- Climate carrying-cost: severe wind risk, 99% chance of damaging wind over 30y; extreme-heat days projected 7→25/yr by 2055 (HVAC capex compounding) — expect insurance premiums to compound above CPI over the hold.
Questions for the listing agent
- It's been on market 40 days. Have you received any prior offers? Is the seller open to a 3% concession, seller financing, or rate buy-down credit?
- Built in 1977 — when were the roof, HVAC, electrical panel, plumbing, and water heater last replaced?
- What does the HOA fee cover, when was the last increase, and are there any pending special assessments or reserve-fund shortfalls?
- Is there a deadline driving the sale (1031 exchange, divorce, estate, relocation)? That informs how much negotiation room exists.
- Schools are A-rated — typically a magnet for longer-tenancy family renters. What's the average tenant stay here, and is there a school-zone premium baked into asking?
- What's the average days-on-market for RENTAL listings here right now (not sales)? A rising rental-DOM trend means longer vacancies and softer asking-rent achievability than the comps imply.
- What's the recent tenant-quality profile in this submarket — average credit score on applications, eviction rate, late-payment / NSF rate, and stable-employment percentage? A property-management company in the area should have these aggregated.
- How much new for-sale + rental construction is in the pipeline within 1–3 miles? Heavy new supply typically softens prices + rents 12–24 months out; constrained supply supports both.
Investment metrics
- 1% rule
- 1.58% ✓
- Cap rate
- 9.45%
- Cash-on-cash
- 11.27%
- DSCR
- 1.50
- GRM
- 5.3
CMA / ARV
- ARV (on-the-fly)
- $150,912
- Comps found
- 5
Show comp detail 5 sales within ~0.75 mi
| Address | Dist | Beds/Ba | Sqft | Sold | Price | $/sf | Match |
|---|---|---|---|---|---|---|---|
| 39820 US Highway 19 N #9 | 0.09mi | 2/2.0 | 1,104 (-4%) | 11mo | $145,000 | $131 | 80 |
| 39820 US Highway 19 N #180 | 0.09mi | 3/2.0 (+1) | 1,296 (+12%) | 8mo | $185,000 | $143 | 64 |
| 219 Seagull Dr | 0.35mi | 2/2.0 | 1,008 (-12%) | 8mo | $130,000 | $129 | 56 |
| 39820 US Highway 19 N #10 | 0.09mi | 2/2.0 | 1,320 (+15%) | 20mo | $165,000 | $125 | 55 |
| 237 Harmony Way | 0.25mi | 2/2.0 | 989 (-14%) | 18mo | $160,000 | $162 | 50 |
Match score weights: distance 35% · size 25% · config 20% · recency 20%. Top-matched comps best support the ARV.
Projected returns pro-forma
-3.0% appreciation · 0.0% rent growth · sell at horizon
- IRR
- -3.9%
- Equity multiple
- 0.86×
- Total profit
- $-4,633
- Equity at exit
- $17,743
- IRR
- 0.7%
- Equity multiple
- 1.04×
- Total profit
- $1,269
- Equity at exit
- $10,289
Cash invested: $33,320 (down + closing). Projections, not guarantees.
Landlord ↔ Tenant lean methodology
- Overall (STATE)
- 87 Strongly Landlord-Friendly
- State Florida
- 87 Strongly Landlord-Friendly · R+3
- County
- — inherits STATE
- City
- — inherits STATE
ZIP-level market 34689
- Rents YoY
- -1.2%
- Active inventory
- 404
- Price-to-rent
- 5.3×
Monthly cashflow live
- Estimated rent
- $1,886 high interval (Pro) →
- Mortgage (P&I)
- −$624
- Tax from tax record
- −$123 /mo · $1,481/yr
- Insurance
- −$50
- HOA
- −$380
- Vacancy / Maint / Mgmt
- −$396
- Net cashflow
- $313
Break-even live
Sensitivity live
| Price | -10% $380 | -5% $347 | +0% $313 | +5% $279 | +10% $246 |
|---|---|---|---|---|---|
| Rent | -10% $164 | -5% $238 | +0% $313 | +5% $387 | +10% $462 |
| Rate | -1.0pp $373 | -0.5pp $343 | base $313 | +0.5pp $282 | +1.0pp $251 |
UW: 25.0% down · 7.5% · 30yr · 1.5% tax · 5.0% vac · 8.0% maint · 8.0% mgmt
Financing live
Cash to close
- Down payment
- $29,750
- Closing costs
- $3,570
- Reserves months
- —
- Total cash needed
- —
Loan-product check · same deal, 3 products live
Conventional
25% down · 7.5% · 30yr
- Down + closing
- —
- Monthly P&I
- —
- Monthly cashflow
- —
- DSCR
- —
- Eligible?
- —
Personal DTI + credit; lowest rate.
DSCR
20% down · 8.5% · 30yr
- Down + closing
- —
- Monthly P&I
- —
- Monthly cashflow
- —
- DSCR
- —
- Eligible?
- —
No personal income docs; deal must DSCR.
Hard money
10% down · 12.0% · 12mo
- Down + closing
- —
- Monthly P&I
- —
- Monthly cashflow
- —
- DSCR
- —
- Eligible?
- —
Short-term bridge; refi at stabilization.
Rent comps 26 comps
| Address | Beds | Baths | Sqft | Rent | $/sqft | DOM | Units | Dist |
|---|---|---|---|---|---|---|---|---|
| 39650 US Highway 19 N #141 Tarpon Springs, FL | 2.0 | 2.0 | 950 | $1,550 | $1.63 | 6d | 1 | 0.18mi |
| 640 Haven Pl #640 Tarpon Springs, FL | 2.0 | 1.5 | 960 | $1,575 | $1.64 | 0d | 1 | 0.39mi |
| 673 Haven Pl #673 Tarpon Springs, FL | 2.0 | 1.5 | 960 | $1,450 | $1.51 | 16d | 1 | 0.42mi |
| 501 Saint Michaels Way Unit 520 Tarpon Springs, FL | 2.0 | 2.0 | 1000 | $1,595 | $1.59 | 26d | 1 | 0.46mi |
| 605 S Disston Ave Tarpon Springs, FL | 3.0 | 1.0 | 1290 | $2,120 | $1.64 | 23d | 1 | 0.48mi |
| 524 E Lime St Tarpon Springs, FL | 2.0 | 1.0 | 775 | $1,600 | $2.06 | 26d | 1 | 0.64mi |
| 1113 E Lime St Tarpon Springs, FL | 2.0 | 1.0 | 780 | $1,200 | $1.54 | 5d | 1 | 0.70mi |
| 1185 S Pinellas Ave Tarpon Springs, FL | 1.0–3.0 | 1.0–2.0 | 1013 | $2,154 | $2.12 | 0d | 20 | 0.76mi |
| 650 E Tarpon Ave Unit C1 Tarpon Springs, FL | 3.0 | 2.0 | 900 | $2,000 | $2.22 | 9d | 1 | 0.77mi |
| 326 S Grosse Ave Apt 2 Tarpon Springs, FL | 3.0 | 2.0 | 1130 | $2,098 | $1.86 | 26d | 1 | 0.79mi |
| 320 S Grosse Ave Tarpon Springs, FL | 3.0 | 1.0 | 936 | $1,749 | $1.87 | 26d | 1 | 0.80mi |
| 401 E Boyer St Tarpon Springs, FL | 3.0 | 2.0 | 1130 | $2,099 | $1.86 | 3d | 1 | 0.81mi |
| 401 E Boyer St Unit 3 Tarpon Springs, FL | 3.0 | 2.0 | 1130 | $2,099 | $1.86 | 26d | 1 | 0.81mi |
| 401 E Boyer St Tarpon Springs, FL | 3.0 | 2.0 | 1130 | $2,299 | $2.03 | 26d | 1 | 0.81mi |
| 316 E Boyer St Tarpon Springs, FL | 3.0 | 1.0 | 936 | $1,749 | $1.87 | 26d | 1 | 0.83mi |
| 329 Moorings Cove Dr Tarpon Springs, FL | 2.0 | 2.0 | 1020 | $1,700 | $1.67 | 22d | 1 | 1.03mi |
| 825 Cypress St Tarpon Springs, FL | 1.0–2.0 | 1.0 | 750 | $1,674 | $2.23 | 0d | 6 | 1.04mi |
| 90 S Highland Ave #101 Tarpon Springs, FL | 2.0 | 2.0 | 1130 | $1,795 | $1.59 | 26d | 1 | 1.13mi |
| 1990 Carolina Ave Tarpon Springs, FL | 3.0 | 1.0 | 960 | $1,250 | $1.30 | 23d | 1 | 1.19mi |
| 610 N Walton Ave Tarpon Springs, FL | 3.0 | 2.0 | 1280 | $2,045 | $1.60 | 26d | 1 | 1.21mi |
| 103 E Park St Tarpon Springs, FL | 3.0 | 1.0 | 999 | $3,000 | $3.00 | 26d | 1 | 1.22mi |
| 707 E Spruce St Tarpon Springs, FL | 3.0 | 1.0 | 967 | $1,700 | $1.76 | 12d | 1 | 1.23mi |
| 817 Margo St Tarpon Springs, FL | 2.0 | 1.0 | 792 | $1,600 | $2.02 | 26d | 1 | 1.25mi |
| 105 S Spring Blvd Unit 10 Tarpon Springs, FL | 1.0 | 1.0 | 700 | $1,350 | $1.93 | 26d | 1 | 1.31mi |
| 2350 Cypress Pond Rd Palm Harbor, FL | 1.0–2.0 | 1.0–2.0 | 790 | $1,675 | $2.12 | 0d | 53 | 1.44mi |
| 605 Lennox Rd W Palm Harbor, FL | 2.0 | 2.0 | 1050 | $1,950 | $1.86 | 4d | 1 | 1.44mi |
HOA detail
- Monthly dues
- $380 · $4,560/yr
Listing history 14 events
-
2026-06-22days on market $119,000 Active 40 DOM
-
2026-06-18days on market $119,000 Active 37 DOM
-
2026-06-17days on market $119,000 Active 36 DOM
-
2026-06-16days on market $119,000 Active 35 DOM
-
2026-06-15days on market $119,000 Active 34 DOM
-
2026-06-13days on market $119,000 Active 32 DOM
-
2026-06-09days on market $119,000 Active 28 DOM
-
2026-06-08days on market $119,000 Active 27 DOM
-
2026-06-07days on market $119,000 Active 26 DOM
-
2026-06-04days on market $119,000 Active 23 DOM
-
2026-06-03days on market $119,000 Active 22 DOM
-
2026-06-01days on market $119,000 Active 20 DOM
-
2026-05-31days on market $119,000 Active 19 DOM
-
2026-05-13$119,000 Active
ⓘ Source: listings_history table (triggers on properties + properties_extension) + one-shot
backfill from property_details.listing_events for pre-trigger history.
Tax reassessment forecast FL · Resets to sale price
- Current annual tax
- $1,481 · $123/mo
- Projected year-2 tax
- $1,481 · $123/mo
- Expected delta
- $0/yr ($0/mo · 0.0%)
ⓘ Screening estimate from a state-policy table — verify with the county assessor before closing.
Climate risk First Street
- Flood 1/10 Low FEMA zone X (unshaded) · 0% chance over 30 yrs
- Wildfire 1/10 Low
- Heat 10/10 Extreme 7 d/yr ≥109°F today · 25 d/yr by 30 yrs out
- Wind 10/10 Extreme 99% chance of damaging wind over 30 yrs
- Air quality 3/10 Moderate 2 unhealthy d/yr today · 2 by 30 yrs out
Nearby sold comps map
Loading sold comps map…
Walkable amenities ~0.75 mi
Loading nearby amenities…
Taxation est. · year 1
- Rental income
- $22,633
- − Mortgage interest
- −$6,666
- − Property taxes
- −$1,481
- − Insurance
- −$595
- − Repairs & maintenance
- −$1,811
- − Management
- −$1,811
- − HOA
- −$4,560
- − Depreciation
- −$3,462
- Taxable income
- $2,248
- Est. tax owed @ 24.0%
- −$539
- After-tax cash flow
- $3,216/yr
For passive investors: Depreciation is non-cash, so a rental often shows a tax loss while cash-flowing — sheltering income. Rental losses are passive: they offset passive income freely, and up to $25,000/yr can offset ordinary (W-2) income if you actively participate and your MAGI is under $100k (phasing out to $0 by $150k); unused losses carry forward. On sale, claimed depreciation is recaptured at up to 25%, and gains may owe capital-gains tax (a 1031 exchange can defer both). Figures are a year-1 estimate at your 24.0% rate — not tax advice; consult a CPA.
Schools (NCES district)
- District
- Pinellas
- NCES district ID
- 1201560
- Math proficiency
- 51% ▼ -5.00%
- Reading proficiency
- 51% ▼ -3.00%
- Median HH income
- $46,270
- Composite
- 43.27/100
- National rank
- #3046
- State rank
- #31 of 73 in FL
Livability — Tarpon Springs
- Score
- 68/100
- State rank
- #502
- US rank
- #9244
Category grades
Schools grade is shown separately in the Schools card above.
Census & demographics
- Census place
- Tarpon Springs, FL
- County
- Pinellas County · 939,478 people
- City population
- 27,324
- Metro
- Tampa-St. Petersburg-Clearwater, FL
- Population (ZIP)
- 27,324
- Household income
- $74,854
- Rent vs Own
- Severe rent burden
- 721.0
Population outlook (Pinellas County) Hauer SSP2
- Today (2025)
- 1,027,532 people
- By 2030
- 1,063,586 · +3.5%
- By 2040
- 1,125,020 · +9.5%
- By 2050
- 1,168,637 · +13.7%
- By 2075
- 1,265,188 · +23.1%
- By 2100
- 1,260,357 · +22.7%
Race, ethnicity, and origin ACS 2023
- Neighborhood character
- Predominantly White (80%)
- Race & ethnicity
- White 80% Hispanic / Latino 10% Two or more races 7% Black 6%
- Hispanic origin (detail)
- Mexican 2% Puerto Rican 4%
- Common ancestry
- Romanian 6% Lithuanian 3% Slovak 2%
- Foreign-born
- 10% · Canada, Jamaica, Dominican Republic
- Languages at home
- 84% English-only · Other Indo-European 6% Spanish 6% French/Haitian/Cajun 1%
Political lean MEDSL · Pinellas
- 2024 margin
- Lean R (+5.2) · D 46.9% · R 52.1%
- 2008→2024 swing
- -13.5pp toward R · 2008: 8.3pp · 2024: -5.2pp
- All cycles
- 2024: R+5.2 2020: D+0.2 2016: R+1.1 2012: D+5.6 2008: D+8.3
Not yet ingested
- Civics
- —
Market trends
- HPI YoY
- ▼ -300.96%
- Current HPI
- 303.7434
- Rent YoY
- ▼ -1.16%
- Metro
- Tampa-St. Petersburg-Clearwater, FL
- State GDP YoY
- ▲ 3.28%
- F500 in state
- 36
Industry mix (Fortune 500 HQ in FL)
| Industry | F500 HQs | Revenue |
|---|---|---|
| Industrial Technology | 2 | $29B |
|
||
| Insurance | 2 | $17B |
|
||
| Retail | 1 | $60B |
|
||
| Technology Distribution | 1 | $58B |
|
||
| Homebuilding | 1 | $35B |
|
||
| Technology Manufacturing | 1 | $35B |
|
||
Price history
1 event — show timeline
- 2026-05-13 Listed $119,000 Stellar MLS as Distributed by MLS Grid
Property tax history
+3.8%/yrLatest (2025): $1,481 · +10.7% YoY. Source: county tax records.
Cash-flow waterfall
monthlySold comps — $/sqft
last 12 mo · ≤1 miLoading sold comps…