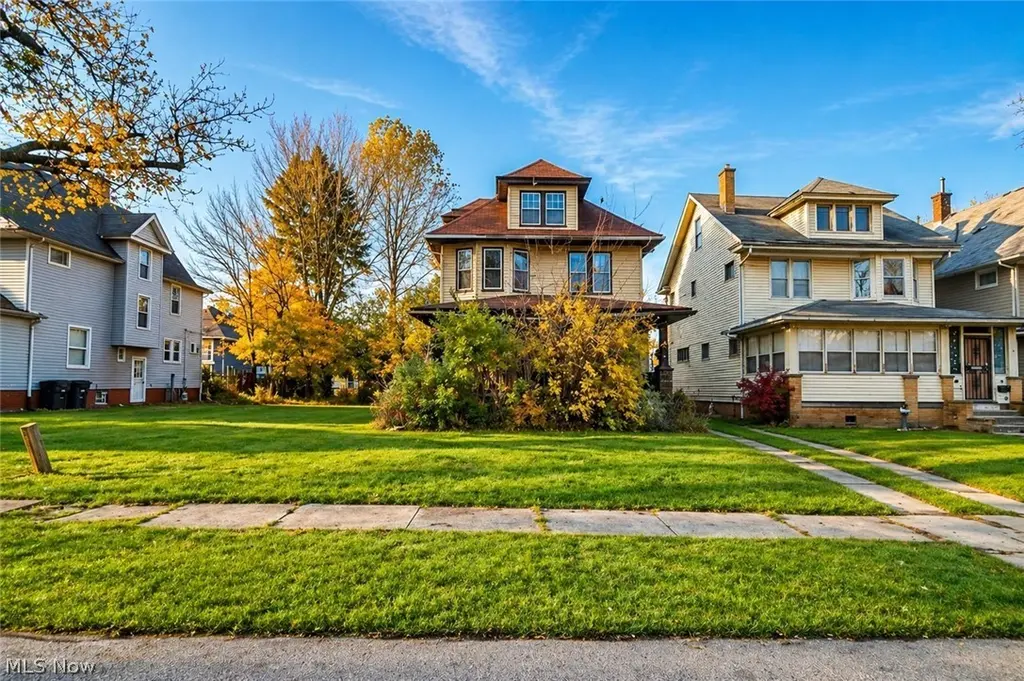
1172 Melbourne Rd · East Cleveland, OH
Flood risk 1/10 · Minimal
- FEMA flood zone
- X (unshaded)
- Chance of flooding over 30 yrs
- 0.0%
- Est. flood insurance / yr
- $473 – $860
Fire risk 1/10 · Minimal
- Est. fire insurance / yr
- $713 – $1,323
Heat risk 3/10 · Minor
- Hot days now (above 95°F)
- 7 days/yr
- Hot days in 30 yrs
- 17 days/yr
Wind risk 1/10 · Minimal
- Chance of severe wind over 30 yrs
- —
Air-quality risk 3/10 · Minor
- Unhealthy air days now
- 3 days/yr
- Unhealthy air days in 30 yrs
- 5 days/yr
Risk factors via First Street. Map © Google.
Why this score? — see what drove the B+ grade
The composite is a weighted blend of 9 inputs, each scored 0–100. Each bar is that input's sub-score; the figure is the points it added to the 100-point composite (weight × sub-score).
- Cash flow +30.0/30.0
- ARV discount +15.0/15.0
- 1% rule +10.0/10.0
- DSCR +10.0/10.0
- Rent growth +3.8/5.0
- Livability +3.3/5.0
- Condition / age +2.5/5.0
- Schools +0.7/10.0
- Appreciation +0.0/10.0
$45,000
🖨 Deal sheet 📄 Offer letter ✓ Due diligence
Listing remarks
Welcome to 1172 Melbourne Rd, a classic Colonial-style home brimming with character, space, and opportunity. Offering approximately 1,536 square feet, this 4-bedroom, 1.5-bath residence invites you to reimagine its full potential and bring your vision to life. From the moment you arrive, the deep covered front porch with stone accents sets a warm and welcoming tone—an ideal space to relax and take in the charm of this timeless façade. Step inside and discover a layout rich in traditional character, featuring a spacious living room anchored by a fireplace, creating a natural focal point for gatherings or future design inspiration. The adjoining dining area offers an elegant sett
Key facts
- Functional footprint
- Private balcony
- Spacious living room
Tags
Property features AI
Exterior
- Parking: Detached garage; 2 garage spaces
- Utilities: Public water; Public sewer
- Home design: 2 stories; Frame construction with vinyl siding; Asphalt shingle roof; Brick/mortar and stone foundation
- Construction: Built (year source: public records)
- Exterior features: Porch; Balcony; Private entrance; City lot; Flat, level lot
Interior
- Bedrooms: Total rooms: 7; Has basement (full, unfinished)
- Bathrooms: 1 full bathroom; 1 half bathroom
- Heating & cooling: Gas heating; Hot water heating; Radiators; Steam heating
- Interior features: High ceilings; Pantry; Storage; Natural woodwork; Bay windows; Double-pane windows
- Laundry & utility: Laundry in basement
Neighborhood map
What this means for you Summary
Snapshot
- This is a 3-bed/1.0-bath single-family listed at $45k.
Deal economics
- At list price, monthly cash flow is $785 ($9k/yr) — positive.
- The deal already cash-flows at list — no discount required.
- Meets the 1% rule at list price ($1k rent vs $45k).
- Recommended offer: $44k (3.0% below list) — sets the bar for market timing.
- Cap rate 27.2% vs local median 17.4% in East Cleveland — top-decile yield for the area; either an underpriced asset or a hidden risk that comps aren't pricing in. Stress-test before assuming the spread holds.
Location & tenants
- Location reads 66/100 on livability (#650 in OH) — a middle-class / working-renter tenant base. Strengths: commute A+, cost of living A+, health & safety A+; Watch: schools F, crime F, employment F.
- East Cleveland City School District (suburban): math 4% / reading 17% proficiency, ranked #652 of 656 in OH (top 99%) — low school quality limits family demand, transient renter base, plan for 1-2y turnover; 92% free/reduced lunch — lower-income household profile, screen leases tightly.
- Market conditions: Rents rising fast (+5.2%/yr); 99 active listings in the ZIP; 39 comparable units currently listed for rent nearby; rentals at typical pace (median 16d on market — plan ~3-4 weeks tenant-placement turnaround); lower-income renter base — watch delinquency; 1,441 units permitted in Cuyahoga County in 2024 (700 in 5+ unit buildings).
- At $1,394/mo this rent would consume 58% of the median local household income ($29k/yr) (locally 1702% of renters already pay >50% of income on rent) — very limited rent-growth headroom before tenants either downsize or default.
Forward outlook
- Local home prices are declining (-3.0%/yr); year-one equity from $311 of loan paydown is wiped out by about $1k of value loss. Plan a longer hold.
- Cuyahoga County population projected to shrink 8% by 2050 — rents likely to lag national; underwrite the cash flow, not the appreciation.
- At projected returns (-3.0% appreciation + 5.2% rent growth), your $13k cash investment doubles in ~2 years — after that, you're playing with house money.
Negotiation context
- It's been on market 50 days — a 3% lower offer ($44k) is reasonable based on typical stale-listing flexibility.
- Current owner paid $20k; list at $45k implies a 120% gain — meaningful room to come down on a strong offer.
Risks & watch-outs
- Watch-outs: built in 1912 — expect roof / HVAC / electrical / plumbing capex.
Questions for the listing agent
- It's been on market 50 days. Have you received any prior offers? Is the seller open to a 3% concession, seller financing, or rate buy-down credit?
- Built in 1912 — when were the roof, HVAC, electrical panel, plumbing, and water heater last replaced?
- Is there a deadline driving the sale (1031 exchange, divorce, estate, relocation)? That informs how much negotiation room exists.
- Schools are F-rated, which usually means shorter tenancies and higher turnover. Who's the typical renter profile here, and what's been the actual vacancy rate?
- Crime grade is F in this area — have there been break-ins, vandalism, or insurance claims at this property in the last 3 years? What carrier currently insures it and at what premium?
- What's the average days-on-market for RENTAL listings here right now (not sales)? A rising rental-DOM trend means longer vacancies and softer asking-rent achievability than the comps imply.
- What's the recent tenant-quality profile in this submarket — average credit score on applications, eviction rate, late-payment / NSF rate, and stable-employment percentage? A property-management company in the area should have these aggregated.
- How much new for-sale + rental construction is in the pipeline within 1–3 miles? Heavy new supply typically softens prices + rents 12–24 months out; constrained supply supports both.
Investment metrics
- 1% rule
- 3.10% ✓
- Cap rate
- 27.23%
- Cash-on-cash
- 74.78%
- DSCR
- 4.33
- GRM
- 2.7
CMA / ARV
- ARV (median comp)
- $72,081
- List price
- $45,000
- Delta
- -37.57%
- Verdict
- UNDERPRICED
- Comps
- 20 within 1.0 mi
Show comp detail 4 sales within ~0.75 mi
| Address | Dist | Beds/Ba | Sqft | Sold | Price | $/sf | Match |
|---|---|---|---|---|---|---|---|
| 1101 Carlyon Rd | 0.14mi | 4/1.5 (+1) | 1,570 (+2%) | 21mo | $79,900 | $51 | 65 |
| 13411 6th Ave | 0.67mi | 4/1.0 (+1) | 1,468 (-4%) | 9mo | $113,000 | $77 | 49 |
| 1863 Woodlawn Ave | 0.73mi | 3/2.5 | 1,688 (+10%) | 3mo | $399,900 | $237 | 41 |
| 1855 Woodlawn Ave | 0.72mi | 3/2.5 | 1,688 (+10%) | 6mo | $399,900 | $237 | 39 |
Match score weights: distance 35% · size 25% · config 20% · recency 20%. Top-matched comps best support the ARV.
Projected returns pro-forma
-3.0% appreciation · 5.16% rent growth · sell at horizon
- IRR
- 77.1%
- Equity multiple
- 4.64×
- Total profit
- $45,833
- Equity at exit
- $6,710
- IRR
- 81.3%
- Equity multiple
- 10.34×
- Total profit
- $117,674
- Equity at exit
- $3,891
Cash invested: $12,600 (down + closing). Projections, not guarantees.
Landlord ↔ Tenant lean methodology
- Overall (STATE)
- 73 Landlord-Friendly
- State Ohio
- 73 Landlord-Friendly · R+6
- County
- — inherits STATE
- City
- — inherits STATE
ZIP-level market 44112
- Rents YoY
- 5.2%
- Active inventory
- 99
- Price-to-rent
- 2.7×
Monthly cashflow live
- Estimated rent
- $1,394 high interval (Pro) →
- Mortgage (P&I)
- −$236
- Tax from tax record
- −$61 /mo · $738/yr
- Insurance
- −$19
- HOA
- −$0
- Vacancy / Maint / Mgmt
- −$293
- Net cashflow
- $785
Break-even live
UW: 25.0% down · 7.5% · 30yr · 1.5% tax · 5.0% vac · 8.0% maint · 8.0% mgmt
Financing live
Cash to close
- Down payment
- $11,250
- Closing costs
- $1,350
- Reserves months
- —
- Total cash needed
- —
Loan-product check · same deal, 3 products live
Conventional
25% down · 7.5% · 30yr
- Down + closing
- —
- Monthly P&I
- —
- Monthly cashflow
- —
- DSCR
- —
- Eligible?
- —
Personal DTI + credit; lowest rate.
DSCR
20% down · 8.5% · 30yr
- Down + closing
- —
- Monthly P&I
- —
- Monthly cashflow
- —
- DSCR
- —
- Eligible?
- —
No personal income docs; deal must DSCR.
Hard money
10% down · 12.0% · 12mo
- Down + closing
- —
- Monthly P&I
- —
- Monthly cashflow
- —
- DSCR
- —
- Eligible?
- —
Short-term bridge; refi at stabilization.
Rent comps 39 comps
| Address | Beds | Baths | Sqft | Rent | $/sqft | DOM | Units | Dist |
|---|---|---|---|---|---|---|---|---|
| 14120 Superior Ave Unit 1 East Cleveland, OH | 3.0 | 1.0 | 1400 | $1,350 | $0.96 | 10d | 1 | 0.50mi |
| 14120 Superior Ave Unit 4 East Cleveland, OH | 3.0 | 1.0 | 1408 | $1,350 | $0.96 | 43d | 1 | 0.50mi |
| 12819 Edmonton Ave Cleveland, OH | 4.0 | 1.0 | 1423 | $1,795 | $1.26 | 16d | 1 | 0.61mi |
| 12511 Euclid Ave Cleveland, OH | 2.0 | 2.5 | 1300 | $1,400 | $1.08 | 43d | 1 | 0.70mi |
| 14009 Mayfair Ave Unit 2 East Cleveland, OH | 4.0 | 2.0 | 1144 | $1,390 | $1.22 | 43d | 1 | 0.79mi |
| 14005 Scioto Ave Cleveland, OH | 3.0 | 1.0 | 1056 | $1,570 | $1.49 | 16d | 1 | 0.82mi |
| 13900 Potomac Ave Cleveland, OH | 3.0 | 1.0 | 1172 | $1,355 | $1.16 | 23d | 1 | 0.84mi |
| 14200 Scioto Ave Cleveland, OH | 3.0 | 1.0 | 1256 | $1,350 | $1.07 | 16d | 1 | 0.84mi |
| 13438 Hartford Rd East Cleveland, OH | 2.0 | 1.0 | 1920 | $1,200 | $0.62 | 43d | 1 | 0.85mi |
| 1459 E 134th St Unit up East Cleveland, OH | 2.0 | 1.0 | 1150 | $850 | $0.74 | 10d | 1 | 0.89mi |
| 14312 Scioto Ave Cleveland, OH | 3.0 | 1.0 | 1090 | $1,300 | $1.19 | 4d | 1 | 0.89mi |
| 14205 Savannah Ave Cleveland, OH | 3.0 | 1.0 | 1160 | $1,350 | $1.16 | 16d | 1 | 0.96mi |
| 651 E 115th St Cleveland, OH | 4.0 | 2.0 | 1550 | $1,800 | $1.16 | 21d | 1 | 0.97mi |
| 1862 E 123rd St Cleveland, OH | 2.0 | 1.0–2.0 | 1107 | $2,999 | $2.71 | 1d | 17 | 1.04mi |
| 571 E 115th St Cleveland, OH | 4.0 | 2.0 | 2220 | $1,808 | $0.81 | 16d | 1 | 1.11mi |
| 1545 Glenmont Rd Unit 1 East Cleveland, OH | 2.0 | 1.0 | 1428 | $800 | $0.56 | 23d | 1 | 1.12mi |
| 1641 Coventry Rd Cleveland, OH | 3.0 | 1.0 | 1848 | $1,200 | $0.65 | 16d | 1 | 1.18mi |
| 2827 Avondale Ave Apt 2 Cleveland Heights, OH | 3.0 | 1.0 | 1680 | $1,275 | $0.76 | 23d | 1 | 1.20mi |
| 14120 Superior Rd Cleveland, OH | 3.0 | 1.0 | 1390 | $1,400 | $1.01 | 43d | 1 | 1.22mi |
| 11471 Euclid Ave Cleveland, OH | 2.0 | 1.0–2.0 | 905 | $2,645 | $2.92 | 3d | 38 | 1.23mi |
| 11420 Hessler Rd Cleveland, OH | 1.0–3.0 | 1.0 | 969 | $2,265 | $2.34 | 16d | 2 | 1.23mi |
| 11350 Hessler Rd Cleveland, OH | 3.0 | 1.0 | 1300 | $2,265 | $1.74 | 7d | 1 | 1.24mi |
| 12314 Mayfield Rd Cleveland, OH | 3.0 | 2.5 | 2033 | $3,859 | $1.90 | 3d | 9 | 1.27mi |
| 1695 Glenmont Rd Unit 1695 Glenmont Lower Cleveland Heights, OH | 3.0 | 1.0 | 1336 | $1,435 | $1.07 | 7d | 1 | 1.29mi |
| 1695 Glenmont Rd Unit Lower Cleveland Heights, OH | 3.0 | 1.0 | 1336 | $1,435 | $1.07 | 23d | 1 | 1.29mi |
| 1633 Eddington Rd Unit 1 Cleveland Heights, OH | 3.0 | 1.0 | 1538 | $1,100 | $0.72 | 23d | 1 | 1.31mi |
| 1605 Hillcrest Rd Cleveland, OH | 2.0 | 1.0 | 1180 | $1,245 | $1.06 | 16d | 1 | 1.32mi |
| 14172 Superior Rd Unit 1 Cleveland Heights, OH | 3.0 | 1.0 | 1446 | $1,295 | $0.90 | 23d | 1 | 1.36mi |
| 14172 Superior Rd Unit 2 Cleveland Heights, OH | 2.0 | 1.0 | 1446 | $1,195 | $0.83 | 23d | 1 | 1.36mi |
| 2472 Overlook Rd #3 Cleveland, OH | 2.0 | 1.0 | 1106 | $1,850 | $1.67 | 16d | 1 | 1.37mi |
| 2583 Overlook Rd Cleveland Heights, OH | 1.0–2.0 | 1.0 | 1004 | $1,250 | $1.24 | 23d | 2 | 1.41mi |
| 2878 Mayfield Rd Cleveland Heights, OH | 1.0–2.0 | 1.0 | 1060 | $1,275 | $1.20 | 23d | 1 | 1.41mi |
| 15801 Hazel Rd Cleveland, OH | 3.0 | 1.5 | 1908 | $1,550 | $0.81 | 16d | 1 | 1.41mi |
| 2580 Overlook Rd Cleveland, OH | 3.0 | 1.0–2.0 | 1125 | $1,740 | $1.55 | 1d | 12 | 1.44mi |
| 14813 Alder Ave Cleveland, OH | 3.0 | 1.0 | 1188 | $1,150 | $0.97 | 23d | 1 | 1.47mi |
| 2764 Lancashire Rd Cleveland, OH | 2.0 | 2.0 | 1750 | $1,545 | $0.88 | 23d | 1 | 1.48mi |
| 2772 Lancashire Rd Cleveland, OH | 3.0 | 1.0 | 1295 | $1,400 | $1.08 | 7d | 2 | 1.48mi |
| 2772 Lancashire Rd Unit 1 Cleveland Heights, OH | 3.0 | 1.0 | 1295 | $1,400 | $1.08 | 23d | 1 | 1.48mi |
| 2729 Euclid Heights Blvd Apt 4 Cleveland, OH | 3.0 | 1.0 | 1400 | $1,500 | $1.07 | 23d | 1 | 1.49mi |
Listing history 16 events
-
2026-06-18days on market $45,000 Active 50 DOM
-
2026-06-17days on market $45,000 Active 49 DOM
-
2026-06-16days on market $45,000 Active 48 DOM
-
2026-06-15days on market $45,000 Active 47 DOM
-
2026-06-13days on market $45,000 Active 45 DOM
-
2026-06-13days on market $45,000 Active 44 DOM
-
2026-06-09days on market $45,000 Active 41 DOM
-
2026-06-08days on market $45,000 Active 40 DOM
-
2026-06-07days on market $45,000 Active 39 DOM
-
2026-06-05days on market $45,000 Active 36 DOM
-
2026-06-03days on market $45,000 Active 35 DOM
-
2026-06-02days on market $45,000 Active 34 DOM
-
2026-06-01pricedays on market $45,000 Active 33 DOM
-
2026-05-31days on market $50,000 Active 32 DOM
-
2026-04-29$50,000 Active 2048-char remark
-
1977-06-01soldstatus $20,500
ⓘ Source: listings_history table (triggers on properties + properties_extension) + one-shot
backfill from property_details.listing_events for pre-trigger history.
Tax reassessment forecast OH · Partial reset (capped growth)
- Current annual tax
- $738 · $61/mo
- Projected year-2 tax
- $738 · $61/mo
- Expected delta
- $0/yr ($0/mo · 0.0%)
ⓘ Screening estimate from a state-policy table — verify with the county assessor before closing.
Climate risk First Street
- Flood 1/10 Low FEMA zone X (unshaded) · 0% chance over 30 yrs
- Wildfire 1/10 Low
- Heat 3/10 Moderate 7 d/yr ≥95°F today · 17 d/yr by 30 yrs out
- Wind 1/10 Low
- Air quality 3/10 Moderate 3 unhealthy d/yr today · 5 by 30 yrs out
Nearby sold comps map
Loading sold comps map…
Walkable amenities ~0.75 mi
Loading nearby amenities…
Taxation est. · year 1
- Rental income
- $16,729
- − Mortgage interest
- −$2,521
- − Property taxes
- −$738
- − Insurance
- −$225
- − Repairs & maintenance
- −$1,338
- − Management
- −$1,338
- − Depreciation
- −$1,309
- Taxable income
- $9,260
- Est. tax owed @ 24.0%
- −$2,222
- After-tax cash flow
- $7,199/yr
For passive investors: Depreciation is non-cash, so a rental often shows a tax loss while cash-flowing — sheltering income. Rental losses are passive: they offset passive income freely, and up to $25,000/yr can offset ordinary (W-2) income if you actively participate and your MAGI is under $100k (phasing out to $0 by $150k); unused losses carry forward. On sale, claimed depreciation is recaptured at up to 25%, and gains may owe capital-gains tax (a 1031 exchange can defer both). Figures are a year-1 estimate at your 24.0% rate — not tax advice; consult a CPA.
Schools (NCES district)
- District
- East Cleveland City School District
- NCES district ID
- 3904390
- Math proficiency
- 4% ▼ -16.00%
- Reading proficiency
- 17% ▼ -13.00%
- Median HH income
- $22,726
- Composite
- 7.38/100
- National rank
- #9954
- State rank
- #652 of 656 in OH
Livability — East Cleveland
- Score
- 66/100
- State rank
- #650
- US rank
- #11510
Category grades
Schools grade is shown separately in the Schools card above.
Census & demographics
- Census place
- East Cleveland, OH
- County
- Cuyahoga County · 1,090,369 people
- City population
- 17,848
- Metro
- Cleveland-Elyria, OH
- Population (ZIP)
- 17,848
- Household income
- $28,799
- Rent vs Own
- Severe rent burden
- 1702.0
Population outlook (Cuyahoga County) Hauer SSP2
- Today (2025)
- 1,244,621 people
- By 2030
- 1,230,093 · -1.2%
- By 2040
- 1,189,108 · -4.5%
- By 2050
- 1,145,706 · -7.9%
- By 2075
- 1,076,557 · -13.5%
- By 2100
- 978,987 · -21.3%
Race, ethnicity, and origin ACS 2023
- Neighborhood character
- Predominantly Black (89%)
- Race & ethnicity
- Black 89% White 7% Two or more races 2% Hispanic / Latino 1%
- Common ancestry
- Lithuanian 1%
- Foreign-born
- 4% · Canada
- Languages at home
- 93% English-only · French/Haitian/Cajun 3% Spanish 2% Russian/Polish/Slavic 1%
Political lean MEDSL · Cuyahoga
- 2024 margin
- Solid D (+31.5) · D 65.4% · R 33.9%
- 2008→2024 swing
- -7.4pp toward R · 2008: 38.9pp · 2024: 31.5pp
- All cycles
- 2024: D+31.5 2020: D+34.1 2016: D+35.0 2012: D+38.7 2008: D+38.9
Not yet ingested
- Civics
- —
Market trends
- HPI YoY
- ▼ -115.61%
- Current HPI
- 67.2162
- Rent YoY
- ▲ 5.16%
- Metro
- Cleveland-Elyria, OH
- State GDP YoY
- ▲ 1.98%
- F500 in state
- 48
Industry mix (Fortune 500 HQ in OH)
| Industry | F500 HQs | Revenue |
|---|---|---|
| Insurance | 3 | $145B |
|
||
| Industrial Machinery | 3 | $49B |
|
||
| Financial Services | 3 | $24B |
|
||
| Consumer Goods | 2 | $93B |
|
||
| Aerospace / Defense | 2 | $47B |
|
||
| Utilities | 2 | $33B |
|
||
Price history
+119.5% since first listed3 events — show timeline
- 2026-06-01 Price Changed $45,000 MLSNOW
- 2026-04-29 Listed $50,000 MLSNOW
- 1977-06-01 Sold (Public Records) $20,500 Public Records
Property tax history
+0.5%/yrLatest (2025): $738 · -2.8% YoY. Source: county tax records.
Cash-flow waterfall
monthlySold comps — $/sqft
last 12 mo · ≤1 miLoading sold comps…