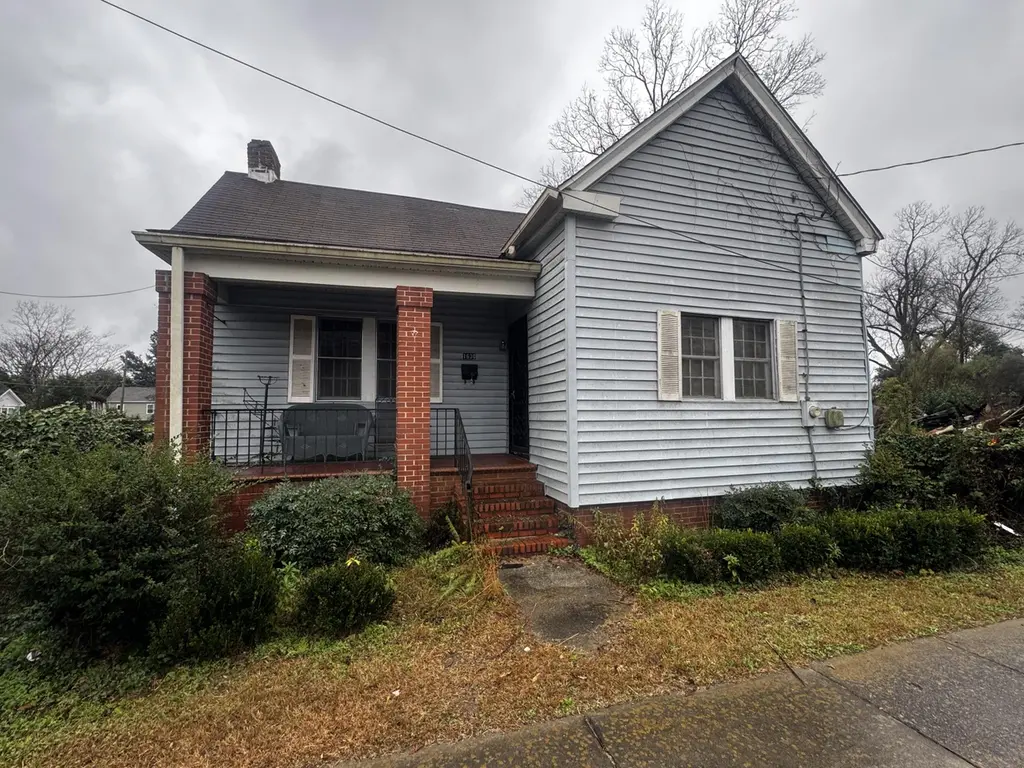
1630 Old Savannah Rd · Augusta-Richmond County consolidated government (balance), GA
Flood risk 1/10 · Minimal
- FEMA flood zone
- X (unshaded)
- Chance of flooding over 30 yrs
- 0.0%
- Est. flood insurance / yr
- $507 – $1,088
Fire risk 3/10 · Minor
- Est. fire insurance / yr
- $963 – $1,789
Heat risk 7/10 · Major
- Hot days now (above 108°F)
- 7 days/yr
- Hot days in 30 yrs
- 17 days/yr
Wind risk 6/10 · Moderate
- Chance of severe wind over 30 yrs
- 67.0%
Air-quality risk 4/10 · Minor
- Unhealthy air days now
- 4 days/yr
- Unhealthy air days in 30 yrs
- 4 days/yr
Risk factors via First Street. Map © Google.
Why this score? — see what drove the B+ grade
The composite is a weighted blend of 9 inputs, each scored 0–100. Each bar is that input's sub-score; the figure is the points it added to the 100-point composite (weight × sub-score).
- Cash flow +30.0/30.0
- 1% rule +10.0/10.0
- DSCR +10.0/10.0
- Appreciation +9.1/10.0
- ARV discount +7.5/15.0
- Livability +2.5/5.0
- Condition / age +2.5/5.0
- Rent growth +2.2/5.0
- Schools +1.3/10.0
$50,000
🖨 Deal sheet 📄 Offer letter ✓ Due diligence
Listing remarks
Perfect investment opportunity in a revitalization area. This property is being sold as is. Must fill out a Hold Harmless Agreement prior to viewing.
Key facts
- 4,792 sq ft lot
- Built 1906
- Listed 38 days
Property features AI
Finance
- Other: Directions: Take Old Savannah Rd. toward downtown Augusta; the house is on the right
- Financial info: Tax information provided (amount withheld from output)
- HOA & community: Association amenities: Other
Exterior
- Parking: Other parking
- Security: No security features listed
- Utilities: Public water; Public sewer
- Home design: Residential single-family home; Located in the Turpin Hill subdivision
- Construction: Wood siding construction; Crawl space / no basement
- Exterior features: Other roof; Other lot features
Interior
- Kitchen: Other appliances
- Bedrooms: 5 total rooms (includes all living spaces)
- Flooring: Wood
- Bathrooms: 1 full bathroom
- Heating & cooling: Has cooling; Other cooling
- Interior features: Wood flooring; Other interior features
- Laundry & utility: Washer/dryer information not provided
Neighborhood map
What this means for you Summary
Snapshot
- This is a 3-bed/1.0-bath single-family listed at $50k.
Deal economics
- At list price, monthly cash flow is $907 ($11k/yr) — positive.
- The deal already cash-flows at list — no discount required.
- Meets the 1% rule at list price ($2k rent vs $50k).
- Recommended offer: $48k (3.0% below list) — sets the bar for market timing.
- Cap rate 28.1% vs local median 5.3% in Augusta-Richmond County consolidated government (balance) — top-decile yield for the area; either an underpriced asset or a hidden risk that comps aren't pricing in. Stress-test before assuming the spread holds.
Location & tenants
- Location reads: area grade B — affects rentability + tenant quality, not the cash-flow math above.
- Richmond County (urban): math 12% / reading 20% proficiency, ranked #154 of 174 in GA (top 88%) — low school quality limits family demand, transient renter base, plan for 1-2y turnover; 72% free/reduced lunch — lower-income household profile, screen leases tightly.
- Zoned schools: Langford Middle School (math 2% / reading 14%, grade F, #445 of 470 statewide, top 95%, 731 students, 98% FRL) — zoned schools average 98% FRL vs 72% district-wide (26 pts higher); higher-poverty schools than district average — tighter screening recommended.
- Market conditions: Rents soft (-1.3%/yr); 129 active listings in the ZIP; 12 comparable units currently listed for rent nearby; rentals at typical pace (median 24d on market — plan ~3-4 weeks tenant-placement turnaround); 42% of comp listings sitting > 30 days — soft ceiling on asking rent; lower-income renter base — watch delinquency; 561 units permitted in Richmond County in 2024 (0 in 5+ unit buildings).
Forward outlook
- In year one you build about $4k of equity ($346 loan paydown + $4k appreciation (8.2% local appreciation)).
- Richmond County population projected to shrink 5% by 2050 — rents likely to lag national; underwrite the cash flow, not the appreciation.
- At projected returns (8.2% appreciation + 0.0% rent growth), your $14k cash investment doubles in ~1 year — after that, you're playing with house money.
- By year 7, paydown + projected appreciation supports a ~$31k cash-out refi (75% LTV) — recoverable capital for the next deal without selling this one.
Negotiation context
- It's been on market 38 days — a 3% lower offer ($48k) is reasonable based on typical stale-listing flexibility.
- 2 sale attempts with the ask held roughly flat each time — persistent listings suggest the price (not the market) is what's stuck; bring a comps-based counter.
Risks & watch-outs
- Watch-outs: built in 1906 — expect roof / HVAC / electrical / plumbing capex.
- Climate carrying-cost: major wind risk, 67% chance of damaging wind over 30y; extreme-heat days projected 7→17/yr by 2055 (HVAC capex compounding) — expect insurance premiums to compound above CPI over the hold.
Questions for the listing agent
- It's been on market 38 days. Have you received any prior offers? Is the seller open to a 3% concession, seller financing, or rate buy-down credit?
- Built in 1906 — when were the roof, HVAC, electrical panel, plumbing, and water heater last replaced?
- Is there a deadline driving the sale (1031 exchange, divorce, estate, relocation)? That informs how much negotiation room exists.
- What's the average days-on-market for RENTAL listings here right now (not sales)? A rising rental-DOM trend means longer vacancies and softer asking-rent achievability than the comps imply.
- What's the recent tenant-quality profile in this submarket — average credit score on applications, eviction rate, late-payment / NSF rate, and stable-employment percentage? A property-management company in the area should have these aggregated.
- How much new for-sale + rental construction is in the pipeline within 1–3 miles? Heavy new supply typically softens prices + rents 12–24 months out; constrained supply supports both.
Investment metrics
- 1% rule
- 3.21% ✓
- Cap rate
- 28.07%
- Cash-on-cash
- 77.77%
- DSCR
- 4.46
- GRM
- 2.6
CMA / ARV
- ARV (median comp)
- $133,744
- List price
- $50,000
- Delta
- -62.62%
- Verdict
- UNDERPRICED
- Comps
- 20 within 1.0 mi
Show comp detail 12 sales within ~0.75 mi
| Address | Dist | Beds/Ba | Sqft | Sold | Price | $/sf | Match |
|---|---|---|---|---|---|---|---|
| 1150 Roselle St | 0.35mi | 3/2.0 | 1,222 (-4%) | 4mo | $140,000 | $115 | 69 |
| 1421 1/2 Picquet Ave | 0.25mi | 3/1.0 | 1,188 (-7%) | 10mo | $95,000 | $80 | 69 |
| 1147 Mercier St | 0.26mi | 4/1.0 (+1) | 1,316 (+3%) | 10mo | $42,000 | $32 | 69 |
| 1761 Old Savannah Rd | 0.33mi | 3/2.0 | 1,170 (-8%) | 2mo | $150,000 | $128 | 66 |
| 1426 Twiggs St | 0.29mi | 3/2.0 | 1,445 (+14%) | 1mo | $210,000 | $145 | 59 |
| 1431 Perry St | 0.66mi | 3/1.5 | 1,269 (-0%) | 10mo | $110,000 | $87 | 58 |
| 1757 Old Savannah Rd | 0.31mi | 3/2.0 | 1,148 (-10%) | 17mo | $174,000 | $152 | 51 |
| 919 Wrightsboro Rd | 0.35mi | 4/2.0 (+1) | 1,361 (+7%) | 16mo | $115,000 | $84 | 50 |
| 1408 Holley St | 0.70mi | 3/2.0 | 1,181 (-7%) | 4mo | $160,000 | $135 | 48 |
| 1335 Conklin Ave | 0.54mi | 3/2.0 | 1,200 (-6%) | 16mo | $145,000 | $121 | 48 |
| 1230 Swanee Quintet Blvd | 0.69mi | 4/2.0 (+1) | 1,300 (+2%) | 10mo | $54,000 | $42 | 47 |
| 1435 Perry Ave | 0.67mi | 3/2.0 | 1,303 (+2%) | 19mo | $145,000 | $111 | 45 |
Match score weights: distance 35% · size 25% · config 20% · recency 20%. Top-matched comps best support the ARV.
Projected returns pro-forma
8.18% appreciation · 0.0% rent growth · sell at horizon
- IRR
- 83.6%
- Equity multiple
- 6.31×
- Total profit
- $74,292
- Equity at exit
- $38,601
- IRR
- 78.5%
- Equity multiple
- 12.72×
- Total profit
- $164,088
- Equity at exit
- $77,217
Cash invested: $14,000 (down + closing). Projections, not guarantees.
Landlord ↔ Tenant lean methodology
- Overall (STATE)
- 90 Strongly Landlord-Friendly
- State Georgia
- 90 Strongly Landlord-Friendly · R+3
- County
- — inherits STATE
- City
- — inherits STATE
ZIP-level market 30901
- Home prices YoY
- 4.1%
- Rents YoY
- -1.3%
- Active inventory
- 129
- Price-to-rent
- 2.6×
Monthly cashflow live
- Estimated rent
- $1,605 high interval (Pro) →
- Mortgage (P&I)
- −$262
- Tax from tax record
- −$77 /mo · $930/yr
- Insurance
- −$21
- HOA
- −$0
- Vacancy / Maint / Mgmt
- −$337
- Net cashflow
- $907
Break-even live
UW: 25.0% down · 7.5% · 30yr · 1.5% tax · 5.0% vac · 8.0% maint · 8.0% mgmt
Financing live
Cash to close
- Down payment
- $12,500
- Closing costs
- $1,500
- Reserves months
- —
- Total cash needed
- —
Loan-product check · same deal, 3 products live
Conventional
25% down · 7.5% · 30yr
- Down + closing
- —
- Monthly P&I
- —
- Monthly cashflow
- —
- DSCR
- —
- Eligible?
- —
Personal DTI + credit; lowest rate.
DSCR
20% down · 8.5% · 30yr
- Down + closing
- —
- Monthly P&I
- —
- Monthly cashflow
- —
- DSCR
- —
- Eligible?
- —
No personal income docs; deal must DSCR.
Hard money
10% down · 12.0% · 12mo
- Down + closing
- —
- Monthly P&I
- —
- Monthly cashflow
- —
- DSCR
- —
- Eligible?
- —
Short-term bridge; refi at stabilization.
Rent comps 12 comps
| Address | Beds | Baths | Sqft | Rent | $/sqft | DOM | Units | Dist |
|---|---|---|---|---|---|---|---|---|
| 26 Sherman St Augusta, GA | 3.0 | 2.0 | 1720 | $1,900 | $1.10 | 43d | 1 | 0.06mi |
| 1016 Laney Walker Blvd Augusta, GA | 2.0 | 1.0 | 885 | $935 | $1.06 | 43d | 5 | 0.59mi |
| 1016 Laney Walker Blvd Augusta, GA | 1.0–2.0 | 1.0 | 794 | $995 | $1.25 | 23d | 4 | 0.59mi |
| 1425 Lee Beard Way Augusta, GA | 1.0–2.0 | 1.0 | 776 | $1,181 | $1.52 | 43d | 1 | 0.82mi |
| 1480 Wrightsboro Rd Augusta, GA | 1.0–3.0 | 1.0–2.0 | 1046 | $2,375 | $2.27 | 21d | 13 | 0.95mi |
| 2128 Grand Blvd Augusta, GA | 3.0 | 1.0 | 1150 | $1,150 | $1.00 | 43d | 1 | 1.00mi |
| 1399 Walton Way Augusta, GA | 2.0 | 2.0 | 1017 | $1,690 | $1.66 | 23d | 1 | 1.23mi |
| 1712 Morgan St Augusta, GA | 3.0 | 1.0 | 1209 | $1,330 | $1.10 | 23d | 1 | 1.23mi |
| 913 Walker St Augusta, GA | 2.0 | 2.0 | 1000 | $1,200 | $1.20 | 14d | 1 | 1.25mi |
| 505 13th St Augusta, GA | 2.0 | 2.0 | 950 | $1,122 | $1.18 | 43d | 3 | 1.34mi |
| 1812 Slaton St Augusta, GA | 2.0 | 2.0 | 1615 | $1,665 | $1.03 | 23d | 10 | 1.37mi |
| 1315 Merry St Augusta, GA | 3.0 | 2.0 | 1610 | $1,450 | $0.90 | 23d | 1 | 1.48mi |
Listing history 18 events
-
2026-06-18days on market $50,000 Active 38 DOM
-
2026-06-17days on market $50,000 Active 37 DOM
-
2026-06-16days on market $50,000 Active 36 DOM
-
2026-06-15days on market $50,000 Active 35 DOM
-
2026-06-14days on market $50,000 Active 33 DOM
-
2026-06-10days on market $50,000 Active 30 DOM
-
2026-06-09days on market $50,000 Active 29 DOM
-
2026-06-08days on market $50,000 Active 28 DOM
-
2026-06-07days on market $50,000 Active 27 DOM
-
2026-06-03days on market $50,000 Active 23 DOM
-
2026-06-02days on market $50,000 Active 22 DOM
-
2026-06-01days on market $50,000 Active 21 DOM
-
2026-05-31days on market $50,000 Active 20 DOM
-
2026-05-30days on market $50,000 Active 19 DOM
-
2026-05-11historical
-
2026-03-17price $50,000
-
2026-01-03$60,000 Active
-
2026-01-03$50,000 Active 149-char remark
ⓘ Source: listings_history table (triggers on properties + properties_extension) + one-shot
backfill from property_details.listing_events for pre-trigger history.
Tax reassessment forecast GA · Resets to sale price
- Current annual tax
- $930 · $77/mo
- Projected year-2 tax
- $930 · $77/mo
- Expected delta
- $0/yr ($0/mo · 0.0%)
ⓘ Screening estimate from a state-policy table — verify with the county assessor before closing.
Climate risk First Street
- Flood 1/10 Low FEMA zone X (unshaded) · 0% chance over 30 yrs
- Wildfire 3/10 Moderate
- Heat 7/10 Severe 7 d/yr ≥108°F today · 17 d/yr by 30 yrs out
- Wind 6/10 Major 67% chance of damaging wind over 30 yrs
- Air quality 4/10 Moderate 4 unhealthy d/yr today · 4 by 30 yrs out
Nearby sold comps map
Loading sold comps map…
Walkable amenities ~0.75 mi
Loading nearby amenities…
Taxation est. · year 1
- Rental income
- $19,258
- − Mortgage interest
- −$2,801
- − Property taxes
- −$930
- − Insurance
- −$250
- − Repairs & maintenance
- −$1,541
- − Management
- −$1,541
- − Depreciation
- −$1,455
- Taxable income
- $10,742
- Est. tax owed @ 24.0%
- −$2,578
- After-tax cash flow
- $8,310/yr
For passive investors: Depreciation is non-cash, so a rental often shows a tax loss while cash-flowing — sheltering income. Rental losses are passive: they offset passive income freely, and up to $25,000/yr can offset ordinary (W-2) income if you actively participate and your MAGI is under $100k (phasing out to $0 by $150k); unused losses carry forward. On sale, claimed depreciation is recaptured at up to 25%, and gains may owe capital-gains tax (a 1031 exchange can defer both). Figures are a year-1 estimate at your 24.0% rate — not tax advice; consult a CPA.
Schools (NCES district)
- District
- Richmond County
- NCES district ID
- 1304380
- Math proficiency
- 12% ▼ -9.00%
- Reading proficiency
- 20% ▼ -6.00%
- Median HH income
- $38,069
- Composite
- 13.43/100
- National rank
- #9524
- State rank
- #154 of 174 in GA
Livability — Augusta-Richmond County consolidated government (balance)
No livability data for this city. (Only ~50 U.S. cities are tracked.)
Census & demographics
- Census place
- Augusta-Richmond County consolidated government (balance), GA
- County
- Richmond County · 190,917 people
- City population
- 154,035
- Metro
- Augusta-Richmond County, GA-SC
- Population (ZIP)
- 16,484
- Household income
- $25,163
- Rent vs Own
- Severe rent burden
- 2063.0
Population outlook (Richmond County) Hauer SSP2
- Today (2025)
- 200,753 people
- By 2030
- 200,232 · -0.3%
- By 2040
- 196,813 · -2.0%
- By 2050
- 190,347 · -5.2%
- By 2075
- 172,496 · -14.1%
- By 2100
- 146,284 · -27.1%
Race, ethnicity, and origin ACS 2023
- Neighborhood character
- Predominantly Black (78%)
- Race & ethnicity
- Black 78% White 15% Two or more races 4% Hispanic / Latino 2%
- Common ancestry
- Lithuanian 1% Slovak 1%
- Foreign-born
- 1% · Canada
- Languages at home
- 97% English-only · Spanish 1%
Political lean MEDSL · Richmond
- 2024 margin
- Solid D (+36.1) · D 67.8% · R 31.7%
- 2008→2024 swing
- +4.3pp toward D · 2008: 31.8pp · 2024: 36.1pp
- All cycles
- 2024: D+36.1 2020: D+37.2 2016: D+32.4 2012: D+33.8 2008: D+31.8
Not yet ingested
- Civics
- —
Market trends
- HPI YoY
- ▲ 8.18%
- Current HPI
- 206.3145
- Rent YoY
- ▼ -1.31%
- Metro
- Augusta-Richmond County, GA-SC
- State GDP YoY
- ▲ 2.66%
- F500 in state
- 28
Industry mix (Fortune 500 HQ in GA)
| Industry | F500 HQs | Revenue |
|---|---|---|
| Paper / Packaging | 2 | $29B |
|
||
| Retail | 1 | $160B |
|
||
| Transportation / Logistics | 1 | $91B |
|
||
| Airlines | 1 | $62B |
|
||
| Consumer Goods | 1 | $47B |
|
||
| Utilities | 1 | $25B |
|
||
Price history
-16.7% since first listed4 events — show timeline
- 2026-05-11 Listing Removed — Hive MLS
- 2026-03-17 Price Changed $50,000 Hive MLS
- 2026-01-03 Listed $50,000 Hive MLS
- 2026-01-03 Listed $60,000 Hive MLS
Property tax history
+10.5%/yrLatest (2025): $930 · +13.2% YoY. Source: county tax records.
Cash-flow waterfall
monthlySold comps — $/sqft
last 12 mo · ≤1 miLoading sold comps…