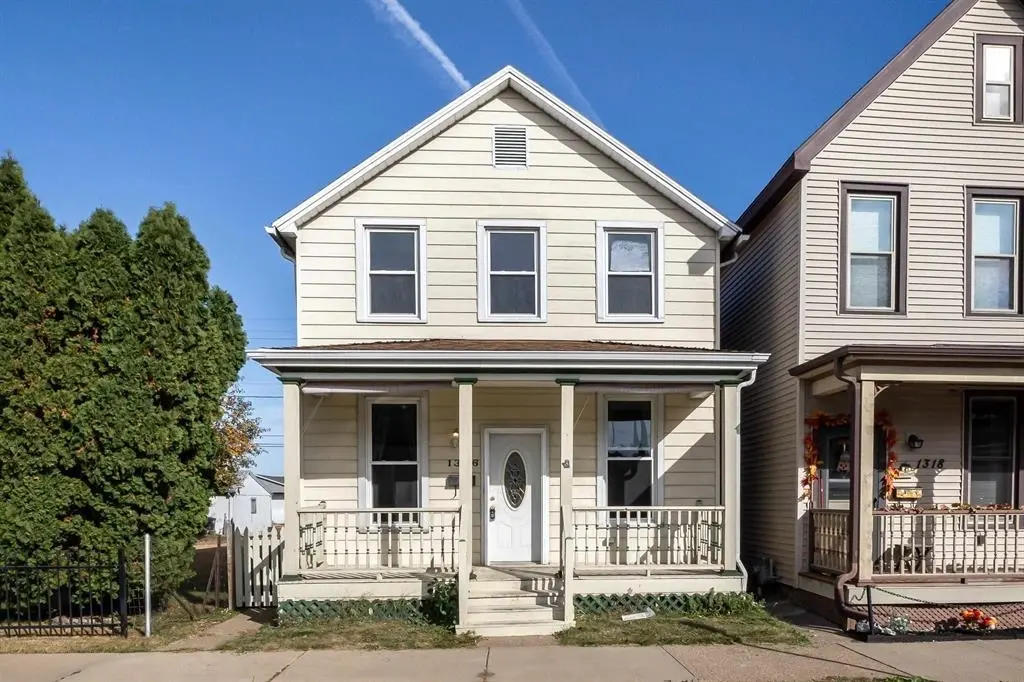
1326 Elm St · Dubuque, IA
Flood risk 8/10 · Major
- FEMA flood zone
- X
- Chance of flooding over 30 yrs
- 0.99%
- Est. flood insurance / yr
- $473 – $860
Fire risk 1/10 · Minimal
- Est. fire insurance / yr
- $902 – $1,676
Heat risk 3/10 · Minor
- Hot days now (above 102°F)
- 7 days/yr
- Hot days in 30 yrs
- 15 days/yr
Wind risk 2/10 · Minimal
- Chance of severe wind over 30 yrs
- —
Air-quality risk 2/10 · Minimal
- Unhealthy air days now
- 1 days/yr
- Unhealthy air days in 30 yrs
- 2 days/yr
Risk factors via First Street. Map © Google.
Why this score? — see what drove the B- grade
The composite is a weighted blend of 9 inputs, each scored 0–100. Each bar is that input's sub-score; the figure is the points it added to the 100-point composite (weight × sub-score).
- Cash flow +25.2/30.0
- ARV discount +13.1/15.0
- DSCR +8.3/10.0
- 1% rule +6.3/10.0
- Schools +5.5/10.0
- Livability +4.5/5.0
- Rent growth +3.9/5.0
- Condition / age +2.5/5.0
- Appreciation +0.0/10.0
$116,000
🖨 Deal sheet 📄 Offer letter ✓ Due diligence
Listing remarks MLS
Very nice home that has been well maintained and was updated in 2019 with newer flooring, an updated oak kitchen and updated baths. Includes 2 bedrooms, 1.5 baths, main floor laundry, and a level, fenced backyard with a deck. Ready to move into! * Rented - 24 hour notice to show.
Key facts
- Updated oak kitchen
- Newer flooring
- Main floor laundry
Tags
Neighborhood map
What this means for you Summary
Snapshot
- This is a 2-bed/1.5-bath single-family listed at $116k.
Deal economics
- At list price, monthly cash flow is $204 ($2k/yr) — positive.
- The deal already cash-flows at list — no discount required.
- Meets the 1% rule at list price ($1k rent vs $116k).
- Cap rate 9.0% vs local median 3.5% in Dubuque — top-decile yield for the area; either an underpriced asset or a hidden risk that comps aren't pricing in. Stress-test before assuming the spread holds.
Location & tenants
- Location reads 89/100 on livability (#7 in IA, #119 nationally) — a professional / high-income tenant draw. Strengths: amenities A+, commute A+, cost of living A+; Watch: crime C-.
- Dubuque Community School District (urban): math 63% / reading 65% proficiency, ranked #205 of 289 in IA (top 71%) — acceptable for families but not a draw, mixed tenant base, ~2y average lease.
- Market conditions: Rents rising fast (+5.6%/yr); 225 active listings in the ZIP; 8 comparable units currently listed for rent nearby; rentals lingering (median 44d on market — plan ~5-8 weeks vacancy on turnover, expect pricing pressure); 100% of comp listings sitting > 30 days — soft ceiling on asking rent; 473 units permitted in Dubuque County in 2024 (319 in 5+ unit buildings).
Forward outlook
- Local home prices are declining (-3.0%/yr); year-one equity from $802 of loan paydown is wiped out by about $3k of value loss. Plan a longer hold.
- Dubuque County population projected at +13% by 2050 — modest demand growth; plan on rents tracking national, not racing it.
- At projected returns (-3.0% appreciation + 5.6% rent growth), your $32k cash investment doubles in ~10 years — after that, you're playing with house money.
Negotiation context
- Only 11 days on market — expect competitive offers; lowballing is unlikely to land.
- 6 sale attempts since 7y ago with the ask held roughly flat each time — persistent listings suggest the price (not the market) is what's stuck; bring a comps-based counter.
- Current owner paid $70k; list at $116k implies a 66% gain — meaningful room to come down on a strong offer.
Risks & watch-outs
- Watch-outs: flood insurance adds $56/mo; built in 1890 — expect roof / HVAC / electrical / plumbing capex.
- Climate carrying-cost: severe flood risk — expect insurance premiums to compound above CPI over the hold.
Questions for the listing agent
- Built in 1890 — when were the roof, HVAC, electrical panel, plumbing, and water heater last replaced?
- What's the actual annual flood-insurance premium (NFIP or private), and is the property in a SFHA with mandatory coverage?
- Is there a deadline driving the sale (1031 exchange, divorce, estate, relocation)? That informs how much negotiation room exists.
- Schools are B-rated — typically a magnet for longer-tenancy family renters. What's the average tenant stay here, and is there a school-zone premium baked into asking?
- What's the average days-on-market for RENTAL listings here right now (not sales)? A rising rental-DOM trend means longer vacancies and softer asking-rent achievability than the comps imply.
- What's the recent tenant-quality profile in this submarket — average credit score on applications, eviction rate, late-payment / NSF rate, and stable-employment percentage? A property-management company in the area should have these aggregated.
- How much new for-sale + rental construction is in the pipeline within 1–3 miles? Heavy new supply typically softens prices + rents 12–24 months out; constrained supply supports both.
Investment metrics
- 1% rule
- 1.13% ✓
- Cap rate
- 8.98%
- Cash-on-cash
- 9.59%
- DSCR
- 1.43
- GRM
- 7.4
CMA / ARV
- ARV (median comp)
- $132,556
- List price
- $116,000
- Delta
- -12.49%
- Verdict
- UNDERPRICED
- Comps
- 20 within 1.0 mi
Show comp detail 12 sales within ~0.75 mi
| Address | Dist | Beds/Ba | Sqft | Sold | Price | $/sf | Match |
|---|---|---|---|---|---|---|---|
| 2243 White St | 0.65mi | 3/2.0 (+1) | 1,312 (+0%) | 1mo | $143,000 | $109 | 62 |
| 603 Arlington St | 0.62mi | 3/2.0 (+1) | 1,312 (+0%) | 7mo | $140,000 | $107 | 58 |
| 1970 N Main St | 0.52mi | 3/1.0 (+1) | 1,332 (+2%) | 10mo | $245,000 | $184 | 58 |
| 1906 Ellis St | 0.55mi | 3/1.0 (+1) | 1,344 (+3%) | 7mo | $25,000 | $19 | 57 |
| 328 Chappel Ct | 0.73mi | 2/1.5 | 1,176 (-10%) | 0mo | $150,000 | $128 | 49 |
| 455 Almond St | 0.64mi | 3/1.5 (+1) | 1,408 (+8%) | 6mo | $138,900 | $99 | 48 |
| 605 W 17th St | 0.70mi | 3/1.5 (+1) | 1,232 (-6%) | 9mo | $45,000 | $37 | 45 |
| 813 Rhomberg Ave | 0.71mi | 2/1.0 | 1,208 (-8%) | 11mo | $125,900 | $104 | 43 |
| 655 Regent St | 0.74mi | 3/1.0 (+1) | 1,176 (-10%) | 0mo | $64,000 | $54 | 41 |
| 2264 Francis St | 0.69mi | 3/1.0 (+1) | 1,392 (+6%) | 12mo | $115,000 | $83 | 40 |
| 600 Angella St | 0.72mi | 3/1.5 (+1) | 1,492 (+14%) | 1mo | $206,550 | $138 | 37 |
| 945 Spruce St | 0.69mi | 3/1.5 (+1) | 1,484 (+13%) | 7mo | $125,000 | $84 | 34 |
Match score weights: distance 35% · size 25% · config 20% · recency 20%. Top-matched comps best support the ARV.
Projected returns pro-forma
-3.0% appreciation · 5.63% rent growth · sell at horizon
- IRR
- -1.8%
- Equity multiple
- 0.93×
- Total profit
- $-2,219
- Equity at exit
- $17,296
- IRR
- 10.7%
- Equity multiple
- 1.93×
- Total profit
- $30,329
- Equity at exit
- $10,030
Cash invested: $32,480 (down + closing). Projections, not guarantees.
Landlord ↔ Tenant lean methodology
- Overall (STATE)
- 83 Strongly Landlord-Friendly
- State Iowa
- 83 Strongly Landlord-Friendly · R+6
- County
- — inherits STATE
- City
- — inherits STATE
ZIP-level market 52001
- Rents YoY
- 5.6%
- Active inventory
- 225
- Price-to-rent
- 7.4×
Monthly cashflow live
- Estimated rent
- $1,308 high interval (Pro) →
- Mortgage (P&I)
- −$608
- Tax from tax record
- −$117 /mo · $1,408/yr
- Insurance
- −$48
- Flood insurance flood zone
- −$56 /mo · $666/yr
- HOA
- −$0
- Vacancy / Maint / Mgmt
- −$275
- Net cashflow
- $204
Break-even live
UW: 25.0% down · 7.5% · 30yr · 1.5% tax · 5.0% vac · 8.0% maint · 8.0% mgmt
Financing live
Cash to close
- Down payment
- $29,000
- Closing costs
- $3,480
- Reserves months
- —
- Total cash needed
- —
Loan-product check · same deal, 3 products live
Conventional
25% down · 7.5% · 30yr
- Down + closing
- —
- Monthly P&I
- —
- Monthly cashflow
- —
- DSCR
- —
- Eligible?
- —
Personal DTI + credit; lowest rate.
DSCR
20% down · 8.5% · 30yr
- Down + closing
- —
- Monthly P&I
- —
- Monthly cashflow
- —
- DSCR
- —
- Eligible?
- —
No personal income docs; deal must DSCR.
Hard money
10% down · 12.0% · 12mo
- Down + closing
- —
- Monthly P&I
- —
- Monthly cashflow
- —
- DSCR
- —
- Eligible?
- —
Short-term bridge; refi at stabilization.
Rent comps 8 comps
| Address | Beds | Baths | Sqft | Rent | $/sqft | DOM | Units | Dist |
|---|---|---|---|---|---|---|---|---|
| 333 E 10th St Dubuque, IA | 2.0 | 2.0 | 1530 | $1,750 | $1.14 | 43d | 3 | 0.20mi |
| 1501 Central Ave Unit 1513-1 Dubuque, IA | 3.0 | 1.0 | 1374 | $1,175 | $0.86 | 43d | 1 | 0.28mi |
| 571 Jefferson St Unit 3 Dubuque, IA | 3.0 | 1.0 | 1000 | $1,300 | $1.30 | 43d | 1 | 0.64mi |
| 2418 Central Ave Unit 2 Dubuque, IA | 2.0 | 1.0 | 900 | $1,000 | $1.11 | 43d | 1 | 0.83mi |
| 703 Caledonia Pl Dubuque, IA | 3.0 | 1.0 | 1400 | $1,400 | $1.00 | 43d | 1 | 0.85mi |
| 520 Nevada St Unit 520-2 Dubuque, IA | 1.0 | 1.5 | 900 | $1,100 | $1.22 | 43d | 1 | 1.11mi |
| 980 Mount Pleasant St Unit 1 Dubuque, IA | 3.0 | 1.0 | 1236 | $1,150 | $0.93 | 43d | 1 | 1.20mi |
| 1742 Delhi St Dubuque, IA | 2.0 | 1.5 | 1534 | $1,300 | $0.85 | 43d | 1 | 1.49mi |
Listing history 18 events
-
2026-05-04status Pending 281-char remark
Show marketing remark (281 chars)
Very nice home that has been well maintained and was updated in 2019 with newer flooring, an updated oak kitchen and updated baths. Includes 2 bedrooms, 1.5 baths, main floor laundry, and a level, fenced backyard with a deck. Ready to move into! * Rented - 24 hour notice to show.
-
2026-04-22$116,000 Active 281-char remark
Show marketing remark (281 chars)
Very nice home that has been well maintained and was updated in 2019 with newer flooring, an updated oak kitchen and updated baths. Includes 2 bedrooms, 1.5 baths, main floor laundry, and a level, fenced backyard with a deck. Ready to move into! * Rented - 24 hour notice to show.
-
2025-09-29historical $1,200
-
2025-08-26price $1,200
-
2025-08-06$1,225
-
2025-04-26historical $1,225
-
2025-04-05price $1,225
-
2025-02-26price $1,350
-
2025-02-22$1,400
-
2024-11-21price $115,000
-
2024-11-08price $119,000
-
2024-10-25$121,000 Active
-
2024-04-15price $129,900
-
2024-03-28$137,500 Active
-
2019-11-14soldstatus $69,875
-
2019-11-08soldstatus $70,000
-
2019-08-23$77,000
-
2007-07-02soldstatus $55,100
ⓘ Source: listings_history table (triggers on properties + properties_extension) + one-shot
backfill from property_details.listing_events for pre-trigger history.
Tax reassessment forecast IA · Partial reset (capped growth)
- Current annual tax
- $1,408 · $117/mo
- Projected year-2 tax
- $1,615 · $135/mo
- Expected delta
- +$207/yr (+$17/mo · 14.7%)
ⓘ Screening estimate from a state-policy table — verify with the county assessor before closing.
Climate risk First Street
- Flood 8/10 Severe FEMA zone X · 99% chance over 30 yrs
- Wildfire 1/10 Low
- Heat 3/10 Moderate 7 d/yr ≥102°F today · 15 d/yr by 30 yrs out
- Wind 2/10 Low
- Air quality 2/10 Low 1 unhealthy d/yr today · 2 by 30 yrs out
Nearby sold comps map
Loading sold comps map…
Walkable amenities ~0.75 mi
Loading nearby amenities…
Taxation est. · year 1
- Rental income
- $15,698
- − Mortgage interest
- −$6,498
- − Property taxes
- −$1,408
- − Insurance
- −$1,246
- − Repairs & maintenance
- −$1,256
- − Management
- −$1,256
- − Depreciation
- −$3,375
- Taxable income
- $660
- Est. tax owed @ 24.0%
- −$158
- After-tax cash flow
- $2,289/yr
For passive investors: Depreciation is non-cash, so a rental often shows a tax loss while cash-flowing — sheltering income. Rental losses are passive: they offset passive income freely, and up to $25,000/yr can offset ordinary (W-2) income if you actively participate and your MAGI is under $100k (phasing out to $0 by $150k); unused losses carry forward. On sale, claimed depreciation is recaptured at up to 25%, and gains may owe capital-gains tax (a 1031 exchange can defer both). Figures are a year-1 estimate at your 24.0% rate — not tax advice; consult a CPA.
Schools (NCES district)
- District
- Dubuque Community School District
- NCES district ID
- 1909480
- Math proficiency
- 63% ▼ -7.00%
- Reading proficiency
- 65% ▼ -1.00%
- Median HH income
- $51,237
- Composite
- 54.51/100
- National rank
- #1345
- State rank
- #205 of 289 in IA
Livability — Dubuque
- Score
- 89/100
- State rank
- #7
- US rank
- #119
Category grades
Schools grade is shown separately in the Schools card above.
Census & demographics
- Census place
- Dubuque, IA
- County
- Dubuque County · 60,106 people
- City population
- 60,106
- Metro
- Dubuque, IA
- Population (ZIP)
- 43,101
- Household income
- $61,643
- Rent vs Own
- Severe rent burden
- 1940.0
Population outlook (Dubuque County) Hauer SSP2
- Today (2025)
- 103,359 people
- By 2030
- 106,472 · +3.0%
- By 2040
- 112,043 · +8.4%
- By 2050
- 116,553 · +12.8%
- By 2075
- 128,014 · +23.9%
- By 2100
- 132,892 · +28.6%
Race, ethnicity, and origin ACS 2023
- Neighborhood character
- Predominantly White (84%)
- Race & ethnicity
- White 84% Two or more races 6% Black 5% Hispanic / Latino 4% Asian 1% Pacific Islander 1%
- Common ancestry
- Portuguese 3% Italian 2% Lithuanian 2%
- Foreign-born
- 4% · Canada, China
- Languages at home
- 95% English-only · Spanish 3% Tagalog/Filipino 1% Other Asian/Pacific 1%
Political lean MEDSL · Dubuque
- 2024 margin
- Lean R (+8.6) · D 45.1% · R 53.7% · Other 1.2%
- 2008→2024 swing
- -29.4pp toward R · 2008: 20.8pp · 2024: -8.6pp
- All cycles
- 2024: R+8.6 2020: R+2.9 2016: R+1.2 2012: D+14.5 2008: D+20.8
Not yet ingested
- Civics
- —
Market trends
- HPI YoY
- ▼ -156.36%
- Current HPI
- 173.5536
- Rent YoY
- ▲ 5.63%
- Metro
- Dubuque, IA
- State GDP YoY
- ▲ 2.48%
- F500 in state
- 4
Industry mix (Fortune 500 HQ in IA)
| Industry | F500 HQs | Revenue |
|---|---|---|
| Financial Services | 1 | $16B |
|
||
| Retail / Convenience | 1 | $15B |
|
||
Price history
+110.5% since first listed18 events — show timeline
- 2026-05-04 Pending — ECIMLS
- 2026-04-22 Listed $116,000 ECIMLS
- 2025-09-29 Rental Removed $1,200 BUILDIUM
- 2025-08-26 Price Changed $1,200 BUILDIUM
- 2025-08-06 Listed for Rent $1,225 BUILDIUM
- 2025-04-26 Rental Removed $1,225 BUILDIUM
- 2025-04-05 Price Changed $1,225 BUILDIUM
- 2025-02-26 Price Changed $1,350 BUILDIUM
- 2025-02-22 Listed for Rent $1,400 BUILDIUM
- 2024-11-21 Price Changed $115,000 ECIMLS
- 2024-11-08 Price Changed $119,000 ECIMLS
- 2024-10-25 Listed $121,000 ECIMLS
- 2024-04-15 Price Changed $129,900 ECIMLS
- 2024-03-28 Listed $137,500 ECIMLS
- 2019-11-14 Sold (Public Records) $69,875 Public Records
- 2019-11-08 Sold (MLS) $70,000 ECIMLS
- 2019-08-23 Listed $77,000 ECIMLS
- 2007-07-02 Sold (Public Records) $55,100 Public Records
Property tax history
+5.4%/yrLatest (2025): $1,408 · +3.1% YoY. Source: county tax records.
Cash-flow waterfall
monthlySold comps — $/sqft
last 12 mo · ≤1 miLoading sold comps…