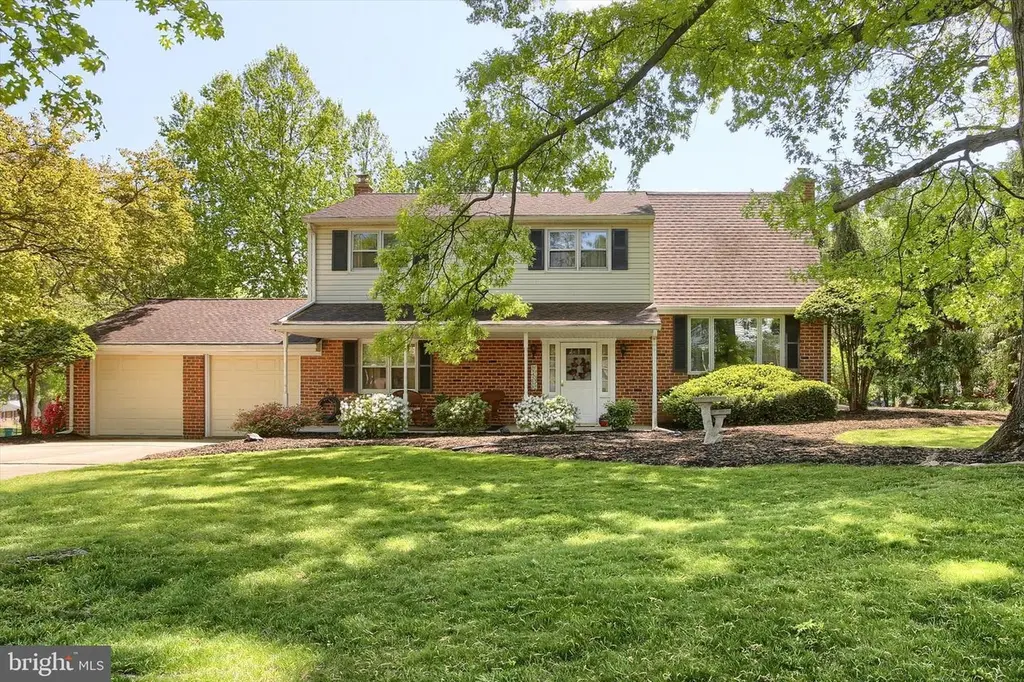
3906 Ridgeland Blvd · Camp Hill, PA
Flood risk 1/10 · Minimal
- FEMA flood zone
- X (unshaded)
- Chance of flooding over 30 yrs
- 0.0%
- Est. flood insurance / yr
- $507 – $1,088
Fire risk 1/10 · Minimal
- Est. fire insurance / yr
- $511 – $949
Heat risk 5/10 · Moderate
- Hot days now (above 100°F)
- 7 days/yr
- Hot days in 30 yrs
- 15 days/yr
Wind risk 3/10 · Minor
- Chance of severe wind over 30 yrs
- 6.0%
Air-quality risk 2/10 · Minimal
- Unhealthy air days now
- 1 days/yr
- Unhealthy air days in 30 yrs
- 3 days/yr
Risk factors via First Street. Map © Google.
Why this score? — see what drove the D grade
The composite is a weighted blend of 9 inputs, each scored 0–100. Each bar is that input's sub-score; the figure is the points it added to the 100-point composite (weight × sub-score).
- ARV discount +15.0/15.0
- Cash flow +7.1/30.0
- Schools +5.6/10.0
- Livability +4.7/5.0
- Rent growth +3.0/5.0
- Condition / age +2.5/5.0
- DSCR +1.3/10.0
- 1% rule +1.2/10.0
- Appreciation +0.0/10.0
$419,900
🖨 Deal sheet 📄 Offer letter ✓ Due diligence
Listing remarks
Welcome to 3906 Ridgeland Blvd, a 4 bedroom, 2.5 bathroom home that truly surprises from the moment you step inside. Nestled in Ridgeland; a quiet, single-entry neighborhood in Mechanicsburg, this spacious residence offers the perfect blend of comfort, functionality, and privacy; designed to fit the way you live today. At first glance, the home presents a charming exterior, but step through the door and you’ll appreciate just how expansive it feels. With four generously sized bedrooms and two and a half bathrooms, there’s room for everyone to spread out and settle in. Multiple living areas; including a formal living room, a cozy family room, and a versatile bonus room complete w
Key facts
- 0.33 acre lot
- 2 garage spots
- Built 1966
Property features AI
Exterior
- Parking: Attached front-entry garage with 2 parking spaces
- Utilities: Public water; Public sewer
- Home design: Detached single-family home; Entry on main level
- Construction: Frame, brick, and vinyl siding exterior; Block foundation; Above-grade and below-grade structures; Built year reported by assessor
- Exterior features: Privacy fencing; Not in a federal flood zone
Interior
- Kitchen: Refrigerator; Dishwasher
- Bedrooms: Three bedrooms on the second (upper) level; One bedroom on the third (upper) level
- Bathrooms: Two full bathrooms (both on upper levels); One half bathroom on the main level
- Heating & cooling: Baseboard hot water heating (oil-fired); Central air conditioning (electric)
- Interior features: Two wood-burning fireplaces; Partially finished basement; Living room, dining room, family room, office, bonus room, screened porch
- Laundry & utility: Washer and dryer in unit (laundry on lower floor)
Neighborhood map
What this means for you Summary
Snapshot
- This is a 4-bed/2.0-bath single-family listed at $420k.
Deal economics
- At list price, monthly cash flow is $-590 ($-7k/yr) — negative.
- To cash-flow at today's rent, offer at most $316k (24.8% below list).
- To meet the 1% rule (rent ≥ 1% of price), the offer needs to be $261k (37.9% below list).
- Recommended offer: $261k (37.9% below list) — sets the bar for 1% rule.
- Cap rate 4.6% vs local median 2.9% in Camp Hill — top-decile yield for the area; either an underpriced asset or a hidden risk that comps aren't pricing in. Stress-test before assuming the spread holds.
Location & tenants
- Location reads 93/100 on livability (#5 in PA, #14 nationally) — a professional / high-income tenant draw. Strengths: crime A+, employment A+, housing A+.
- Cumberland Valley SD (suburban): math 54% / reading 71% proficiency, ranked #52 of 539 in PA (top 10%) — acceptable for families but not a draw, mixed tenant base, ~2y average lease; only 13% free/reduced lunch — higher-income household profile.
- Zoned schools: Cumberland Valley Hs (math 66% / reading 24%, grade D-, #191 of 437 statewide, top 44%, 3,035 students, 25% FRL).
- Zoned-school proficiency averages 45% at this address vs 62% district-wide (-17 pts) — the specific schools serving this property underperform the Cumberland Valley SD average; the district grade overstates school quality for this exact location.
- Market conditions: Rents rising (+2.0%/yr); 339 active listings in the ZIP; 5 comparable units currently listed for rent nearby; rentals leasing fast (median 14d on market — plan ~1-2 weeks tenant-placement turnaround); high-income renter base; 1,052 units permitted in Cumberland County in 2024 (310 in 5+ unit buildings).
Forward outlook
- Local home prices are declining (-3.0%/yr); year-one equity from $3k of loan paydown is wiped out by about $13k of value loss. Plan a longer hold.
- Cumberland County population projected at +17% by 2050 — long-run rental-demand tailwind backs the buy-and-hold thesis.
Negotiation context
- Only 6 days on market — expect competitive offers; lowballing is unlikely to land.
Risks & watch-outs
- Climate carrying-cost: extreme-heat days projected 7→15/yr by 2055 (HVAC capex compounding) — expect insurance premiums to compound above CPI over the hold.
Questions for the listing agent
- What do current leases actually rent for vs. the listed asking? Can we see a recent rent roll and the last 12 months of T-12 income?
- Built in 1966 — when were the roof, HVAC, electrical panel, plumbing, and water heater last replaced?
- Is there a deadline driving the sale (1031 exchange, divorce, estate, relocation)? That informs how much negotiation room exists.
- Schools are A-rated — typically a magnet for longer-tenancy family renters. What's the average tenant stay here, and is there a school-zone premium baked into asking?
- The area grade is low — what's the realistic commute time and amenity access for the typical tenant pool here? Any planned neighborhood developments (good or bad) we should know about?
- What's the average days-on-market for RENTAL listings here right now (not sales)? A rising rental-DOM trend means longer vacancies and softer asking-rent achievability than the comps imply.
- What's the recent tenant-quality profile in this submarket — average credit score on applications, eviction rate, late-payment / NSF rate, and stable-employment percentage? A property-management company in the area should have these aggregated.
- How much new for-sale + rental construction is in the pipeline within 1–3 miles? Heavy new supply typically softens prices + rents 12–24 months out; constrained supply supports both.
Investment metrics
- 1% rule
- 0.62% ✗
- Cap rate
- 4.61%
- Cash-on-cash
- -6.02%
- DSCR
- 0.73
- GRM
- 13.4
CMA / ARV
- ARV (median comp)
- $510,477
- List price
- $419,900
- Delta
- -17.74%
- Verdict
- UNDERPRICED
- Comps
- 20 within 1.0 mi
Show comp detail 12 sales within ~0.75 mi
| Address | Dist | Beds/Ba | Sqft | Sold | Price | $/sf | Match |
|---|---|---|---|---|---|---|---|
| 3912 Brookridge Dr | 0.11mi | 4/2.5 | 1,997 (+2%) | 7mo | $315,000 | $158 | 83 |
| 3911 Ridgeland Blvd | 0.06mi | 4/2.5 | 2,117 (+9%) | 2mo | $435,000 | $205 | 79 |
| 3906 Brookridge Dr | 0.10mi | 4/2.5 | 2,092 (+7%) | 6mo | $339,900 | $162 | 76 |
| 723 Florence Cir | 0.52mi | 3/2.5 (-1) | 1,936 (-1%) | 2mo | $426,000 | $220 | 66 |
| 940 Woodley Dr | 0.46mi | 3/2.0 (-1) | 1,942 (-0%) | 11mo | $455,000 | $234 | 64 |
| 960 Woodley Dr | 0.47mi | 3/2.0 (-1) | 1,942 (-0%) | 10mo | $460,000 | $237 | 64 |
| 3601 Beech Run Ln | 0.62mi | 4/2.0 | 1,904 (-2%) | 10mo | $360,000 | $189 | 59 |
| 3610 Kent Dr | 0.63mi | 4/2.5 | 1,998 (+2%) | 10mo | $345,000 | $173 | 56 |
| 3604 Kent Dr | 0.68mi | 3/2.0 (-1) | 2,040 (+5%) | 1mo | $399,400 | $196 | 55 |
| 3803 Bellows Dr | 0.61mi | 3/2.5 (-1) | 2,052 (+5%) | 3mo | $425,000 | $207 | 54 |
| 3614 Beech Run Ln | 0.49mi | 3/2.5 (-1) | 2,100 (+8%) | 10mo | $395,000 | $188 | 49 |
| 3601 Anthony Dr | 0.61mi | 3/2.0 (-1) | 2,233 (+14%) | 10mo | $389,900 | $175 | 34 |
Match score weights: distance 35% · size 25% · config 20% · recency 20%. Top-matched comps best support the ARV.
Projected returns pro-forma
-3.0% appreciation · 1.99% rent growth · sell at horizon
- IRR
- -27.7%
- Equity multiple
- 0.08×
- Total profit
- $-108,367
- Equity at exit
- $62,608
- IRR
- -30.0%
- Equity multiple
- -0.31×
- Total profit
- $-153,780
- Equity at exit
- $36,305
Cash invested: $117,572 (down + closing). Projections, not guarantees.
Landlord ↔ Tenant lean methodology
- Overall (STATE)
- 62 Landlord-Friendly
- State Pennsylvania
- 62 Landlord-Friendly · EVEN
- County
- — inherits STATE
- City
- — inherits STATE
ZIP-level market 17050
- Rents YoY
- 2.0%
- Active inventory
- 339
- Price-to-rent
- 13.4×
Monthly cashflow live
- Estimated rent
- $2,608 high interval (Pro) →
- Mortgage (P&I)
- −$2,202
- Tax from tax record
- −$274 /mo · $3,285/yr
- Insurance
- −$175
- HOA
- −$0
- Vacancy / Maint / Mgmt
- −$548
- Net cashflow
- $-590
Break-even live
UW: 25.0% down · 7.5% · 30yr · 1.5% tax · 5.0% vac · 8.0% maint · 8.0% mgmt
Financing live
Cash to close
- Down payment
- $104,975
- Closing costs
- $12,597
- Reserves months
- —
- Total cash needed
- —
Loan-product check · same deal, 3 products live
Conventional
25% down · 7.5% · 30yr
- Down + closing
- —
- Monthly P&I
- —
- Monthly cashflow
- —
- DSCR
- —
- Eligible?
- —
Personal DTI + credit; lowest rate.
DSCR
20% down · 8.5% · 30yr
- Down + closing
- —
- Monthly P&I
- —
- Monthly cashflow
- —
- DSCR
- —
- Eligible?
- —
No personal income docs; deal must DSCR.
Hard money
10% down · 12.0% · 12mo
- Down + closing
- —
- Monthly P&I
- —
- Monthly cashflow
- —
- DSCR
- —
- Eligible?
- —
Short-term bridge; refi at stabilization.
Rent comps 5 comps
| Address | Beds | Baths | Sqft | Rent | $/sqft | DOM | Units | Dist |
|---|---|---|---|---|---|---|---|---|
| 825 Ridgewood Dr Mechanicsburg, PA | 4.0 | 3.5 | 2112 | $2,595 | $1.23 | 13d | 1 | 0.67mi |
| 4110 Orrs Town Ct Mechanicsburg, PA | 3.0 | 2.5 | 1935 | $2,400 | $1.24 | 23d | 1 | 0.85mi |
| 5050 Mendenhall Dr Mechanicsburg, PA | 3.0 | 4.0 | 1829 | $2,475 | $1.35 | 43d | 1 | 1.34mi |
| 99 Lee Ann Ct Enola, PA | 3.0 | 2.5 | 1540 | $1,995 | $1.30 | 13d | 1 | 1.35mi |
| 4118 Orrs Bridge Rd Unit 27 Enola, PA | 3.0 | 2.5 | 1937 | $2,400 | $1.24 | 13d | 1 | 1.42mi |
Listing history 5 events
-
2026-05-12status Pending 2235-char remark
-
2026-05-07$419,900 Active 2235-char remark
-
2026-05-02historical $419,900 2235-char remark
-
1987-06-30soldstatus $107,000
-
1976-06-15soldstatus $53,000
ⓘ Source: listings_history table (triggers on properties + properties_extension) + one-shot
backfill from property_details.listing_events for pre-trigger history.
Tax reassessment forecast PA · Partial reset (capped growth)
- Current annual tax
- $3,285 · $274/mo
- Projected year-2 tax
- $4,960 · $413/mo
- Expected delta
- +$1,675/yr (+$140/mo · 51.0%)
ⓘ Screening estimate from a state-policy table — verify with the county assessor before closing.
Climate risk First Street
- Flood 1/10 Low FEMA zone X (unshaded) · 0% chance over 30 yrs
- Wildfire 1/10 Low
- Heat 5/10 Major 7 d/yr ≥100°F today · 15 d/yr by 30 yrs out
- Wind 3/10 Moderate 6% chance of damaging wind over 30 yrs
- Air quality 2/10 Low 1 unhealthy d/yr today · 3 by 30 yrs out
Nearby sold comps map
Loading sold comps map…
Walkable amenities ~0.75 mi
Loading nearby amenities…
Taxation est. · year 1
- Rental income
- $31,300
- − Mortgage interest
- −$23,521
- − Property taxes
- −$3,285
- − Insurance
- −$2,100
- − Repairs & maintenance
- −$2,504
- − Management
- −$2,504
- − Depreciation
- −$12,215
- Taxable loss
- −$14,829
- Est. tax savings @ 24.0%
- +$3,559
- After-tax cash flow
- $-3,523/yr
For passive investors: Depreciation is non-cash, so a rental often shows a tax loss while cash-flowing — sheltering income. Rental losses are passive: they offset passive income freely, and up to $25,000/yr can offset ordinary (W-2) income if you actively participate and your MAGI is under $100k (phasing out to $0 by $150k); unused losses carry forward. On sale, claimed depreciation is recaptured at up to 25%, and gains may owe capital-gains tax (a 1031 exchange can defer both). Figures are a year-1 estimate at your 24.0% rate — not tax advice; consult a CPA.
Schools (NCES district)
- District
- Cumberland Valley SD
- NCES district ID
- 4207110
- Math proficiency
- 54% ▼ -6.00%
- Reading proficiency
- 71% ▼ -7.00%
- Median HH income
- $78,135
- Composite
- 55.77/100
- National rank
- #1218
- State rank
- #52 of 539 in PA
Livability — Camp Hill
- Score
- 93/100
- State rank
- #5
- US rank
- #14
Category grades
Schools grade is shown separately in the Schools card above.
Census & demographics
- County
- Cumberland County · 257,673 people
- City population
- 39,664
- Metro
- Harrisburg-Carlisle, PA
- Population (ZIP)
- 43,571
- Household income
- $113,720
- Rent vs Own
- Severe rent burden
- 535.0
Population outlook (Cumberland County) Hauer SSP2
- Today (2025)
- 267,950 people
- By 2030
- 278,105 · +3.8%
- By 2040
- 296,552 · +10.7%
- By 2050
- 312,937 · +16.8%
- By 2075
- 349,233 · +30.3%
- By 2100
- 361,875 · +35.1%
Race, ethnicity, and origin ACS 2023
- Neighborhood character
- Predominantly White (75%)
- Race & ethnicity
- White 75% Asian 16% Two or more races 5% Hispanic / Latino 4% Black 1%
- Common ancestry
- Romanian 4% Lithuanian 2% Slovak 2%
- Foreign-born
- 16% · Canada, China, Vietnam
- Languages at home
- 81% English-only · Other Indo-European 6% Other Asian/Pacific 5% Spanish 3%
Political lean MEDSL · Cumberland
- 2024 margin
- Lean R (+9.4) · D 44.6% · R 54.1% · Other 1.3%
- 2008→2024 swing
- +4.2pp toward D · 2008: -13.6pp · 2024: -9.4pp
- All cycles
- 2024: R+9.4 2020: R+10.6 2016: R+18.6 2012: R+18.5 2008: R+13.6
Not yet ingested
- Civics
- —
Market trends
- HPI YoY
- ▼ -140.84%
- Current HPI
- 241.7363
- Rent YoY
- ▲ 1.99%
- Metro
- Harrisburg-Carlisle, PA
- State GDP YoY
- ▲ 1.68%
- F500 in state
- 34
Industry mix (Fortune 500 HQ in PA)
| Industry | F500 HQs | Revenue |
|---|---|---|
| Healthcare | 2 | $309B |
|
||
| Insurance | 2 | $27B |
|
||
| Telecommunications / Media | 1 | $124B |
|
||
| Industrial Distribution | 1 | $22B |
|
||
| Financial Services | 1 | $20B |
|
||
| Chemicals / Materials | 1 | $18B |
|
||
Price history
+749.1% since first listed7 events — show timeline
- 2026-06-10 Sold (Public Records) $450,000 Public Records
- 2026-06-08 Sold (MLS) $450,000 BRIGHT MLS
- 2026-05-12 Pending — BRIGHT MLS
- 2026-05-07 Listed $419,900 BRIGHT MLS
- 2026-05-02 Coming Soon $419,900 BRIGHT MLS
- 1987-06-30 Sold (Public Records) $107,000 Public Records
- 1976-06-15 Sold (Public Records) $53,000 Public Records
Property tax history
+2.8%/yrLatest (2026): $3,285 · +3.2% YoY. Source: county tax records.
Cash-flow waterfall
monthlySold comps — $/sqft
last 12 mo · ≤1 miLoading sold comps…