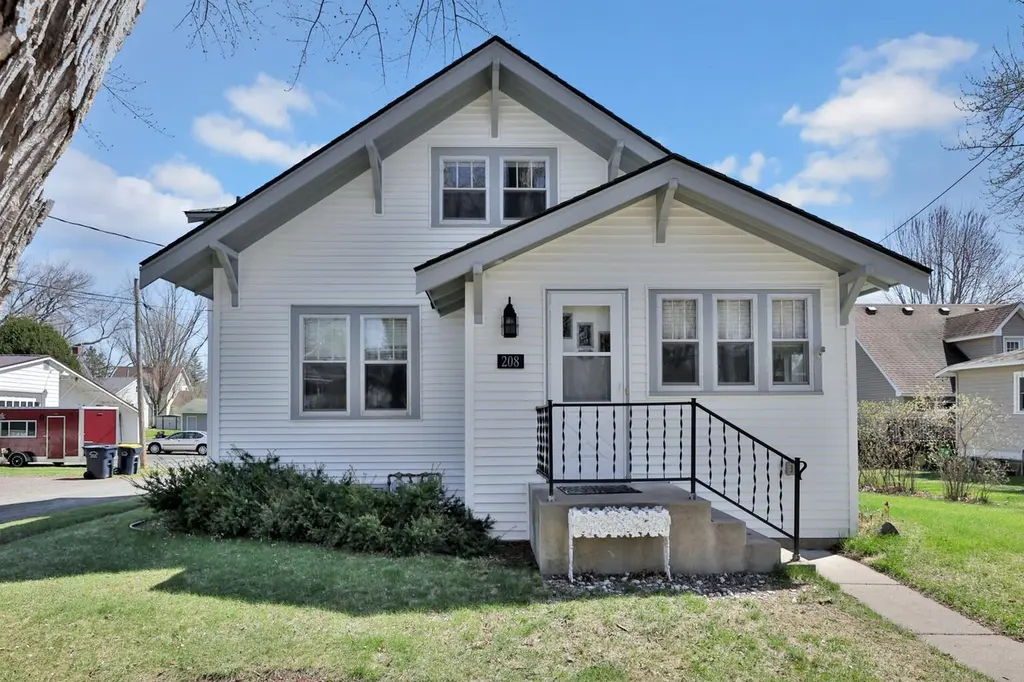
208 Center Ave · Center City, MN
Flood risk 1/10 · Minimal
- FEMA flood zone
- X (unshaded)
- Chance of flooding over 30 yrs
- 0.0%
- Est. flood insurance / yr
- $507 – $1,088
Fire risk 2/10 · Minimal
- Est. fire insurance / yr
- $888 – $1,650
Heat risk 2/10 · Minimal
- Hot days now (above 99°F)
- 7 days/yr
- Hot days in 30 yrs
- 14 days/yr
Wind risk 1/10 · Minimal
- Chance of severe wind over 30 yrs
- —
Air-quality risk 2/10 · Minimal
- Unhealthy air days now
- 1 days/yr
- Unhealthy air days in 30 yrs
- 3 days/yr
Risk factors via First Street. Map © Google.
Why this score? — see what drove the D grade
The composite is a weighted blend of 9 inputs, each scored 0–100. Each bar is that input's sub-score; the figure is the points it added to the 100-point composite (weight × sub-score).
- Cash flow +13.0/30.0
- ARV discount +7.5/15.0
- Schools +4.5/10.0
- DSCR +3.9/10.0
- Livability +3.4/5.0
- 1% rule +3.0/10.0
- Rent growth +2.5/5.0
- Condition / age +2.5/5.0
- Appreciation +0.0/10.0
$269,900
🖨 Deal sheet 📄 Offer letter ✓ Due diligence
Listing remarks
Charming and inviting, this delightful older home in historic Center City boasts three cozy bedrooms and large eat in kitchen, Living and Dining rooms perfect for comfy living. A standout feature is the lovely screened porch, ideal for enjoying morning coffee or evening breezes in a serene setting. The spacious eat-in kitchen offers ample space for culinary creations and family gatherings. Situated conveniently close to picturesque lakes, vibrant playgrounds, and an array of restaurants, this home is perfectly located for both relaxation and recreation. Embrace the charm of historic living in this beautiful property! New roof in 2022 - siding in 2023. The beautiful Chisago Lakes areas boas
Key facts
- Picturesque lakes
- Screened porch
- 7,100 sq ft lot
Tags
Property features AI
Exterior
- Parking: Attached garage (1-car) with interior dimensions approximately 19 x 25
- Utilities: City water connected; City sewer connected; Natural gas service
- Home design: Residential property; One-and-one-half story layout; City street frontage; public maintained road
- Construction: Block and poured concrete foundation; Roof replaced or 8 years old or newer
- Exterior features: Vinyl exterior siding; Screened porch/patio
Interior
- Kitchen: Kitchen with window; Cooktop; Microwave; Refrigerator
- Bedrooms: Three bedrooms (one main-floor bedroom; two upper-level bedrooms); Flexible upper-level room usable as office/den
- Bathrooms: One full bathroom on the main floor; One half bathroom in the basement
- Heating & cooling: Baseboard heating with boiler; Window air conditioning units
- Interior features: Informal dining area that can function as living/dining space; Screened porch
- Laundry & utility: Washer; Dryer; Laundry located on the lower level
Neighborhood map
What this means for you Summary
Snapshot
- This is a 2-bed/2.0-bath single-family listed at $270k.
Deal economics
- At list price, monthly cash flow is $-15 ($-181/yr) — negative.
- To cash-flow at today's rent, offer at most $267k (1.0% below list).
- To meet the 1% rule (rent ≥ 1% of price), the offer needs to be $215k (20.2% below list).
- Recommended offer: $215k (20.2% below list) — sets the bar for 1% rule.
Location & tenants
- Location reads 67/100 on livability (#443 in MN) — a middle-class / working-renter tenant base. Strengths: housing A+, employment A, crime B+; Watch: amenities F, commute F.
- Chisago Lakes School District (town): math 45% / reading 56% proficiency, ranked #91 of 301 in MN (top 30%) — acceptable for families but not a draw, mixed tenant base, ~2y average lease; only 16% free/reduced lunch — higher-income household profile.
- Market conditions: 19 active listings in the ZIP; 362 units permitted in Chisago County in 2024 (121 in 5+ unit buildings).
Forward outlook
- Local home prices are declining (-3.0%/yr); year-one equity from $2k of loan paydown is wiped out by about $8k of value loss. Plan a longer hold.
- Chisago County population projected at -11% by 2050 — secular population decline; favor cash flow + early exit over multi-decade hold.
Negotiation context
- It's been on market 26 days — a 2% lower offer ($266k) is reasonable based on typical stale-listing flexibility.
Risks & watch-outs
- Watch-outs: built in 1918 — expect roof / HVAC / electrical / plumbing capex.
Questions for the listing agent
- What do current leases actually rent for vs. the listed asking? Can we see a recent rent roll and the last 12 months of T-12 income?
- Built in 1918 — when were the roof, HVAC, electrical panel, plumbing, and water heater last replaced?
- Is there a deadline driving the sale (1031 exchange, divorce, estate, relocation)? That informs how much negotiation room exists.
- The area grade is low — what's the realistic commute time and amenity access for the typical tenant pool here? Any planned neighborhood developments (good or bad) we should know about?
- What's the average days-on-market for RENTAL listings here right now (not sales)? A rising rental-DOM trend means longer vacancies and softer asking-rent achievability than the comps imply.
- What's the recent tenant-quality profile in this submarket — average credit score on applications, eviction rate, late-payment / NSF rate, and stable-employment percentage? A property-management company in the area should have these aggregated.
- How much new for-sale + rental construction is in the pipeline within 1–3 miles? Heavy new supply typically softens prices + rents 12–24 months out; constrained supply supports both.
Investment metrics
- 1% rule
- 0.80% ✗
- Cap rate
- 6.23%
- Cash-on-cash
- -0.24%
- DSCR
- 0.99
- GRM
- 10.4
CMA / ARV
No comps found within radius.
Projected returns pro-forma
-3.0% appreciation · 3.0% rent growth · sell at horizon
- IRR
- -16.7%
- Equity multiple
- 0.41×
- Total profit
- $-44,756
- Equity at exit
- $40,243
- IRR
- -8.6%
- Equity multiple
- 0.46×
- Total profit
- $-40,452
- Equity at exit
- $23,336
Cash invested: $75,572 (down + closing). Projections, not guarantees.
Landlord ↔ Tenant lean methodology
- Overall (STATE)
- 46 Balanced
- State Minnesota
- 46 Balanced · D+2
- County
- — inherits STATE
- City
- — inherits STATE
ZIP-level market 55012
- Home prices YoY
- -21.5%
- Active inventory
- 19
- Price-to-rent
- 10.4×
Monthly cashflow live
- Estimated rent
- $2,153 medium interval (Pro) →
- Mortgage (P&I)
- −$1,415
- Tax from tax record
- −$188 /mo · $2,260/yr
- Insurance
- −$112
- HOA
- −$0
- Vacancy / Maint / Mgmt
- −$452
- Net cashflow
- $-15
Break-even live
UW: 25.0% down · 7.5% · 30yr · 1.5% tax · 5.0% vac · 8.0% maint · 8.0% mgmt
Financing live
Cash to close
- Down payment
- $67,475
- Closing costs
- $8,097
- Reserves months
- —
- Total cash needed
- —
Loan-product check · same deal, 3 products live
Conventional
25% down · 7.5% · 30yr
- Down + closing
- —
- Monthly P&I
- —
- Monthly cashflow
- —
- DSCR
- —
- Eligible?
- —
Personal DTI + credit; lowest rate.
DSCR
20% down · 8.5% · 30yr
- Down + closing
- —
- Monthly P&I
- —
- Monthly cashflow
- —
- DSCR
- —
- Eligible?
- —
No personal income docs; deal must DSCR.
Hard money
10% down · 12.0% · 12mo
- Down + closing
- —
- Monthly P&I
- —
- Monthly cashflow
- —
- DSCR
- —
- Eligible?
- —
Short-term bridge; refi at stabilization.
Listing history 3 events
-
2026-05-17price $269,900 957-char remark
-
2026-05-01price $279,900 957-char remark
-
2026-04-23$298,000 Active 957-char remark
ⓘ Source: listings_history table (triggers on properties + properties_extension) + one-shot
backfill from property_details.listing_events for pre-trigger history.
Tax reassessment forecast MN · Partial reset (capped growth)
- Current annual tax
- $2,260 · $188/mo
- Projected year-2 tax
- $2,641 · $220/mo
- Expected delta
- +$381/yr (+$32/mo · 16.9%)
ⓘ Screening estimate from a state-policy table — verify with the county assessor before closing.
Climate risk First Street
- Flood 1/10 Low FEMA zone X (unshaded) · 0% chance over 30 yrs
- Wildfire 2/10 Low
- Heat 2/10 Low 7 d/yr ≥99°F today · 14 d/yr by 30 yrs out
- Wind 1/10 Low
- Air quality 2/10 Low 1 unhealthy d/yr today · 3 by 30 yrs out
Nearby sold comps map
Loading sold comps map…
Walkable amenities ~0.75 mi
Loading nearby amenities…
Taxation est. · year 1
- Rental income
- $25,839
- − Mortgage interest
- −$15,119
- − Property taxes
- −$2,260
- − Insurance
- −$1,350
- − Repairs & maintenance
- −$2,067
- − Management
- −$2,067
- − Depreciation
- −$7,852
- Taxable loss
- −$4,875
- Est. tax savings @ 24.0%
- +$1,170
- After-tax cash flow
- $989/yr
For passive investors: Depreciation is non-cash, so a rental often shows a tax loss while cash-flowing — sheltering income. Rental losses are passive: they offset passive income freely, and up to $25,000/yr can offset ordinary (W-2) income if you actively participate and your MAGI is under $100k (phasing out to $0 by $150k); unused losses carry forward. On sale, claimed depreciation is recaptured at up to 25%, and gains may owe capital-gains tax (a 1031 exchange can defer both). Figures are a year-1 estimate at your 24.0% rate — not tax advice; consult a CPA.
Schools (NCES district)
- District
- Chisago Lakes School District
- NCES district ID
- 2700017
- Math proficiency
- 45% ▼ -18.00%
- Reading proficiency
- 56% ▼ -10.00%
- Median HH income
- $71,167
- Composite
- 45.18/100
- National rank
- #2674
- State rank
- #91 of 301 in MN
Livability — Center City
- Score
- 67/100
- State rank
- #443
- US rank
- #10483
Category grades
Schools grade is shown separately in the Schools card above.
Census & demographics
- Census place
- Center City, MN
- Population (ZIP)
- 1,995
Population outlook (Chisago County) Hauer SSP2
- Today (2025)
- 55,187 people
- By 2030
- 55,036 · -0.3%
- By 2040
- 53,293 · -3.4%
- By 2050
- 49,157 · -10.9%
- By 2075
- 38,399 · -30.4%
- By 2100
- 24,646 · -55.3%
Race, ethnicity, and origin ACS 2023
- Neighborhood character
- Predominantly White (91%)
- Race & ethnicity
- White 91% Two or more races 3% Native American 2% Black 2% Hispanic / Latino 1%
- Common ancestry
- Portuguese 11% Romanian 4% Scottish 4%
- Foreign-born
- 2% · Canada
- Languages at home
- 99% English-only · Spanish 1%
Political lean MEDSL · Chisago
- 2024 margin
- Solid R (+31.4) · D 33.5% · R 64.9% · Other 1.6%
- 2008→2024 swing
- -21.2pp toward R · 2008: -10.3pp · 2024: -31.4pp
- All cycles
- 2024: R+31.4 2020: R+29.2 2016: R+30.5 2012: R+12.6 2008: R+10.3
Not yet ingested
- Civics
- —
Market trends
- HPI YoY
- ▼ -81.57%
- Current HPI
- 298.1267
- Rent YoY
- —
- Metro
- —
- State GDP YoY
- ▲ 2.41%
- F500 in state
- 34
Industry mix (Fortune 500 HQ in MN)
| Industry | F500 HQs | Revenue |
|---|---|---|
| Healthcare | 2 | $407B |
|
||
| Retail | 2 | $150B |
|
||
| Consumer Goods | 2 | $32B |
|
||
| Industrial Machinery | 2 | $6B |
|
||
| Agriculture | 1 | $40B |
|
||
| Healthcare / Medical Devices | 1 | $32B |
|
||
Price history
-9.4% since first listed4 events — show timeline
- 2026-05-20 Pending — NORTHSTARMLS as Distributed by MLS Grid
- 2026-05-17 Price Changed $269,900 NORTHSTARMLS as Distributed by MLS Grid
- 2026-05-01 Price Changed $279,900 NORTHSTARMLS as Distributed by MLS Grid
- 2026-04-23 Listed $298,000 NORTHSTARMLS as Distributed by MLS Grid
Property tax history
+4.6%/yrLatest (2025): $2,260 · +1.5% YoY. Source: county tax records.
Cash-flow waterfall
monthlySold comps — $/sqft
last 12 mo · ≤1 miLoading sold comps…