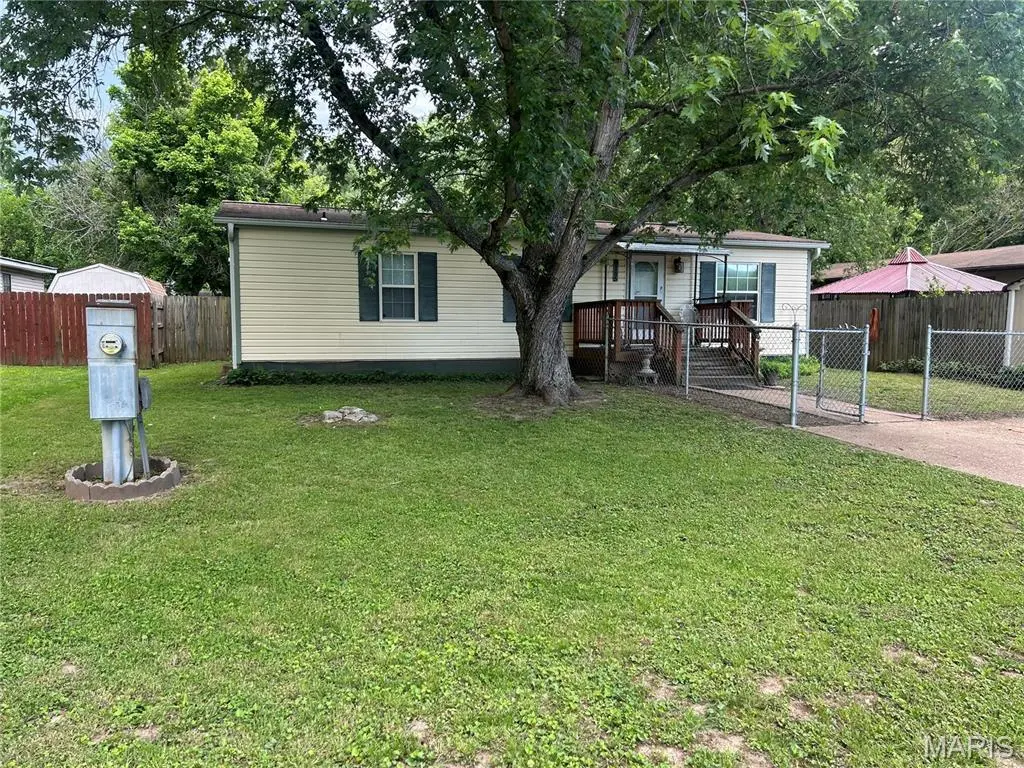
6185 Summerset Dr · Byrnes Mill, MO
Flood risk 8/10 · Major
- FEMA flood zone
- A
- Chance of flooding over 30 yrs
- 0.99%
- Est. flood insurance / yr
- $1,009 – $1,996
Fire risk 2/10 · Minimal
- Est. fire insurance / yr
- $1,054 – $1,958
Heat risk 5/10 · Moderate
- Hot days now (above 105°F)
- 7 days/yr
- Hot days in 30 yrs
- 21 days/yr
Wind risk 2/10 · Minimal
- Chance of severe wind over 30 yrs
- 1.0%
Air-quality risk 1/10 · Minimal
- Unhealthy air days now
- 0 days/yr
- Unhealthy air days in 30 yrs
- 0 days/yr
Risk factors via First Street. Map © Google.
Why this score? — see what drove the D+ grade
The composite is a weighted blend of 9 inputs, each scored 0–100. Each bar is that input's sub-score; the figure is the points it added to the 100-point composite (weight × sub-score).
- Cash flow +18.7/30.0
- ARV discount +6.9/15.0
- DSCR +5.9/10.0
- 1% rule +4.2/10.0
- Schools +3.5/10.0
- Livability +2.9/5.0
- Rent growth +2.5/5.0
- Condition / age +2.5/5.0
- Appreciation +0.0/10.0
$135,900
🖨 Deal sheet 📄 Offer letter ✓ Due diligence
Listing remarks MLS
For comp purposes only
Key facts
- Shed
- Washer and dryer
- Fenced
Tags
Property features AI
Finance
- Other: Private ownership; Lease not considered
- HOA & community: Woodbridge community with a $10 monthly association fee (amenities listed as none)
Exterior
- Parking: Driveway parking; Total parking for 2 vehicles
- Utilities: Public water; Public sewer; Electric service by Ameren; Electricity connected
- Home design: Manufactured home (attached); Single-story
- Construction: Vinyl siding; Other foundation
- Exterior features: Back yard; Chain link fenced yard; Shed(s); Deck
Interior
- Kitchen: Free-standing electric range; Refrigerator; Pantry
- Bedrooms: Three bedrooms — all on the main level
- Flooring: Carpet; Laminate
- Bathrooms: Two full bathrooms (both on the main level)
- Heating & cooling: Electric heating; Central air conditioning
- Interior features: Ceiling fans; Open floor plan; Pantry; Bathrooms; Storage
- Laundry & utility: Dedicated laundry room; Washer; Dryer
Neighborhood map
What this means for you Summary
Snapshot
- This is a 3-bed/2.0-bath other listed at $136k.
Deal economics
- At list price, monthly cash flow is $8 ($95/yr) — positive.
- The deal already cash-flows at list — no discount required.
- To meet the 1% rule (rent ≥ 1% of price), the offer needs to be $125k (8.0% below list).
- Recommended offer: $125k (8.0% below list) — sets the bar for 1% rule.
- Cap rate 7.5% vs local median 3.6% in Byrnes Mill — top-decile yield for the area; either an underpriced asset or a hidden risk that comps aren't pricing in. Stress-test before assuming the spread holds.
Location & tenants
- Location reads 58/100 on livability (#591 in MO) — a working-class tenant base; expect higher turnover. Strengths: employment A+, housing A+, cost of living A-; Watch: crime C-, amenities F, commute F.
- Northwest R-I (suburban): math 37% / reading 43% proficiency, ranked #128 of 324 in MO (top 40%) — families likely to look elsewhere, expect single-tenant / working-renter base with shorter leases.
- Zoned schools: House Springs Elem. (math 35% / reading 38%, grade F, #656 of 1,115 statewide, top 59%, 481 students, 44% FRL); Northwest High (math 26% / reading 56%, grade F, #236 of 521 statewide, top 45%, 1,841 students, 27% FRL) — zoned schools at 36% FRL track the district average.
- Market conditions: 108 active listings in the ZIP; 1 comparable units currently listed for rent nearby; 807 units permitted in Jefferson County in 2024 (104 in 5+ unit buildings).
Forward outlook
- Local home prices are declining (-3.0%/yr); year-one equity from $940 of loan paydown is wiped out by about $4k of value loss. Plan a longer hold.
Negotiation context
- It's been on market 44 days — a 3% lower offer ($132k) is reasonable based on typical stale-listing flexibility.
- 2 sale attempts since 8y ago with the ask held roughly flat each time — persistent listings suggest the price (not the market) is what's stuck; bring a comps-based counter.
Risks & watch-outs
- Watch-outs: flood insurance adds $125/mo.
- Climate carrying-cost: in FEMA flood zone A (mandatory federal flood insurance); extreme-heat days projected 7→21/yr by 2055 (HVAC capex compounding) — expect insurance premiums to compound above CPI over the hold.
Questions for the listing agent
- It's been on market 44 days. Have you received any prior offers? Is the seller open to a 8% concession, seller financing, or rate buy-down credit?
- What's the actual annual flood-insurance premium (NFIP or private), and is the property in a SFHA with mandatory coverage?
- What does the HOA fee cover, when was the last increase, and are there any pending special assessments or reserve-fund shortfalls?
- Is there a deadline driving the sale (1031 exchange, divorce, estate, relocation)? That informs how much negotiation room exists.
- Schools are F-rated, which usually means shorter tenancies and higher turnover. Who's the typical renter profile here, and what's been the actual vacancy rate?
- The area grade is low — what's the realistic commute time and amenity access for the typical tenant pool here? Any planned neighborhood developments (good or bad) we should know about?
- What's the average days-on-market for RENTAL listings here right now (not sales)? A rising rental-DOM trend means longer vacancies and softer asking-rent achievability than the comps imply.
- What's the recent tenant-quality profile in this submarket — average credit score on applications, eviction rate, late-payment / NSF rate, and stable-employment percentage? A property-management company in the area should have these aggregated.
- How much new for-sale + rental construction is in the pipeline within 1–3 miles? Heavy new supply typically softens prices + rents 12–24 months out; constrained supply supports both.
Investment metrics
- 1% rule
- 0.92% ✗
- Cap rate
- 7.47%
- Cash-on-cash
- 4.20%
- DSCR
- 1.19
- GRM
- 9.1
CMA / ARV
- ARV (median comp)
- $134,181
- List price
- $135,900
- Delta
- 1.28%
- Verdict
- FAIR
- Comps
- 3 within 2.0 mi
Projected returns pro-forma
-3.0% appreciation · 3.0% rent growth · sell at horizon
- IRR
- -15.9%
- Equity multiple
- 0.44×
- Total profit
- $-21,473
- Equity at exit
- $20,263
- IRR
- -7.4%
- Equity multiple
- 0.53×
- Total profit
- $-17,872
- Equity at exit
- $11,750
Cash invested: $38,052 (down + closing). Projections, not guarantees.
Landlord ↔ Tenant lean methodology
- Overall (STATE)
- 81 Strongly Landlord-Friendly
- State Missouri
- 81 Strongly Landlord-Friendly · R+10
- County
- — inherits STATE
- City
- — inherits STATE
ZIP-level market 63051
- Active inventory
- 108
- Price-to-rent
- 9.1×
Monthly cashflow live
- Estimated rent
- $1,250 medium interval (Pro) →
- Mortgage (P&I)
- −$713
- Tax from tax record
- −$75 /mo · $901/yr
- Insurance
- −$57
- Flood insurance flood zone
- −$125 /mo · $1,502/yr
- HOA
- −$10
- Vacancy / Maint / Mgmt
- −$262
- Net cashflow
- $8
Break-even live
UW: 25.0% down · 7.5% · 30yr · 1.5% tax · 5.0% vac · 8.0% maint · 8.0% mgmt
Financing live
Cash to close
- Down payment
- $33,975
- Closing costs
- $4,077
- Reserves months
- —
- Total cash needed
- —
Loan-product check · same deal, 3 products live
Conventional
25% down · 7.5% · 30yr
- Down + closing
- —
- Monthly P&I
- —
- Monthly cashflow
- —
- DSCR
- —
- Eligible?
- —
Personal DTI + credit; lowest rate.
DSCR
20% down · 8.5% · 30yr
- Down + closing
- —
- Monthly P&I
- —
- Monthly cashflow
- —
- DSCR
- —
- Eligible?
- —
No personal income docs; deal must DSCR.
Hard money
10% down · 12.0% · 12mo
- Down + closing
- —
- Monthly P&I
- —
- Monthly cashflow
- —
- DSCR
- —
- Eligible?
- —
Short-term bridge; refi at stabilization.
Rent comps 1 comps
| Address | Beds | Baths | Sqft | Rent | $/sqft | DOM | Units | Dist |
|---|---|---|---|---|---|---|---|---|
| 6806 Treetop Ln House Springs, MO | 2.0 | 2.0 | 1000 | $1,250 | $1.25 | 44d | 1 | 1.46mi |
HOA detail
- Monthly dues
- $10 · $120/yr
Listing history 24 events
-
2026-06-18days on market $135,900 Active 44 DOM
-
2026-06-17days on market $135,900 Active 43 DOM
-
2026-06-16days on market $135,900 Active 42 DOM
-
2026-06-15days on market $135,900 Active 41 DOM
-
2026-06-13days on market $135,900 Active 39 DOM
-
2026-06-13days on market $135,900 Active 38 DOM
-
2026-06-09days on market $135,900 Active 35 DOM
-
2026-06-08days on market $135,900 Active 34 DOM
-
2026-06-07days on market $135,900 Active 33 DOM
-
2026-06-05days on market $135,900 Active 30 DOM
-
2026-06-03days on market $135,900 Active 29 DOM
-
2026-06-02days on market $135,900 Active 28 DOM
-
2026-06-01days on market $135,900 Active 27 DOM
-
2026-05-31days on market $135,900 Active 26 DOM
-
2026-05-12price $135,900 470-char remark
-
2026-05-05$139,900 Active 470-char remark
-
2025-04-02soldstatus
-
2018-06-29soldstatus
-
2018-06-28soldstatus Closed 22-char remark
Show marketing remark (22 chars)
For comp purposes only
-
2018-06-28status Pending 22-char remark
Show marketing remark (22 chars)
For comp purposes only
-
2018-04-12$90,000 Active 22-char remark
Show marketing remark (22 chars)
For comp purposes only
-
2018-04-12historical Contingent (No Kickout) 22-char remark
Show marketing remark (22 chars)
For comp purposes only
-
2007-11-05soldstatus
-
2004-10-05soldstatus
ⓘ Source: listings_history table (triggers on properties + properties_extension) + one-shot
backfill from property_details.listing_events for pre-trigger history.
Tax reassessment forecast MO · Resets to sale price
- Current annual tax
- $901 · $75/mo
- Projected year-2 tax
- $1,318 · $110/mo
- Expected delta
- +$417/yr (+$35/mo · 46.3%)
ⓘ Screening estimate from a state-policy table — verify with the county assessor before closing.
Climate risk First Street
- Flood 8/10 Severe FEMA zone A · 99% chance over 30 yrs
- Wildfire 2/10 Low
- Heat 5/10 Major 7 d/yr ≥105°F today · 21 d/yr by 30 yrs out
- Wind 2/10 Low 100% chance of damaging wind over 30 yrs
- Air quality 1/10 Low 0 unhealthy d/yr today · 0 by 30 yrs out
Nearby sold comps map
Loading sold comps map…
Walkable amenities ~0.75 mi
Loading nearby amenities…
Taxation est. · year 1
- Rental income
- $15,000
- − Mortgage interest
- −$7,613
- − Property taxes
- −$901
- − Insurance
- −$2,182
- − Repairs & maintenance
- −$1,200
- − Management
- −$1,200
- − HOA
- −$120
- − Depreciation
- −$3,953
- Taxable loss
- −$2,169
- Est. tax savings @ 24.0%
- +$521
- After-tax cash flow
- $616/yr
For passive investors: Depreciation is non-cash, so a rental often shows a tax loss while cash-flowing — sheltering income. Rental losses are passive: they offset passive income freely, and up to $25,000/yr can offset ordinary (W-2) income if you actively participate and your MAGI is under $100k (phasing out to $0 by $150k); unused losses carry forward. On sale, claimed depreciation is recaptured at up to 25%, and gains may owe capital-gains tax (a 1031 exchange can defer both). Figures are a year-1 estimate at your 24.0% rate — not tax advice; consult a CPA.
Schools (NCES district)
- District
- Northwest R-I
- NCES district ID
- 2922890
- Math proficiency
- 37% ▼ -9.00%
- Reading proficiency
- 43% ▼ -9.00%
- Median HH income
- $55,998
- Composite
- 35.05/100
- National rank
- #5034
- State rank
- #128 of 324 in MO
Livability — Byrnes Mill
- Score
- 58/100
- State rank
- #591
- US rank
- #20943
Category grades
Schools grade is shown separately in the Schools card above.
Census & demographics
- Population (ZIP)
- 12,589
Population outlook (Jefferson County) Hauer SSP2
- Today (2025)
- 235,088 people
- By 2030
- 238,365 · +1.4%
- By 2040
- 240,156 · +2.2%
- By 2050
- 234,651 · -0.2%
- By 2075
- 214,569 · -8.7%
- By 2100
- 179,697 · -23.6%
Race, ethnicity, and origin ACS 2023
- Neighborhood character
- Predominantly White (88%)
- Race & ethnicity
- White 88% Two or more races 10% Hispanic / Latino 3%
- Common ancestry
- Lithuanian 5% Italian 3% Portuguese 2%
- Foreign-born
- 1% · Canada
- Languages at home
- 98% English-only · Spanish 1%
Political lean MEDSL · Jefferson
- 2024 margin
- Solid R (+36.7) · D 31.0% · R 67.7% · Other 1.3%
- 2008→2024 swing
- -39.3pp toward R · 2008: 2.5pp · 2024: -36.7pp
- All cycles
- 2024: R+36.7 2020: R+33.9 2016: R+35.3 2012: R+12.7 2008: D+2.5
Not yet ingested
- Civics
- —
Market trends
- HPI YoY
- ▼ -189.81%
- Current HPI
- 209.5904
- Rent YoY
- —
- Metro
- —
- State GDP YoY
- ▲ 1.84%
- F500 in state
- 20
Industry mix (Fortune 500 HQ in MO)
| Industry | F500 HQs | Revenue |
|---|---|---|
| Healthcare | 1 | $163B |
|
||
| Insurance | 1 | $21B |
|
||
| Industrial Technology | 1 | $17B |
|
||
| Retail | 1 | $16B |
|
||
| Industrial Distribution | 1 | $10B |
|
||
| Utilities | 1 | $9B |
|
||
Price history
+51.0% since first listed10 events — show timeline
- 2026-05-12 Price Changed $135,900 MARIS as Distributed by MLS Grid
- 2026-05-05 Listed $139,900 MARIS as Distributed by MLS Grid
- 2025-04-02 Sold (Public Records) — Public Records
- 2018-06-29 Sold (Public Records) — Public Records
- 2018-06-28 Sold (MLS) — MARIS as Distributed by MLS Grid
- 2018-06-28 Pending — MARIS as Distributed by MLS Grid
- 2018-04-12 Listed $90,000 MARIS as Distributed by MLS Grid
- 2018-04-12 Contingent — MARIS as Distributed by MLS Grid
- 2007-11-05 Sold (Public Records) — Public Records
- 2004-10-05 Sold (Public Records) — Public Records
Property tax history
+2.5%/yrLatest (2025): $901 · +5.3% YoY. Source: county tax records.
Cash-flow waterfall
monthlySold comps — $/sqft
last 12 mo · ≤1 miLoading sold comps…