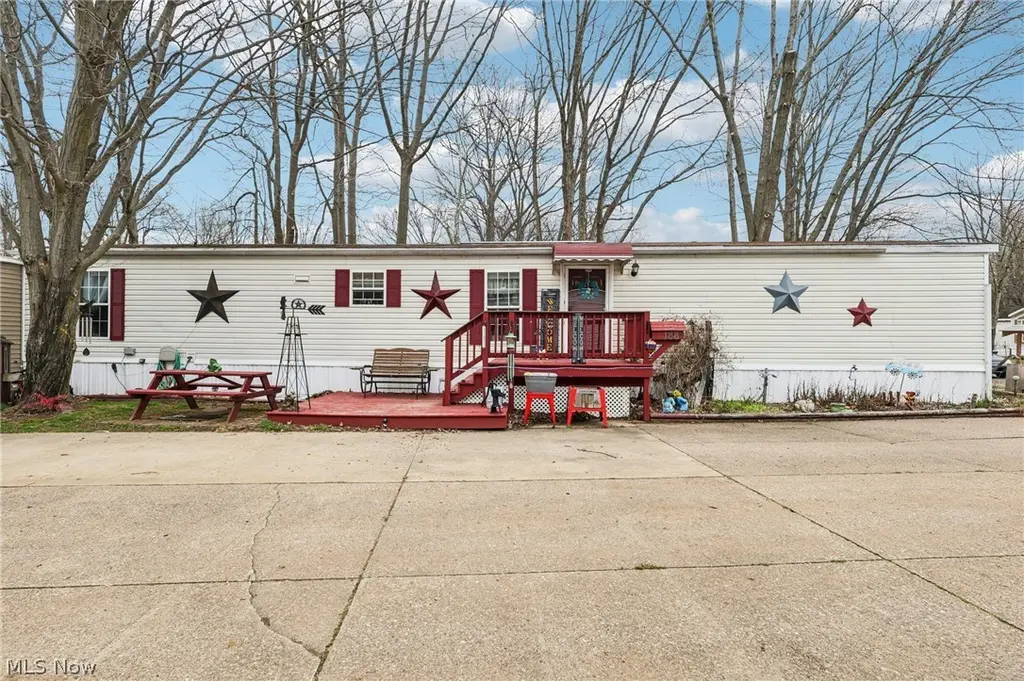
188 Paradise Blvd · North Perry, OH
Flood risk 1/10 · Minimal
- FEMA flood zone
- X (unshaded)
- Chance of flooding over 30 yrs
- 0.0%
- Est. flood insurance / yr
- $473 – $860
Fire risk 1/10 · Minimal
- Est. fire insurance / yr
- $713 – $1,323
Heat risk 2/10 · Minimal
- Hot days now (above 93°F)
- 7 days/yr
- Hot days in 30 yrs
- 17 days/yr
Wind risk 1/10 · Minimal
- Chance of severe wind over 30 yrs
- —
Air-quality risk 4/10 · Minor
- Unhealthy air days now
- 3 days/yr
- Unhealthy air days in 30 yrs
- 7 days/yr
Risk factors via First Street. Map © Google.
Why this score? — see what drove the B grade
The composite is a weighted blend of 9 inputs, each scored 0–100. Each bar is that input's sub-score; the figure is the points it added to the 100-point composite (weight × sub-score).
- Cash flow +30.0/30.0
- 1% rule +10.0/10.0
- DSCR +10.0/10.0
- ARV discount +7.5/15.0
- Schools +5.0/10.0
- Livability +3.5/5.0
- Rent growth +2.5/5.0
- Condition / age +2.2/5.0
- Appreciation +0.0/10.0
$69,900
🖨 Deal sheet 📄 Offer letter ✓ Due diligence
Listing remarks
Beautiful 2-bedroom, 2 full bath home in Madison! This well-maintained property offers comfortable, low-maintenance living with great outdoor features, including a sun porch, front deck, and a backyard garden area. Enjoy additional storage with multiple sheds and a dedicated basketball area for recreation. Community amenities include access to a pool, perfect for relaxing all summer long. Don’t miss this great opportunity!
Key facts
- Multiple sheds
- Front deck
- Sun porch
Tags
Property features AI
Finance
- Other: Pets allowed with restrictions (breed, number, and size limits)
- Financial info: Property has a land lease ($355)
- HOA & community: Community pool
Exterior
- Parking: Driveway
- Utilities: Public water; Public sewer; Electric service
- Home design: Single-story home
- Construction: Vinyl siding; Asphalt shingle roof; Raised and slab foundation; Built per public records
- Exterior features: Enclosed areas and multiple porches (front, side, patio); Backyard fencing; Shed(s); In-ground community pool (private pool listed); No additional exterior features specified
Interior
- Kitchen: Range; Microwave; Refrigerator
- Bedrooms: Two main-level bedrooms
- Bathrooms: Two full bathrooms (both on the main level)
- Heating & cooling: Electric heating
- Interior features: Double-pane windows; Ceiling fan(s)
- Laundry & utility: Main-level laundry; Washer; Dryer
Neighborhood map
What this means for you Summary
Snapshot
- This is a 2-bed/2.0-bath single-family listed at $70k. Condition is rated fair.
Deal economics
- At list price, monthly cash flow is $787 ($9k/yr) — positive.
- The deal already cash-flows at list — no discount required.
- Meets the 1% rule at list price ($2k rent vs $70k).
- Recommended offer: $66k (6.0% below list) — sets the bar for market timing.
Location & tenants
- Location reads 70/100 on livability (#482 in OH) — a middle-class / working-renter tenant base. Strengths: employment A+, cost of living A+, housing A+; Watch: schools D, health & safety D, amenities F.
- Madison Local (suburban): math 58% / reading 59% proficiency, ranked #308 of 656 in OH (top 47%) — acceptable for families but not a draw, mixed tenant base, ~2y average lease.
- Market conditions: 96 active listings in the ZIP; 448 units permitted in Lake County in 2024 (0 in 5+ unit buildings).
Forward outlook
- Local home prices are declining (-3.0%/yr); year-one equity from $483 of loan paydown is wiped out by about $2k of value loss. Plan a longer hold.
- Lake County population projected to shrink 8% by 2050 — rents likely to lag national; underwrite the cash flow, not the appreciation.
- At projected returns (-3.0% appreciation + 3.0% rent growth), your $20k cash investment doubles in ~3 years — after that, you're playing with house money.
Negotiation context
- It's been on market 83 days — a 6% lower offer ($66k) is reasonable based on typical stale-listing flexibility.
Questions for the listing agent
- It's been on market 83 days. Have you received any prior offers? Is the seller open to a 6% concession, seller financing, or rate buy-down credit?
- Have any recent inspections been done? Can we get a copy of the seller's disclosures and any deferred-maintenance estimates?
- Why hasn't it sold? Are there any deal-killer items the seller is aware of (foundation, flood, title, zoning, code violations)?
- Is there a deadline driving the sale (1031 exchange, divorce, estate, relocation)? That informs how much negotiation room exists.
- Schools are D-rated, which usually means shorter tenancies and higher turnover. Who's the typical renter profile here, and what's been the actual vacancy rate?
- What's the average days-on-market for RENTAL listings here right now (not sales)? A rising rental-DOM trend means longer vacancies and softer asking-rent achievability than the comps imply.
- What's the recent tenant-quality profile in this submarket — average credit score on applications, eviction rate, late-payment / NSF rate, and stable-employment percentage? A property-management company in the area should have these aggregated.
- How much new for-sale + rental construction is in the pipeline within 1–3 miles? Heavy new supply typically softens prices + rents 12–24 months out; constrained supply supports both.
Investment metrics
- 1% rule
- 2.30% ✓
- Cap rate
- 19.81%
- Cash-on-cash
- 48.26%
- DSCR
- 3.15
- GRM
- 3.6
CMA / ARV
No comps found within radius.
Projected returns pro-forma
-3.0% appreciation · 3.0% rent growth · sell at horizon
- IRR
- 45.8%
- Equity multiple
- 2.98×
- Total profit
- $38,832
- Equity at exit
- $10,422
- IRR
- 51.6%
- Equity multiple
- 6.03×
- Total profit
- $98,468
- Equity at exit
- $6,044
Cash invested: $19,572 (down + closing). Projections, not guarantees.
Landlord ↔ Tenant lean methodology
- Overall (STATE)
- 73 Landlord-Friendly
- State Ohio
- 73 Landlord-Friendly · R+6
- County
- — inherits STATE
- City
- — inherits STATE
ZIP-level market 44057
- Active inventory
- 96
- Price-to-rent
- 3.6×
Monthly cashflow live
- Estimated rent
- $1,608 medium interval (Pro) →
- Mortgage (P&I)
- −$367
- Tax est. 1.5%
- −$87 /mo · $1,048/yr
- Insurance
- −$29
- HOA
- −$0
- Vacancy / Maint / Mgmt
- −$338
- Net cashflow
- $787
Break-even live
UW: 25.0% down · 7.5% · 30yr · 1.5% tax · 5.0% vac · 8.0% maint · 8.0% mgmt
Financing live
Cash to close
- Down payment
- $17,475
- Closing costs
- $2,097
- Reserves months
- —
- Total cash needed
- —
Loan-product check · same deal, 3 products live
Conventional
25% down · 7.5% · 30yr
- Down + closing
- —
- Monthly P&I
- —
- Monthly cashflow
- —
- DSCR
- —
- Eligible?
- —
Personal DTI + credit; lowest rate.
DSCR
20% down · 8.5% · 30yr
- Down + closing
- —
- Monthly P&I
- —
- Monthly cashflow
- —
- DSCR
- —
- Eligible?
- —
No personal income docs; deal must DSCR.
Hard money
10% down · 12.0% · 12mo
- Down + closing
- —
- Monthly P&I
- —
- Monthly cashflow
- —
- DSCR
- —
- Eligible?
- —
Short-term bridge; refi at stabilization.
Listing history 16 events
-
2026-06-18days on market $69,900 Active 83 DOM
-
2026-06-17days on market $69,900 Active 82 DOM
-
2026-06-16days on market $69,900 Active 81 DOM
-
2026-06-15days on market $69,900 Active 80 DOM
-
2026-06-13days on market $69,900 Active 78 DOM
-
2026-06-12days on market $69,900 Active 77 DOM
-
2026-06-09days on market $69,900 Active 74 DOM
-
2026-06-08days on market $69,900 Active 73 DOM
-
2026-06-08days on market $69,900 Active 72 DOM
-
2026-06-07days on market $69,900 Active 71 DOM
-
2026-06-04days on market $69,900 Active 68 DOM
-
2026-06-02days on market $69,900 Active 67 DOM
-
2026-06-01days on market $69,900 Active 66 DOM
-
2026-05-31days on market $69,900 Active 65 DOM
-
2026-04-22price $69,900
-
2026-03-27$74,900 Active
ⓘ Source: listings_history table (triggers on properties + properties_extension) + one-shot
backfill from property_details.listing_events for pre-trigger history.
Climate risk First Street
- Flood 1/10 Low FEMA zone X (unshaded) · 0% chance over 30 yrs
- Wildfire 1/10 Low
- Heat 2/10 Low 7 d/yr ≥93°F today · 17 d/yr by 30 yrs out
- Wind 1/10 Low
- Air quality 4/10 Moderate 3 unhealthy d/yr today · 7 by 30 yrs out
Nearby sold comps map
Loading sold comps map…
Walkable amenities ~0.75 mi
Loading nearby amenities…
Taxation est. · year 1
- Rental income
- $19,294
- − Mortgage interest
- −$3,915
- − Property taxes
- −$1,048
- − Insurance
- −$350
- − Repairs & maintenance
- −$1,544
- − Management
- −$1,544
- − Depreciation
- −$2,033
- Taxable income
- $8,860
- Est. tax owed @ 24.0%
- −$2,126
- After-tax cash flow
- $7,319/yr
For passive investors: Depreciation is non-cash, so a rental often shows a tax loss while cash-flowing — sheltering income. Rental losses are passive: they offset passive income freely, and up to $25,000/yr can offset ordinary (W-2) income if you actively participate and your MAGI is under $100k (phasing out to $0 by $150k); unused losses carry forward. On sale, claimed depreciation is recaptured at up to 25%, and gains may owe capital-gains tax (a 1031 exchange can defer both). Figures are a year-1 estimate at your 24.0% rate — not tax advice; consult a CPA.
Condition & rehab AI · 13 photos
A fair condition home with cosmetic updates needed to enhance curb appeal and interior aesthetics, improving both resale and rental value.
Repairs flagged
- Minor Paint — Some discoloration on siding
- Minor Landscaping — Some overgrowth
Value-add opportunities
- Both Paint exterior and landscaping — Enhances curb appeal and value
- Resale Replace worn carpet with hardwood — Improves aesthetic and value
- Resale Replace worn kitchen cabinets — Modernizes kitchen and adds value
Renovation cost estimate screening
| Repair item | Severity | Est. cost |
|---|---|---|
| Paint · Some discoloration on siding | Minor | $500–3,000 |
| Landscaping · Some overgrowth | Minor | $500–3,000 |
| Total estimated repair cost · 2 items | $1,000–6,000 |
Value-add ROI direction
- Both Paint exterior and landscaping — Enhances curb appeal and value ↑
- Resale Replace worn carpet with hardwood — Improves aesthetic and value ↑
- Resale Replace worn kitchen cabinets — Modernizes kitchen and adds value ↑
ⓘ Cost ranges are severity-bucket heuristics (US national rule-of-thumb). Get contractor quotes + a written scope before underwriting a rehab budget.
Schools (NCES district)
- District
- Madison Local
- NCES district ID
- 3904788
- Math proficiency
- 58% ▼ -7.00%
- Reading proficiency
- 59% ▼ -6.00%
- Median HH income
- $51,608
- Composite
- 49.99/100
- National rank
- #1924
- State rank
- #308 of 656 in OH
Livability — North Perry
- Score
- 70/100
- State rank
- #482
- US rank
- #8064
Category grades
Schools grade is shown separately in the Schools card above.
Census & demographics
- County
- Lake · 224,932 people
- Metro
- Cleveland, OH
- Population (ZIP)
- 19,491
- Household income
- $70,212
- Rent vs Own
- Severe rent burden
- 8.5
Population outlook (Lake County) Hauer SSP2
- Today (2025)
- 230,022 people
- By 2030
- 228,151 · -0.8%
- By 2040
- 221,018 · -3.9%
- By 2050
- 212,754 · -7.5%
- By 2075
- 200,309 · -12.9%
- By 2100
- 183,315 · -20.3%
Race, ethnicity, and origin ACS 2023
- Neighborhood character
- Predominantly White (93%)
- Race & ethnicity
- White 93% Two or more races 5% Hispanic / Latino 2%
- Common ancestry
- Romanian 6% Scotch-Irish 2% Slovak 2%
- Foreign-born
- 2% · Canada
- Languages at home
- 97% English-only · Spanish 2%
Political lean MEDSL · Lake
- 2024 margin
- R (+14.3) · D 42.4% · R 56.7%
- 2008→2024 swing
- -15.2pp toward R · 2008: 0.8pp · 2024: -14.3pp
- All cycles
- 2024: R+14.3 2020: R+13.6 2016: R+15.6 2012: R+1.7 2008: D+0.8
Not yet ingested
- Civics
- —
Market trends
- HPI YoY
- ▼ -241.42%
- Current HPI
- 187.8978
- Rent YoY
- —
- Metro
- —
- State GDP YoY
- ▲ 1.98%
- F500 in state
- 48
Industry mix (Fortune 500 HQ in OH)
| Industry | F500 HQs | Revenue |
|---|---|---|
| Insurance | 3 | $145B |
|
||
| Industrial Machinery | 3 | $49B |
|
||
| Financial Services | 3 | $24B |
|
||
| Consumer Goods | 2 | $93B |
|
||
| Aerospace / Defense | 2 | $47B |
|
||
| Utilities | 2 | $33B |
|
||
Price history
-6.7% since first listed2 events — show timeline
- 2026-04-22 Price Changed $69,900 MLSNOW
- 2026-03-27 Listed $74,900 MLSNOW
Cash-flow waterfall
monthlySold comps — $/sqft
last 12 mo · ≤1 miLoading sold comps…