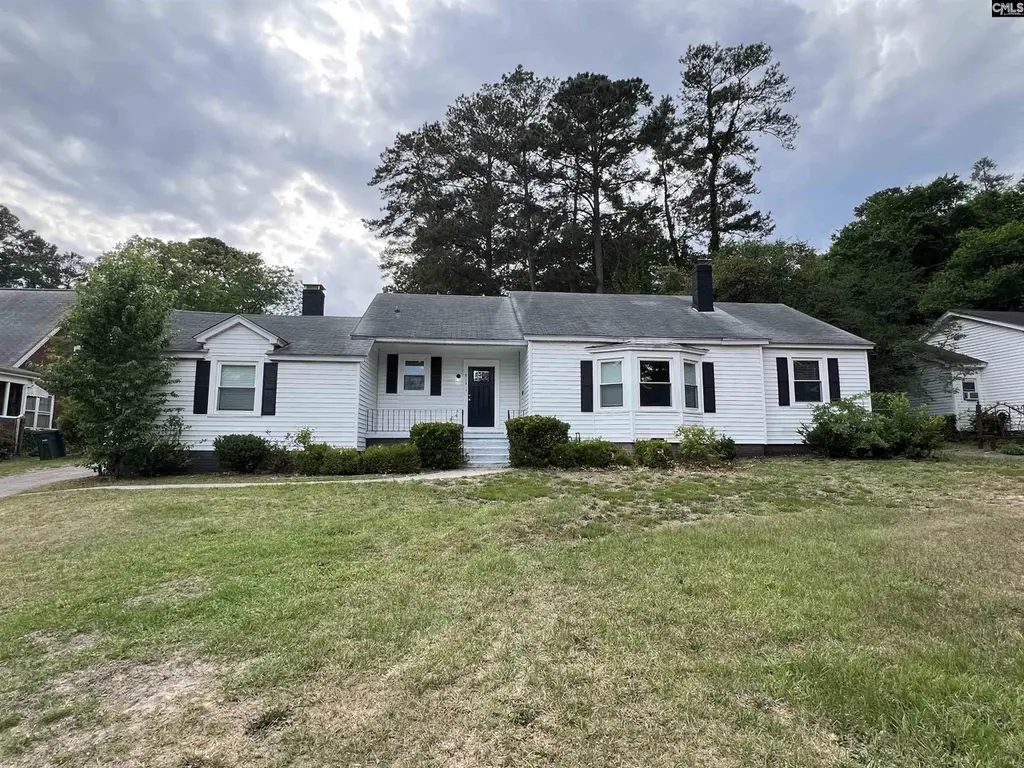
513 S Beltline Blvd · Columbia, SC
Flood risk 1/10 · Minimal
- FEMA flood zone
- X
- Chance of flooding over 30 yrs
- 0.0%
- Est. flood insurance / yr
- $435 – $905
Fire risk 2/10 · Minimal
- Est. fire insurance / yr
- $783 – $1,453
Heat risk 7/10 · Major
- Hot days now (above threshold)
- 7 days/yr
- Hot days in 30 yrs
- 16 days/yr
Wind risk No data
- Chance of severe wind over 30 yrs
- —
Air-quality risk No data
- Unhealthy air days now
- —
- Unhealthy air days in 30 yrs
- —
Risk factors via First Street. Map © Google.
Why this score? — see what drove the D grade
The composite is a weighted blend of 9 inputs, each scored 0–100. Each bar is that input's sub-score; the figure is the points it added to the 100-point composite (weight × sub-score).
- Cash flow +14.6/30.0
- ARV discount +7.5/15.0
- DSCR +4.5/10.0
- Rent growth +4.2/5.0
- 1% rule +4.1/10.0
- Livability +3.9/5.0
- Schools +2.6/10.0
- Condition / age +2.5/5.0
- Appreciation +0.0/10.0
$339,900
🖨 Deal sheet (PDF) 📄 Offer letter ✓ Due diligence
Listing remarks
Single-family residence located in the established Rosewood area, offering a highly convenient location just minutes from downtown Columbia, the University of South Carolina, and Fort Jackson. Situated along a primary corridor within a mature residential neighborhood, the property combines strong accessibility with the character of an established community. It typically features off-street driveway parking for added convenience. The interior layout is consistent with homes in the area, generally offering multiple bedrooms and bathrooms, functional living spaces, and a practical kitchen design with potential for updates that enhance comfort and appeal. The surrounding neighborhood is well-es
Key facts
- Mature landscaping
- 0.48 acre lot
- Garage
Tags
Property features AI
Exterior
- Parking: Garage at main level
- Utilities: Public water; Public sewer
- Home design: Single-story home
- Construction: Crawlspace foundation
- Exterior features: Vinyl exterior; Uncovered front porch; Shed; Paved road access; Approximately 0.48 acre lot
Interior
- Kitchen: Wood-natural cabinets; Dishwasher; Refrigerator; Gas range
- Bedrooms: Master bedroom on the main level; Second bedroom on the main level; Third bedroom on the main level
- Bathrooms: Two full bathrooms; One half bathroom
- Heating & cooling: Central heating; Central air conditioning
- Interior features: Ceiling fans; Two wood-burning fireplaces; Gas range
Neighborhood map
What this means for you Summary
Snapshot
- This is a 4-bed/3.0-bath single-family listed at $340k.
Deal economics
- At list price, monthly cash flow is $81 ($972/yr) — positive.
- The deal already cash-flows at list — no discount required.
- To meet the 1% rule (rent ≥ 1% of price), the offer needs to be $308k (9.3% below list).
- Recommended offer: $308k (9.3% below list) — sets the bar for 1% rule.
- Cap rate 6.6% vs local median 5.1% in Columbia — meaningfully above typical; check what's discounted (condition, days-on-market, listing class) to confirm the premium yield is real.
Location & tenants
- Location reads 78/100 on livability (#18 in SC, #2,436 nationally) — a middle-class / working-renter tenant base. Strengths: amenities A+, commute A+, cost of living A+; Watch: employment D, crime F.
- Richland 01 (urban): math 26% / reading 36% proficiency, ranked #54 of 80 in SC (top 68%) — families likely to look elsewhere, expect single-tenant / working-renter base with shorter leases; 64% free/reduced lunch — lower-income household profile, screen leases tightly.
- Zoned schools: South Kilbourne Elementary (math 12% / reading 17%, grade F, #553 of 597 statewide, top 95%, 296 students, 100% FRL); Hand Middle (math 29% / reading 37%, grade F, #116 of 229 statewide, top 51%, 652 students, 100% FRL); Dreher High (math 47% / reading 92%, grade B, #60 of 196 statewide, top 32%, 1,150 students, 100% FRL) — zoned schools average 100% FRL vs 64% district-wide (36 pts higher); higher-poverty schools than district average — tighter screening recommended.
- Market conditions: Rents rising fast (+7.0%/yr); 150 active listings in the ZIP; 5 comparable units currently listed for rent nearby; rentals at typical pace (median 25d on market — plan ~3-4 weeks tenant-placement turnaround); 3,472 units permitted in Richland County in 2024 (1,096 in 5+ unit buildings).
- At $3,084/mo this rent would consume 58% of the median local household income ($64k/yr) (locally 1372% of renters already pay >50% of income on rent) — very limited rent-growth headroom before tenants either downsize or default.
Forward outlook
- Local home prices are declining (-3.0%/yr); year-one equity from $2k of loan paydown is wiped out by about $10k of value loss. Plan a longer hold.
- Richland County population projected at +30% by 2050 — long-run rental-demand tailwind backs the buy-and-hold thesis.
Negotiation context
- It's been on market 16 days — a 2% lower offer ($335k) is reasonable based on typical stale-listing flexibility.
- 2 sale attempts since 5y ago with the ask held roughly flat each time — persistent listings suggest the price (not the market) is what's stuck; bring a comps-based counter.
- Current owner paid $60k; list at $340k implies a 466% gain — meaningful room to come down on a strong offer.
Risks & watch-outs
- Watch-outs: built in 1950 — expect roof / HVAC / electrical / plumbing capex.
- Climate carrying-cost: extreme-heat days projected 7→16/yr by 2055 (HVAC capex compounding) — expect insurance premiums to compound above CPI over the hold.
Questions for the listing agent
- Built in 1950 — when were the roof, HVAC, electrical panel, plumbing, and water heater last replaced?
- Is there a deadline driving the sale (1031 exchange, divorce, estate, relocation)? That informs how much negotiation room exists.
- Schools are D-rated, which usually means shorter tenancies and higher turnover. Who's the typical renter profile here, and what's been the actual vacancy rate?
- Crime grade is F in this area — have there been break-ins, vandalism, or insurance claims at this property in the last 3 years? What carrier currently insures it and at what premium?
- The area grade is low — what's the realistic commute time and amenity access for the typical tenant pool here? Any planned neighborhood developments (good or bad) we should know about?
- What's the average days-on-market for RENTAL listings here right now (not sales)? A rising rental-DOM trend means longer vacancies and softer asking-rent achievability than the comps imply.
- What's the recent tenant-quality profile in this submarket — average credit score on applications, eviction rate, late-payment / NSF rate, and stable-employment percentage? A property-management company in the area should have these aggregated.
- How much new for-sale + rental construction is in the pipeline within 1–3 miles? Heavy new supply typically softens prices + rents 12–24 months out; constrained supply supports both.
Investment metrics
- 1% rule
- 0.91% ✗
- Cap rate
- 6.58%
- Cash-on-cash
- 1.02%
- DSCR
- 1.05
- GRM
- 9.2
CMA / ARV
No comps found within radius.
Projected returns pro-forma
-3.0% appreciation · 6.95% rent growth · sell at horizon
- IRR
- -10.3%
- Equity multiple
- 0.61×
- Total profit
- $-37,129
- Equity at exit
- $50,680
- IRR
- 3.8%
- Equity multiple
- 1.33×
- Total profit
- $31,238
- Equity at exit
- $29,388
Cash invested: $95,172 (down + closing). Projections, not guarantees.
Landlord ↔ Tenant lean methodology
- Overall (STATE)
- 90 Strongly Landlord-Friendly
- State South Carolina
- 90 Strongly Landlord-Friendly · R+6
- County
- — inherits STATE
- City
- — inherits STATE
ZIP-level market 29205
- Rents YoY
- 7.0%
- Active inventory
- 150
- Price-to-rent
- 9.2×
Monthly cashflow live
- Estimated rent
- $3,084 medium interval (Pro) →
- Mortgage (P&I)
- −$1,782
- Tax from tax record
- −$431 /mo · $5,172/yr
- Insurance
- −$142
- HOA
- −$0
- Vacancy / Maint / Mgmt
- −$648
- Net cashflow
- $81
Break-even live
Sensitivity live
| Price | -10% $273 | -5% $177 | +0% $81 | +5% $-15 | +10% $-111 |
|---|---|---|---|---|---|
| Rent | -10% $-163 | -5% $-41 | +0% $81 | +5% $203 | +10% $325 |
| Rate | -1.0pp $252 | -0.5pp $167 | base $81 | +0.5pp $-7 | +1.0pp $-97 |
UW: 25.0% down · 7.5% · 30yr · 1.5% tax · 5.0% vac · 8.0% maint · 8.0% mgmt
Financing live
Cash to close
- Down payment
- $84,975
- Closing costs
- $10,197
- Reserves months
- —
- Total cash needed
- —
Loan-product check · same deal, 3 products live
Conventional
25% down · 7.5% · 30yr
- Down + closing
- —
- Monthly P&I
- —
- Monthly cashflow
- —
- DSCR
- —
- Eligible?
- —
Personal DTI + credit; lowest rate.
DSCR
20% down · 8.5% · 30yr
- Down + closing
- —
- Monthly P&I
- —
- Monthly cashflow
- —
- DSCR
- —
- Eligible?
- —
No personal income docs; deal must DSCR.
Hard money
10% down · 12.0% · 12mo
- Down + closing
- —
- Monthly P&I
- —
- Monthly cashflow
- —
- DSCR
- —
- Eligible?
- —
Short-term bridge; refi at stabilization.
Rent comps 5 comps
| Address | Beds | Baths | Sqft | Rent | $/sqft | DOM | Units | Dist |
|---|---|---|---|---|---|---|---|---|
| 3800 Overbrook Dr Columbia, SC | 4.0 | 2.0 | 1800 | $2,400 | $1.33 | 25d | 1 | 0.30mi |
| 3125 Heyward St Columbia, SC | 5.0 | 2.0 | 2292 | $5,000 | $2.18 | 25d | 1 | 0.96mi |
| 316 S Woodrow St Columbia, SC | 4.0 | 2.0 | 2206 | $4,000 | $1.81 | 25d | 1 | 1.37mi |
| 2821 Blossom St Columbia, SC | 4.0 | 3.0 | 2466 | $3,400 | $1.38 | 25d | 1 | 1.43mi |
| 2730 Blossom St Unit A Columbia, SC | 3.0 | 2.0 | 2700 | $1,700 | $0.63 | 25d | 1 | 1.49mi |
Listing history 11 events
-
2026-06-21days on market $339,900 Active 16 DOM
-
2026-06-18days on market $339,900 Active 13 DOM
-
2026-06-17days on market $339,900 Active 12 DOM
-
2026-06-16days on market $339,900 Active 11 DOM
-
2026-06-15days on market $339,900 Active 10 DOM
-
2026-06-14days on market $339,900 Active 8 DOM
-
2026-06-10days on market $339,900 Active 5 DOM
-
2026-06-09days on market $339,900 Active 4 DOM
-
2026-06-08days on market $339,900 Active 3 DOM
-
2026-06-07remarks 699-char remark
-
2026-06-07$339,900 Active 2 DOM
ⓘ Source: listings_history table (triggers on properties + properties_extension) + one-shot
backfill from property_details.listing_events for pre-trigger history.
Tax reassessment forecast SC · Resets to sale price
- Current annual tax
- $5,172 · $431/mo
- Projected year-2 tax
- $5,172 · $431/mo
- Expected delta
- $0/yr ($0/mo · 0.0%)
ⓘ Screening estimate from a state-policy table — verify with the county assessor before closing.
Climate risk First Street
- Flood 1/10 Low FEMA zone X · 0% chance over 30 yrs
- Wildfire 2/10 Low
- Heat 7/10 Severe
Nearby sold comps map
Loading sold comps map…
Walkable amenities ~0.75 mi
Loading nearby amenities…
Taxation est. · year 1
- Rental income
- $37,004
- − Mortgage interest
- −$19,040
- − Property taxes
- −$5,172
- − Insurance
- −$1,700
- − Repairs & maintenance
- −$2,960
- − Management
- −$2,960
- − Depreciation
- −$9,888
- Taxable loss
- −$4,716
- Est. tax savings @ 24.0%
- +$1,132
- After-tax cash flow
- $2,104/yr
For passive investors: Depreciation is non-cash, so a rental often shows a tax loss while cash-flowing — sheltering income. Rental losses are passive: they offset passive income freely, and up to $25,000/yr can offset ordinary (W-2) income if you actively participate and your MAGI is under $100k (phasing out to $0 by $150k); unused losses carry forward. On sale, claimed depreciation is recaptured at up to 25%, and gains may owe capital-gains tax (a 1031 exchange can defer both). Figures are a year-1 estimate at your 24.0% rate — not tax advice; consult a CPA.
Schools (NCES district)
- District
- Richland 01
- NCES district ID
- 4503360
- Math proficiency
- 26% ▼ -7.00%
- Reading proficiency
- 36% ▼ -5.00%
- Median HH income
- $38,931
- Composite
- 25.94/100
- National rank
- #7335
- State rank
- #54 of 80 in SC
Livability — Columbia
- Score
- 78/100
- State rank
- #18
- US rank
- #2436
Category grades
Schools grade is shown separately in the Schools card above.
Census & demographics
- County
- Richland County · 389,530 people
- City population
- 335,994
- Metro
- Columbia, SC
- Population (ZIP)
- 22,223
- Household income
- $64,231
- Rent vs Own
- Severe rent burden
- 1372.0
Population outlook (Richland County) Hauer SSP2
- Today (2025)
- 459,667 people
- By 2030
- 487,524 · +6.1%
- By 2040
- 542,035 · +17.9%
- By 2050
- 595,371 · +29.5%
- By 2075
- 732,998 · +59.5%
- By 2100
- 820,415 · +78.5%
Race, ethnicity, and origin ACS 2023
- Neighborhood character
- Predominantly White (73%)
- Race & ethnicity
- White 73% Black 16% Two or more races 6% Hispanic / Latino 5% Asian 3%
- Common ancestry
- Serbian 6% Slovak 4% Lithuanian 3%
- Foreign-born
- 4% · Canada, China
- Languages at home
- 93% English-only · Spanish 3% German/W. Germanic 1% Chinese 1%
Political lean MEDSL · Richland
- 2024 margin
- Solid D (+34.6) · D 66.4% · R 31.8% · Other 1.8%
- 2008→2024 swing
- +5.7pp toward D · 2008: 28.9pp · 2024: 34.6pp
- All cycles
- 2024: D+34.6 2020: D+38.3 2016: D+32.9 2012: D+33.3 2008: D+28.9
Not yet ingested
- Civics
- —
Market trends
- HPI YoY
- ▼ -457.47%
- Current HPI
- 230.5538
- Rent YoY
- ▲ 6.95%
- Metro
- Columbia, SC
- State GDP YoY
- ▲ 4.51%
- F500 in state
- 2
Industry mix (Fortune 500 HQ in SC)
| Industry | F500 HQs | Revenue |
|---|---|---|
| Packaging | 1 | $7B |
|
||
Price history
+466.5% since first listed4 events — show timeline
- 2026-06-05 Listed $339,900 Consolidated MLS
- 2021-09-20 Delisted — Consolidated MLS
- 2021-09-20 Listed $155,000 Consolidated MLS
- 1994-08-23 Sold (Public Records) $60,000 Public Records
Property tax history
+11.9%/yrLatest (2025): $5,172 · +2.5% YoY. Source: county tax records.
Cash-flow waterfall
monthlySold comps — $/sqft
last 12 mo · ≤1 miLoading sold comps…