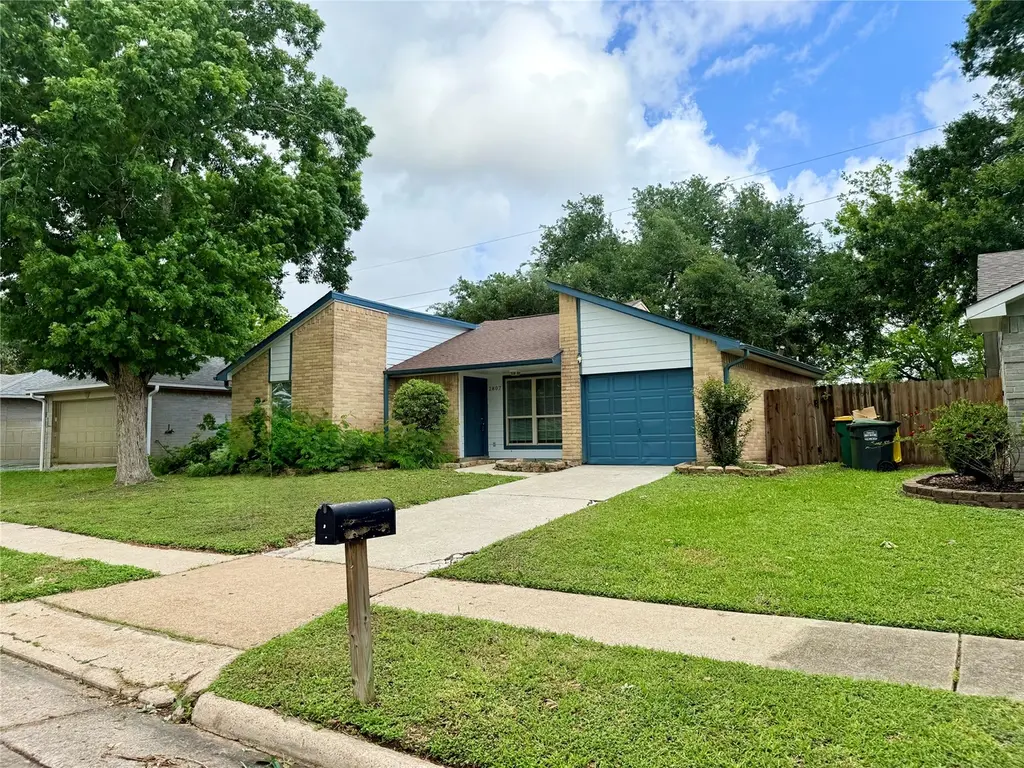
2807 N Brompton Dr · Pearland, TX
Flood risk 4/10 · Minor
- FEMA flood zone
- X (shaded)
- Chance of flooding over 30 yrs
- 0.24%
- Est. flood insurance / yr
- $507 – $1,088
Fire risk 1/10 · Minimal
- Est. fire insurance / yr
- $1,222 – $2,270
Heat risk 9/10 · Severe
- Hot days now (above 109°F)
- 7 days/yr
- Hot days in 30 yrs
- 23 days/yr
Wind risk 9/10 · Severe
- Chance of severe wind over 30 yrs
- 99.0%
Air-quality risk 2/10 · Minimal
- Unhealthy air days now
- 2 days/yr
- Unhealthy air days in 30 yrs
- 2 days/yr
Risk factors via First Street. Map © Google.
Why this score? — see what drove the D+ grade
The composite is a weighted blend of 9 inputs, each scored 0–100. Each bar is that input's sub-score; the figure is the points it added to the 100-point composite (weight × sub-score).
- ARV discount +14.2/15.0
- Cash flow +12.5/30.0
- Schools +5.4/10.0
- 1% rule +4.5/10.0
- Livability +4.0/5.0
- DSCR +3.7/10.0
- Rent growth +2.9/5.0
- Condition / age +2.5/5.0
- Appreciation +0.0/10.0
$189,900
🖨 Deal sheet 📄 Offer letter ✓ Due diligence
Listing remarks MLS
2-1-1 in a terrific Pearland location with no back neighbors. Ideal for investment or owner-occupancy. Convenient access to freeways, shopping, restaurants, and Pearland ISD. Solid opportunity with strong potential — don’t miss it.
Key facts
- Pearland isd
- Shopping
- No back neighbors
Tags
Neighborhood map
What this means for you Summary
Snapshot
- This is a 2-bed/1.0-bath single-family listed at $190k.
Deal economics
- At list price, monthly cash flow is $-27 ($-326/yr) — negative.
- To cash-flow at today's rent, offer at most $185k (2.5% below list).
- To meet the 1% rule (rent ≥ 1% of price), the offer needs to be $181k (4.8% below list).
- Recommended offer: $173k (9.0% below list) — sets the bar for market timing.
- Cap rate 6.1% vs local median 3.0% in Pearland — top-decile yield for the area; either an underpriced asset or a hidden risk that comps aren't pricing in. Stress-test before assuming the spread holds.
Location & tenants
- Location reads 81/100 on livability (#32 in TX, #1,539 nationally) — a professional / high-income tenant draw. Strengths: schools A+, employment A+, housing A+; Watch: amenities D-, commute F.
- Pearland ISD (suburban): math 58% / reading 59% proficiency, ranked #47 of 826 in TX (top 6%) — acceptable for families but not a draw, mixed tenant base, ~2y average lease.
- Market conditions: Rents rising (+1.5%/yr); 497 active listings in the ZIP; 19 comparable units currently listed for rent nearby; rentals leasing fast (median 10d on market — plan ~1-2 weeks tenant-placement turnaround); high-income renter base; 3,960 units permitted in Brazoria County in 2024 (593 in 5+ unit buildings).
- This rent is only 18% of the median local income ($122k/yr) — well below the 30% rent-burden line; pricing power to push rent on renewal without tenant pushback.
Forward outlook
- Local home prices are declining (-3.0%/yr); year-one equity from $1k of loan paydown is wiped out by about $6k of value loss. Plan a longer hold.
- Brazoria County population projected at +44% by 2050 — long-run rental-demand tailwind backs the buy-and-hold thesis.
Negotiation context
- It's been on market 99 days — a 9% lower offer ($173k) is reasonable based on typical stale-listing flexibility.
- 7 sale attempts since 11y ago; this cycle's ask has dropped $25k (12%) from the opening price — seller is motivated, your offer sets the floor, not the list.
- Current owner paid $54k; list at $190k implies a 252% gain — meaningful room to come down on a strong offer.
Risks & watch-outs
- Climate carrying-cost: severe wind risk, 99% chance of damaging wind over 30y; extreme-heat days projected 7→23/yr by 2055 (HVAC capex compounding) — expect insurance premiums to compound above CPI over the hold.
Questions for the listing agent
- What do current leases actually rent for vs. the listed asking? Can we see a recent rent roll and the last 12 months of T-12 income?
- It's been on market 99 days. Have you received any prior offers? Is the seller open to a 9% concession, seller financing, or rate buy-down credit?
- What does the HOA fee cover, when was the last increase, and are there any pending special assessments or reserve-fund shortfalls?
- Why hasn't it sold? Are there any deal-killer items the seller is aware of (foundation, flood, title, zoning, code violations)?
- Is there a deadline driving the sale (1031 exchange, divorce, estate, relocation)? That informs how much negotiation room exists.
- Schools are A-rated — typically a magnet for longer-tenancy family renters. What's the average tenant stay here, and is there a school-zone premium baked into asking?
- The area grade is low — what's the realistic commute time and amenity access for the typical tenant pool here? Any planned neighborhood developments (good or bad) we should know about?
- What's the average days-on-market for RENTAL listings here right now (not sales)? A rising rental-DOM trend means longer vacancies and softer asking-rent achievability than the comps imply.
- What's the recent tenant-quality profile in this submarket — average credit score on applications, eviction rate, late-payment / NSF rate, and stable-employment percentage? A property-management company in the area should have these aggregated.
- How much new for-sale + rental construction is in the pipeline within 1–3 miles? Heavy new supply typically softens prices + rents 12–24 months out; constrained supply supports both.
Investment metrics
- 1% rule
- 0.95% ✗
- Cap rate
- 6.12%
- Cash-on-cash
- -0.61%
- DSCR
- 0.97
- GRM
- 8.8
CMA / ARV
- ARV (median comp)
- $223,074
- List price
- $189,900
- Delta
- -14.87%
- Verdict
- UNDERPRICED
- Comps
- 20 within 1.0 mi
Show comp detail 12 sales within ~0.75 mi
| Address | Dist | Beds/Ba | Sqft | Sold | Price | $/sf | Match |
|---|---|---|---|---|---|---|---|
| 2807 N Brompton Dr | 0.00mi | 2/1.0 | 1,018 (0%) | 0mo | $189,900 | $187 | 100 |
| 2722 N Brompton Dr | 0.04mi | 2/1.0 | 1,018 (0%) | 15mo | $207,500 | $204 | 86 |
| 1006 W Brompton Dr | 0.22mi | 2/1.0 | 1,018 (0%) | 11mo | $213,500 | $210 | 81 |
| 2711 N Belgravia Dr | 0.10mi | 2/2.0 | 1,072 (+5%) | 3mo | $225,000 | $210 | 80 |
| 1114 Oxford Dr | 0.42mi | 2/1.0 | 1,025 (+1%) | 2mo | $160,000 | $156 | 78 |
| 2938 Helmsley Dr | 0.19mi | 2/1.0 | 1,018 (0%) | 19mo | $225,000 | $221 | 76 |
| 1023 E Belgravia Dr | 0.13mi | 3/1.5 (+1) | 1,089 (+7%) | 5mo | $240,000 | $220 | 71 |
| 2622 N Brompton Dr | 0.09mi | 3/1.5 (+1) | 1,089 (+7%) | 11mo | $230,000 | $211 | 68 |
| 1035 Oxford Dr | 0.42mi | 2/1.0 | 1,013 (-0%) | 15mo | $210,000 | $207 | 67 |
| 1034 W Brompton Dr | 0.23mi | 3/1.5 (+1) | 1,127 (+11%) | 9mo | $249,750 | $222 | 57 |
| 3102 S Peach Hollow Cir | 0.37mi | 2/1.0 | 904 (-11%) | 10mo | $197,800 | $219 | 56 |
| 914 W Primrose Meadows Cir | 0.47mi | 2/2.0 | 1,087 (+7%) | 16mo | $206,000 | $190 | 49 |
Match score weights: distance 35% · size 25% · config 20% · recency 20%. Top-matched comps best support the ARV.
Projected returns pro-forma
-3.0% appreciation · 1.47% rent growth · sell at horizon
- IRR
- -19.2%
- Equity multiple
- 0.34×
- Total profit
- $-35,126
- Equity at exit
- $28,315
- IRR
- -15.5%
- Equity multiple
- 0.19×
- Total profit
- $-43,253
- Equity at exit
- $16,419
Cash invested: $53,172 (down + closing). Projections, not guarantees.
Landlord ↔ Tenant lean methodology
- Overall (STATE)
- 87 Strongly Landlord-Friendly
- State Texas
- 87 Strongly Landlord-Friendly · R+5
- County
- — inherits STATE
- City
- — inherits STATE
ZIP-level market 77584
- Home prices YoY
- -18.7%
- Rents YoY
- 1.5%
- Active inventory
- 497
- Price-to-rent
- 8.8×
Monthly cashflow live
- Estimated rent
- $1,808 high interval (Pro) →
- Mortgage (P&I)
- −$996
- Tax from tax record
- −$359 /mo · $4,313/yr
- Insurance
- −$79
- HOA
- −$21
- Vacancy / Maint / Mgmt
- −$380
- Net cashflow
- $-27
Break-even live
UW: 25.0% down · 7.5% · 30yr · 1.5% tax · 5.0% vac · 8.0% maint · 8.0% mgmt
Financing live
Cash to close
- Down payment
- $47,475
- Closing costs
- $5,697
- Reserves months
- —
- Total cash needed
- —
Loan-product check · same deal, 3 products live
Conventional
25% down · 7.5% · 30yr
- Down + closing
- —
- Monthly P&I
- —
- Monthly cashflow
- —
- DSCR
- —
- Eligible?
- —
Personal DTI + credit; lowest rate.
DSCR
20% down · 8.5% · 30yr
- Down + closing
- —
- Monthly P&I
- —
- Monthly cashflow
- —
- DSCR
- —
- Eligible?
- —
No personal income docs; deal must DSCR.
Hard money
10% down · 12.0% · 12mo
- Down + closing
- —
- Monthly P&I
- —
- Monthly cashflow
- —
- DSCR
- —
- Eligible?
- —
Short-term bridge; refi at stabilization.
Rent comps 19 comps
| Address | Beds | Baths | Sqft | Rent | $/sqft | DOM | Units | Dist |
|---|---|---|---|---|---|---|---|---|
| 1126 W Belgravia Dr Pearland, TX | 3.0 | 2.0 | 1487 | $1,950 | $1.31 | 17d | 1 | 0.26mi |
| 11000 Shadow Creek Pkwy Pearland, TX | 2.0 | 2.0 | 1075 | $1,650 | $1.53 | 24d | 1 | 0.76mi |
| 2020 Business Center Dr Pearland, TX | 1.0–3.0 | 1.0–2.0 | 1138 | $2,184 | $1.92 | 2d | 57 | 0.81mi |
| 2406 Business Center Dr Pearland, TX | 2.0 | 2.0 | 1152 | $1,800 | $1.56 | 43d | 1 | 0.87mi |
| 2500 Business Center Dr Pearland, TX | 1.0–3.0 | 1.0–2.0 | 1071 | $1,650 | $1.54 | 2d | 23 | 0.96mi |
| 2506 Business Center Dr Pearland, TX | 2.0 | 2.0 | 1120 | $1,706 | $1.52 | 43d | 1 | 0.98mi |
| 2526 Business Center Dr Pearland, TX | 1.0–2.0 | 1.0–2.0 | 928 | $1,905 | $2.05 | 2d | 32 | 1.08mi |
| 1466 Ivy Park Ter Houston, TX | 2.0 | 1.0–2.0 | 843 | $2,360 | $2.80 | 2d | 20 | 1.15mi |
| 10006 Broadway St Pearland, TX | 3.0 | 2.0 | 1268 | $1,989 | $1.57 | 43d | 1 | 1.32mi |
| 10000 W Broadway St Unit 3174 Pearland, TX | 3.0 | 2.0 | 1268 | $1,880 | $1.48 | 10d | 1 | 1.38mi |
| 10000 W Broadway St Unit 10033 Pearland, TX | 3.0 | 2.0 | 1268 | $1,864 | $1.47 | 43d | 1 | 1.38mi |
| 10000 W Broadway St Unit 10037 Pearland, TX | 2.0 | 2.0 | 1085 | $1,603 | $1.48 | 10d | 1 | 1.38mi |
| 10000 W Broadway St Unit 424 Pearland, TX | 2.0 | 2.0 | 1085 | $1,579 | $1.46 | 5d | 1 | 1.38mi |
| 10000 W Broadway St Unit 3148 Pearland, TX | 3.0 | 2.0 | 1268 | $1,848 | $1.46 | 2d | 1 | 1.38mi |
| 10000 W Broadway St Unit 2112 Pearland, TX | 2.0 | 2.0 | 1085 | $1,571 | $1.45 | 2d | 1 | 1.38mi |
| 10000 W Broadway St Unit 10057 Pearland, TX | 2.0 | 2.0 | 943 | $1,434 | $1.52 | 43d | 1 | 1.38mi |
| 10000 Broadway St Pearland, TX | 2.0 | 2.0 | 1175 | $1,573 | $1.34 | 43d | 1 | 1.41mi |
| 9720 Broadway St Pearland, TX | 1.0–3.0 | 1.0–2.0 | 1065 | $1,692 | $1.59 | 1d | 21 | 1.43mi |
| 11900 Shadow Creek Pkwy Pearland, TX | 1.0–2.0 | 1.0–2.0 | 1053 | $1,899 | $1.80 | 1d | 34 | 1.47mi |
HOA detail
- Monthly dues
- $21 · $252/yr
Listing history 26 events
-
2026-05-17status Pending 244-char remark
Show marketing remark (244 chars)
2-1-1 in a terrific Pearland location with no back neighbors. Ideal for investment or owner-occupancy. Convenient access to freeways, shopping, restaurants, and Pearland ISD. Solid opportunity with strong potential — don’t miss it.
-
2026-05-12status Pending 244-char remark
Show marketing remark (244 chars)
2-1-1 in a terrific Pearland location with no back neighbors. Ideal for investment or owner-occupancy. Convenient access to freeways, shopping, restaurants, and Pearland ISD. Solid opportunity with strong potential — don’t miss it.
-
2026-05-11status Pending 244-char remark
Show marketing remark (244 chars)
2-1-1 in a terrific Pearland location with no back neighbors. Ideal for investment or owner-occupancy. Convenient access to freeways, shopping, restaurants, and Pearland ISD. Solid opportunity with strong potential — don’t miss it.
-
2026-05-06status Pending 244-char remark
Show marketing remark (244 chars)
2-1-1 in a terrific Pearland location with no back neighbors. Ideal for investment or owner-occupancy. Convenient access to freeways, shopping, restaurants, and Pearland ISD. Solid opportunity with strong potential — don’t miss it.
-
2026-04-29price $189,900 244-char remark
Show marketing remark (244 chars)
2-1-1 in a terrific Pearland location with no back neighbors. Ideal for investment or owner-occupancy. Convenient access to freeways, shopping, restaurants, and Pearland ISD. Solid opportunity with strong potential — don’t miss it.
-
2026-04-08price $199,900 244-char remark
Show marketing remark (244 chars)
2-1-1 in a terrific Pearland location with no back neighbors. Ideal for investment or owner-occupancy. Convenient access to freeways, shopping, restaurants, and Pearland ISD. Solid opportunity with strong potential — don’t miss it.
-
2026-03-01price $205,900 244-char remark
Show marketing remark (244 chars)
2-1-1 in a terrific Pearland location with no back neighbors. Ideal for investment or owner-occupancy. Convenient access to freeways, shopping, restaurants, and Pearland ISD. Solid opportunity with strong potential — don’t miss it.
-
2026-02-28status Active 244-char remark
Show marketing remark (244 chars)
2-1-1 in a terrific Pearland location with no back neighbors. Ideal for investment or owner-occupancy. Convenient access to freeways, shopping, restaurants, and Pearland ISD. Solid opportunity with strong potential — don’t miss it.
-
2026-02-20status Pending 244-char remark
Show marketing remark (244 chars)
2-1-1 in a terrific Pearland location with no back neighbors. Ideal for investment or owner-occupancy. Convenient access to freeways, shopping, restaurants, and Pearland ISD. Solid opportunity with strong potential — don’t miss it.
-
2026-02-04$215,000 Active 244-char remark
Show marketing remark (244 chars)
2-1-1 in a terrific Pearland location with no back neighbors. Ideal for investment or owner-occupancy. Convenient access to freeways, shopping, restaurants, and Pearland ISD. Solid opportunity with strong potential — don’t miss it.
-
2024-01-16historical $1,500
-
2023-10-14$1,500
-
2020-03-28status Option Pending
-
2020-03-28historical
-
2020-03-24$140,000 Active
-
2018-05-29soldstatus
-
2018-05-02soldstatus Sold
-
2018-04-24status Pending
-
2018-04-19status Option Pending
-
2018-04-17$135,000 Active
-
2015-07-14historical
-
2015-07-07status Active
-
2015-06-25status Option Pending
-
2015-06-17$110,000 Active
-
2006-01-24soldstatus
-
1995-11-17soldstatus $54,000
ⓘ Source: listings_history table (triggers on properties + properties_extension) + one-shot
backfill from property_details.listing_events for pre-trigger history.
Tax reassessment forecast TX · Resets to sale price
- Current annual tax
- $4,313 · $359/mo
- Projected year-2 tax
- $4,313 · $359/mo
- Expected delta
- $0/yr ($0/mo · 0.0%)
ⓘ Screening estimate from a state-policy table — verify with the county assessor before closing.
Climate risk First Street
- Flood 4/10 Moderate FEMA zone X (shaded) · 24% chance over 30 yrs
- Wildfire 1/10 Low
- Heat 9/10 Extreme 7 d/yr ≥109°F today · 23 d/yr by 30 yrs out
- Wind 9/10 Extreme 99% chance of damaging wind over 30 yrs
- Air quality 2/10 Low 2 unhealthy d/yr today · 2 by 30 yrs out
Nearby sold comps map
Loading sold comps map…
Walkable amenities ~0.75 mi
Loading nearby amenities…
Taxation est. · year 1
- Rental income
- $21,696
- − Mortgage interest
- −$10,637
- − Property taxes
- −$4,313
- − Insurance
- −$950
- − Repairs & maintenance
- −$1,736
- − Management
- −$1,736
- − HOA
- −$252
- − Depreciation
- −$5,524
- Taxable loss
- −$3,452
- Est. tax savings @ 24.0%
- +$829
- After-tax cash flow
- $503/yr
For passive investors: Depreciation is non-cash, so a rental often shows a tax loss while cash-flowing — sheltering income. Rental losses are passive: they offset passive income freely, and up to $25,000/yr can offset ordinary (W-2) income if you actively participate and your MAGI is under $100k (phasing out to $0 by $150k); unused losses carry forward. On sale, claimed depreciation is recaptured at up to 25%, and gains may owe capital-gains tax (a 1031 exchange can defer both). Figures are a year-1 estimate at your 24.0% rate — not tax advice; consult a CPA.
Schools (NCES district)
- District
- Pearland ISD
- NCES district ID
- 4834440
- Math proficiency
- 58% ▼ -13.00%
- Reading proficiency
- 59% ▼ -6.00%
- Median HH income
- $90,091
- Composite
- 53.67/100
- National rank
- #1430
- State rank
- #47 of 826 in TX
Livability — Pearland
- Score
- 81/100
- State rank
- #32
- US rank
- #1539
Category grades
Schools grade is shown separately in the Schools card above.
Census & demographics
- Census place
- Pearland, TX
- County
- Brazoria County · 374,982 people
- City population
- 142,397
- Metro
- Houston-The Woodlands-Sugar Land, TX
- Population (ZIP)
- 91,065
- Household income
- $121,872
- Rent vs Own
- Severe rent burden
- 1539.0
Population outlook (Brazoria County) Hauer SSP2
- Today (2025)
- 420,414 people
- By 2030
- 457,585 · +8.8%
- By 2040
- 532,232 · +26.6%
- By 2050
- 605,399 · +44.0%
- By 2075
- 779,358 · +85.4%
- By 2100
- 883,759 · +110.2%
Race, ethnicity, and origin ACS 2023
- Neighborhood character
- Highly diverse neighborhood (Simpson 0.76)
- Race & ethnicity
- White 32% Hispanic / Latino 22% Asian 21% Black 21% Two or more races 14%
- Hispanic origin (detail)
- Mexican 16% Puerto Rican 2%
- Common ancestry
- Lithuanian 2% Romanian 1% Slovak 1%
- Foreign-born
- 25% · Canada, China, Vietnam
- Languages at home
- 64% English-only · Spanish 14% Chinese 4% Other Indo-European 4%
Political lean MEDSL · Brazoria
- 2024 margin
- R (+19.7) · D 39.5% · R 59.2% · Other 1.3%
- 2008→2024 swing
- +9.9pp toward D · 2008: -29.6pp · 2024: -19.7pp
- All cycles
- 2024: R+19.7 2020: R+18.2 2016: R+24.6 2012: R+34.2 2008: R+29.6
Not yet ingested
- Civics
- —
Market trends
- HPI YoY
- ▼ -49.09%
- Current HPI
- 213.4011
- Rent YoY
- ▲ 1.47%
- Metro
- Houston-The Woodlands-Sugar Land, TX
- State GDP YoY
- ▲ 3.95%
- F500 in state
- 110
Industry mix (Fortune 500 HQ in TX)
| Industry | F500 HQs | Revenue |
|---|---|---|
| Energy | 16 | $1,198B |
|
||
| Technology | 5 | $198B |
|
||
| Engineering / Construction | 4 | $72B |
|
||
| Energy Services | 3 | $60B |
|
||
| Utilities | 3 | $41B |
|
||
| Healthcare | 2 | $330B |
|
||
Price history
+251.7% since first listed26 events — show timeline
- 2026-05-17 Pending — HARMLS
- 2026-05-12 Pending — HARMLS
- 2026-05-11 Pending — HARMLS
- 2026-05-06 Pending — HARMLS
- 2026-04-29 Price Changed $189,900 HARMLS
- 2026-04-08 Price Changed $199,900 HARMLS
- 2026-03-01 Price Changed $205,900 HARMLS
- 2026-02-28 Relisted — HARMLS
- 2026-02-20 Pending — HARMLS
- 2026-02-04 Listed $215,000 HARMLS
- 2024-01-16 Rental Removed $1,500 RENT.
- 2023-10-14 Listed for Rent $1,500 RENT.
- 2020-03-28 Pending — HARMLS
- 2020-03-28 Listing Removed — HARMLS
- 2020-03-24 Listed $140,000 HARMLS
- 2018-05-29 Sold (Public Records) — Public Records
- 2018-05-02 Sold (MLS) — HARMLS
- 2018-04-24 Pending — HARMLS
- 2018-04-19 Pending — HARMLS
- 2018-04-17 Listed $135,000 HARMLS
- 2015-07-14 Listing Removed — HARMLS
- 2015-07-07 Relisted — HARMLS
- 2015-06-25 Pending — HARMLS
- 2015-06-17 Listed $110,000 HARMLS
- 2006-01-24 Sold (Public Records) — Public Records
- 1995-11-17 Sold (Public Records) $54,000 Public Records
Property tax history
+4.1%/yrLatest (2025): $4,313 · -0.9% YoY. Source: county tax records.
Cash-flow waterfall
monthlySold comps — $/sqft
last 12 mo · ≤1 miLoading sold comps…