636 Marcus Ln · Crowley, TX
Flood risk No data
- FEMA flood zone
- —
- Chance of flooding over 30 yrs
- —
- Est. flood insurance / yr
- —
Fire risk No data
- Est. fire insurance / yr
- —
Heat risk No data
- Hot days now (above threshold)
- —
- Hot days in 30 yrs
- —
Wind risk No data
- Chance of severe wind over 30 yrs
- —
Air-quality risk No data
- Unhealthy air days now
- —
- Unhealthy air days in 30 yrs
- —
Risk factors via First Street. Map © Google.
Why this score? — see what drove the D- grade
The composite is a weighted blend of 9 inputs, each scored 0–100. Each bar is that input's sub-score; the figure is the points it added to the 100-point composite (weight × sub-score).
- Cash flow +11.3/30.0
- ARV discount +8.7/15.0
- Livability +3.8/5.0
- DSCR +3.3/10.0
- Rent growth +3.1/5.0
- Schools +2.5/10.0
- Condition / age +2.5/5.0
- 1% rule +2.3/10.0
- Appreciation +0.0/10.0
$295,940
🖨 Deal sheet (PDF) 📄 Offer letter ✓ Due diligence
Listing remarks MLS
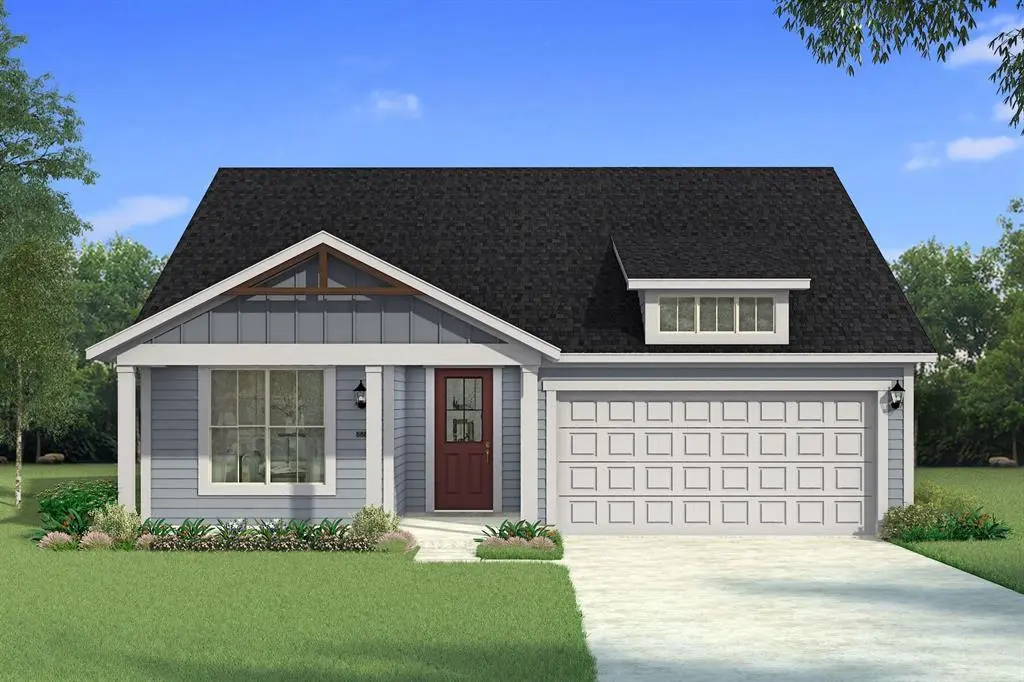
Built by Mattamy Homes - The Sarafina - Available Nov.! Don't Miss This Fabulous Lot That Backs to a Creek! The Sarafina floor plan is designed for comfort and efficiency, offering an open-concept layout perfect for modern living. The heart of the home is the spacious kitchen, featuring a central island with a breakfast bar and a walk-in pantry, all seamlessly connected to the Great Room and dining area, ideal for entertaining and everyday moments. The private owner’s suite serves as a peaceful retreat with dual vanities and a large walk-in closet. Two additional bedrooms are thoughtfully positioned at the front of the home, sharing a full bathroom, perfect for family or guests. Stylish, functional, and designed to fit your needs, the Sarafina brings together timeless appeal and modern convenience. This energy-efficient home includes ENERGY STAR® certified appliances, LED lighting, and a tankless water heater, combining comfort with sustainability. The Sarafina is thoughtfully crafted to enhance everyday living while meeting your modern lifestyle needs.
Key facts
- Central island
- Dual vanities
- Spacious kitchen
Tags
Neighborhood map
What this means for you Summary
Snapshot
- This is a 3-bed/2.0-bath other listed at $296k.
Deal economics
- At list price, monthly cash flow is $-111 ($-1k/yr) — negative.
- To cash-flow at today's rent, offer at most $276k (6.6% below list).
- To meet the 1% rule (rent ≥ 1% of price), the offer needs to be $217k (26.6% below list).
- Recommended offer: $217k (26.6% below list) — sets the bar for 1% rule.
- Cap rate 5.8% vs local median 4.5% in Crowley — top-decile yield for the area; either an underpriced asset or a hidden risk that comps aren't pricing in. Stress-test before assuming the spread holds.
Location & tenants
- Location reads 76/100 on livability (#103 in TX, #3,462 nationally) — a middle-class / working-renter tenant base. Strengths: cost of living A+, housing A+, health & safety A+; Watch: amenities F, commute F.
- Crowley ISD (urban): math 23% / reading 32% proficiency, ranked #643 of 826 in TX (top 78%) — low school quality limits family demand, transient renter base, plan for 1-2y turnover.
- Zoned schools: Bess Race El (math 28% / reading 32%, grade F, #2,500 of 4,322 statewide, top 58%, 665 students, 77% FRL); H F Stevens Middle (math 16% / reading 26%, grade F, #1,387 of 1,662 statewide, top 85%, 747 students, 84% FRL); Crowley H S (math 23% / reading 36%, grade F, #1,112 of 1,632 statewide, top 70%, 2,351 students, 72% FRL) — zoned schools average 78% FRL vs 52% district-wide (26 pts higher); higher-poverty schools than district average — tighter screening recommended.
- Market conditions: Rents rising (+2.3%/yr); 1036 active listings in the ZIP; 40 comparable units currently listed for rent nearby; rentals at typical pace (median 24d on market — plan ~3-4 weeks tenant-placement turnaround); solid renter incomes; 18,938 units permitted in Tarrant County in 2024 (8,336 in 5+ unit buildings).
Forward outlook
- Local home prices are declining (-3.0%/yr); year-one equity from $2k of loan paydown is wiped out by about $9k of value loss. Plan a longer hold.
- Tarrant County population projected at +41% by 2050 — long-run rental-demand tailwind backs the buy-and-hold thesis.
Negotiation context
- It's been on market 86 days — a 6% lower offer ($278k) is reasonable based on typical stale-listing flexibility.
Questions for the listing agent
- What do current leases actually rent for vs. the listed asking? Can we see a recent rent roll and the last 12 months of T-12 income?
- It's been on market 86 days. Have you received any prior offers? Is the seller open to a 27% concession, seller financing, or rate buy-down credit?
- What does the HOA fee cover, when was the last increase, and are there any pending special assessments or reserve-fund shortfalls?
- Why hasn't it sold? Are there any deal-killer items the seller is aware of (foundation, flood, title, zoning, code violations)?
- Is there a deadline driving the sale (1031 exchange, divorce, estate, relocation)? That informs how much negotiation room exists.
- Schools are D-rated, which usually means shorter tenancies and higher turnover. Who's the typical renter profile here, and what's been the actual vacancy rate?
- The area grade is low — what's the realistic commute time and amenity access for the typical tenant pool here? Any planned neighborhood developments (good or bad) we should know about?
- What's the average days-on-market for RENTAL listings here right now (not sales)? A rising rental-DOM trend means longer vacancies and softer asking-rent achievability than the comps imply.
- What's the recent tenant-quality profile in this submarket — average credit score on applications, eviction rate, late-payment / NSF rate, and stable-employment percentage? A property-management company in the area should have these aggregated.
- How much new for-sale + rental construction is in the pipeline within 1–3 miles? Heavy new supply typically softens prices + rents 12–24 months out; constrained supply supports both.
Investment metrics
- 1% rule
- 0.73% ✗
- Cap rate
- 5.84%
- Cash-on-cash
- -1.60%
- DSCR
- 0.93
- GRM
- 11.4
CMA / ARV
- ARV (median comp)
- $304,028
- List price
- $295,940
- Delta
- -2.66%
- Verdict
- FAIR
- Comps
- 20 within 1.0 mi
Projected returns pro-forma
-3.0% appreciation · 2.28% rent growth · sell at horizon
- IRR
- -19.7%
- Equity multiple
- 0.32×
- Total profit
- $-56,673
- Equity at exit
- $44,126
- IRR
- -14.1%
- Equity multiple
- 0.21×
- Total profit
- $-65,164
- Equity at exit
- $25,587
Cash invested: $82,863 (down + closing). Projections, not guarantees.
Landlord ↔ Tenant lean methodology
- Overall (STATE)
- 87 Strongly Landlord-Friendly
- State Texas
- 87 Strongly Landlord-Friendly · R+5
- County
- — inherits STATE
- City
- — inherits STATE
ZIP-level market 76036
- Home prices YoY
- -25.2%
- Rents YoY
- 2.3%
- Active inventory
- 1036
- Price-to-rent
- 11.4×
Monthly cashflow live
- Estimated rent
- $2,173 high interval (Pro) →
- Mortgage (P&I)
- −$1,552
- Tax from tax record
- −$110 /mo · $1,319/yr
- Insurance
- −$123
- HOA
- −$42
- Vacancy / Maint / Mgmt
- −$456
- Net cashflow
- $-111
Break-even live
Sensitivity live
| Price | -10% $57 | -5% $-27 | +0% $-111 | +5% $-195 | +10% $-278 |
|---|---|---|---|---|---|
| Rent | -10% $-282 | -5% $-197 | +0% $-111 | +5% $-25 | +10% $61 |
| Rate | -1.0pp $38 | -0.5pp $-35 | base $-111 | +0.5pp $-187 | +1.0pp $-265 |
UW: 25.0% down · 7.5% · 30yr · 1.5% tax · 5.0% vac · 8.0% maint · 8.0% mgmt
Financing live
Cash to close
- Down payment
- $73,985
- Closing costs
- $8,878
- Reserves months
- —
- Total cash needed
- —
Loan-product check · same deal, 3 products live
Conventional
25% down · 7.5% · 30yr
- Down + closing
- —
- Monthly P&I
- —
- Monthly cashflow
- —
- DSCR
- —
- Eligible?
- —
Personal DTI + credit; lowest rate.
DSCR
20% down · 8.5% · 30yr
- Down + closing
- —
- Monthly P&I
- —
- Monthly cashflow
- —
- DSCR
- —
- Eligible?
- —
No personal income docs; deal must DSCR.
Hard money
10% down · 12.0% · 12mo
- Down + closing
- —
- Monthly P&I
- —
- Monthly cashflow
- —
- DSCR
- —
- Eligible?
- —
Short-term bridge; refi at stabilization.
Rent comps 40 comps
| Address | Beds | Baths | Sqft | Rent | $/sqft | DOM | Units | Dist |
|---|---|---|---|---|---|---|---|---|
| 1113 Switchgrass Ln Crowley, TX | 3.0 | 2.5 | 2196 | $2,195 | $1.00 | 45d | 1 | 0.16mi |
| 1108 Boxwood Dr Crowley, TX | 3.0 | 2.0 | 1373 | $1,940 | $1.41 | 0d | 1 | 0.18mi |
| 1149 Beaverwood Ln Crowley, TX | 3.0 | 2.0 | 1552 | $1,895 | $1.22 | 14d | 1 | 0.28mi |
| 1157 Beaverwood Ln Crowley, TX | 4.0 | 3.0 | 2244 | $2,200 | $0.98 | 45d | 1 | 0.31mi |
| 1017 Wheatfield Ln Crowley, TX | 3.0 | 2.0 | 1552 | $2,145 | $1.38 | 23d | 1 | 0.31mi |
| 1208 Boxwood Dr Crowley, TX | 3.0 | 2.0 | 1677 | $2,095 | $1.25 | 26d | 1 | 0.32mi |
| 412 Riverbed Dr Crowley, TX | 3.0 | 2.0 | 1638 | $2,100 | $1.28 | 45d | 1 | 0.33mi |
| 672 S Heights Dr Crowley, TX | 4.0 | 3.0 | 2136 | $2,345 | $1.10 | 23d | 1 | 0.38mi |
| 1213 Gardenia Ln Crowley, TX | 3.0 | 2.0 | 1501 | $2,170 | $1.45 | 45d | 1 | 0.39mi |
| 573 Creekbend St Crowley, TX | 3.0 | 2.0 | 1874 | $2,235 | $1.19 | 0d | 1 | 0.42mi |
| 1137 Junegrass Ln Crowley, TX | 3.0 | 2.0 | 1768 | $2,150 | $1.22 | 45d | 1 | 0.42mi |
| 1420 Mackinac Dr Crowley, TX | 3.0 | 2.0 | 1592 | $2,500 | $1.57 | 0d | 1 | 0.43mi |
| 668 Stern Dr Unit 1 Crowley, TX | 2.0 | 2.0 | 1150 | $1,525 | $1.33 | 26d | 1 | 0.44mi |
| 305 W Farm 1187 Unit 30421 Crowley, TX | 2.0 | 2.0 | 1200 | $1,599 | $1.33 | 14d | 1 | 0.45mi |
| 305 W FM 1187 Crowley, TX | 1.0–3.0 | 1.0–2.0 | 1181 | $4,194 | $3.55 | 0d | 28 | 0.45mi |
| 305 W FM 1187 Crowley, TX | 2.0 | 2.0 | 1190 | $1,500 | $1.26 | 14d | 1 | 0.45mi |
| 496 Canvas Ct Crowley, TX | 2.0 | 2.0 | 1135 | $1,575 | $1.39 | 45d | 1 | 0.47mi |
| 636 Horn St Crowley, TX | 3.0 | 2.0 | 1804 | $1,980 | $1.10 | 7d | 1 | 0.49mi |
| 473 Canvas Ct Crowley, TX | 3.0 | 2.0 | 1211 | $1,650 | $1.36 | 45d | 1 | 0.51mi |
| 520 Horn St Crowley, TX | 4.0 | 2.5 | 2095 | $2,290 | $1.09 | 26d | 1 | 0.59mi |
| 1800 Tyne Way Crowley, TX | 3.0 | 2.0 | 1552 | $2,100 | $1.35 | 45d | 1 | 0.62mi |
| 1400 S Crowley Rd Crowley, TX | 1.0–2.0 | 1.0–2.0 | 1071 | $1,744 | $1.63 | 23d | 12 | 0.62mi |
| 432 Canoe Way Crowley, TX | 3.0 | 2.0 | 1589 | $1,945 | $1.22 | 0d | 1 | 0.62mi |
| 404 Canoe Way Crowley, TX | 4.0 | 2.0 | 1827 | $2,195 | $1.20 | 21d | 1 | 0.72mi |
| 709 Daniels Dr Crowley, TX | 3.0 | 2.0 | 1418 | $2,040 | $1.44 | 0d | 1 | 0.73mi |
| 701 Daniels Dr Crowley, TX | 3.0 | 2.0 | 1232 | $1,850 | $1.50 | 22d | 1 | 0.76mi |
| 4004 Millau Ln Crowley, TX | 3.0 | 2.0 | 1905 | $2,075 | $1.09 | 7d | 1 | 0.77mi |
| 601 Porter Ave Crowley, TX | 3.0 | 2.0 | 1563 | $2,195 | $1.40 | 45d | 1 | 0.78mi |
| 4117 Tobin Dr Crowley, TX | 3.0 | 2.5 | 1900 | $2,295 | $1.21 | 3d | 1 | 0.78mi |
| 4118 Tobin Dr Crowley, TX | 4.0 | 2.5 | 2139 | $2,495 | $1.17 | 45d | 1 | 0.79mi |
| 4144 Tower Ln Crowley, TX | 3.0 | 2.0 | 1528 | $2,175 | $1.42 | 3d | 1 | 0.80mi |
| 4017 Millau Ln Crowley, TX | 4.0 | 2.0 | 1951 | $2,600 | $1.33 | 45d | 1 | 0.80mi |
| 509 S Beverly St Unit 3 Crowley, TX | 2.0 | 1.5 | 1136 | $1,350 | $1.19 | 0d | 1 | 0.81mi |
| 305 Wilson St Crowley, TX | 2.0 | 2.0 | 1400 | $1,950 | $1.39 | 26d | 1 | 0.82mi |
| 4212 Pont du Gard Way Crowley, TX | 3.0 | 2.0 | 1720 | $6,100 | $3.55 | 45d | 1 | 0.84mi |
| 1136 Park Gln Crowley, TX | 3.0 | 2.0 | 1487 | $2,000 | $1.34 | 14d | 1 | 0.85mi |
| 4140 Tobin Dr Crowley, TX | 3.0 | 2.5 | 1900 | $2,395 | $1.26 | 45d | 1 | 0.85mi |
| 304 S Magnolia St Apt D Crowley, TX | 3.0 | 2.0 | 1064 | $1,300 | $1.22 | 0d | 1 | 0.93mi |
| 4226 Tobin Dr Crowley, TX | 3.0–4.0 | 2.5 | 2019 | $2,395 | $1.19 | 0d | 5 | 0.94mi |
| 1057 W Golden Ln Burleson, TX | 2.0 | 2.5 | 1914 | $2,195 | $1.15 | 0d | 1 | 0.95mi |
HOA detail
- Monthly dues
- $42 · $504/yr
- Likely covers
- water
Listing history 17 events
-
2026-06-21days on market $295,940 Active 86 DOM
-
2026-06-18days on market $295,940 Active 83 DOM
-
2026-06-17days on market $295,940 Active 82 DOM
-
2026-06-16days on market $295,940 Active 81 DOM
-
2026-06-15days on market $295,940 Active 80 DOM
-
2026-06-13days on market $295,940 Active 78 DOM
-
2026-06-13days on market $295,940 Active 77 DOM
-
2026-06-09days on market $295,940 Active 74 DOM
-
2026-06-08days on market $295,940 Active 73 DOM
-
2026-06-07days on market $295,940 Active 72 DOM
-
2026-06-04days on market $295,940 Active 69 DOM
-
2026-06-03days on market $295,940 Active 68 DOM
-
2026-06-02days on market $295,940 Active 67 DOM
-
2026-06-01days on market $295,940 Active 66 DOM
-
2026-05-31days on market $295,940 Active 65 DOM
-
2026-05-08price $295,940 1079-char remark
Show marketing remark (1079 chars)
Built by Mattamy Homes - The Sarafina - Available Nov.! Don't Miss This Fabulous Lot That Backs to a Creek! The Sarafina floor plan is designed for comfort and efficiency, offering an open-concept layout perfect for modern living. The heart of the home is the spacious kitchen, featuring a central island with a breakfast bar and a walk-in pantry, all seamlessly connected to the Great Room and dining area, ideal for entertaining and everyday moments. The private owner’s suite serves as a peaceful retreat with dual vanities and a large walk-in closet. Two additional bedrooms are thoughtfully positioned at the front of the home, sharing a full bathroom, perfect for family or guests. Stylish, functional, and designed to fit your needs, the Sarafina brings together timeless appeal and modern convenience. This energy-efficient home includes ENERGY STAR® certified appliances, LED lighting, and a tankless water heater, combining comfort with sustainability. The Sarafina is thoughtfully crafted to enhance everyday living while meeting your modern lifestyle needs.
-
2026-03-28$292,990 Active 1079-char remark
Show marketing remark (1079 chars)
Built by Mattamy Homes - The Sarafina - Available Nov.! Don't Miss This Fabulous Lot That Backs to a Creek! The Sarafina floor plan is designed for comfort and efficiency, offering an open-concept layout perfect for modern living. The heart of the home is the spacious kitchen, featuring a central island with a breakfast bar and a walk-in pantry, all seamlessly connected to the Great Room and dining area, ideal for entertaining and everyday moments. The private owner’s suite serves as a peaceful retreat with dual vanities and a large walk-in closet. Two additional bedrooms are thoughtfully positioned at the front of the home, sharing a full bathroom, perfect for family or guests. Stylish, functional, and designed to fit your needs, the Sarafina brings together timeless appeal and modern convenience. This energy-efficient home includes ENERGY STAR® certified appliances, LED lighting, and a tankless water heater, combining comfort with sustainability. The Sarafina is thoughtfully crafted to enhance everyday living while meeting your modern lifestyle needs.
ⓘ Source: listings_history table (triggers on properties + properties_extension) + one-shot
backfill from property_details.listing_events for pre-trigger history.
Tax reassessment forecast TX · Resets to sale price
- Current annual tax
- $1,319 · $110/mo
- Projected year-2 tax
- $5,416 · $451/mo
- Expected delta
- +$4,096/yr (+$341/mo · 310.4%)
ⓘ Screening estimate from a state-policy table — verify with the county assessor before closing.
Nearby sold comps map
Loading sold comps map…
Walkable amenities ~0.75 mi
Loading nearby amenities…
Taxation est. · year 1
- Rental income
- $26,073
- − Mortgage interest
- −$16,577
- − Property taxes
- −$1,319
- − Insurance
- −$1,480
- − Repairs & maintenance
- −$2,086
- − Management
- −$2,086
- − HOA
- −$504
- − Depreciation
- −$8,609
- Taxable loss
- −$6,588
- Est. tax savings @ 24.0%
- +$1,581
- After-tax cash flow
- $252/yr
For passive investors: Depreciation is non-cash, so a rental often shows a tax loss while cash-flowing — sheltering income. Rental losses are passive: they offset passive income freely, and up to $25,000/yr can offset ordinary (W-2) income if you actively participate and your MAGI is under $100k (phasing out to $0 by $150k); unused losses carry forward. On sale, claimed depreciation is recaptured at up to 25%, and gains may owe capital-gains tax (a 1031 exchange can defer both). Figures are a year-1 estimate at your 24.0% rate — not tax advice; consult a CPA.
Schools (NCES district)
- District
- Crowley ISD
- NCES district ID
- 4815910
- Math proficiency
- 23% ▼ -15.00%
- Reading proficiency
- 32% ▼ -6.00%
- Median HH income
- $59,810
- Composite
- 25.04/100
- National rank
- #7549
- State rank
- #643 of 826 in TX
Livability — Crowley
- Score
- 76/100
- State rank
- #103
- US rank
- #3462
Category grades
Schools grade is shown separately in the Schools card above.
Census & demographics
- Census place
- Crowley, TX
- County
- Tarrant County · 2,033,669 people
- City population
- 36,044
- Metro
- Dallas-Fort Worth-Arlington, TX
- Population (ZIP)
- 36,044
- Household income
- $97,973
- Rent vs Own
- Severe rent burden
- 584.0
Population outlook (Tarrant County) Hauer SSP2
- Today (2025)
- 2,380,417 people
- By 2030
- 2,578,900 · +8.3%
- By 2040
- 2,974,995 · +25.0%
- By 2050
- 3,350,489 · +40.8%
- By 2075
- 4,216,909 · +77.2%
- By 2100
- 4,741,527 · +99.2%
Race, ethnicity, and origin ACS 2023
- Neighborhood character
- Diverse neighborhood (Simpson 0.65)
- Race & ethnicity
- White 48% Hispanic / Latino 28% Black 20% Two or more races 14% Asian 2%
- Hispanic origin (detail)
- Mexican 23% Puerto Rican 2%
- Common ancestry
- Slovak 3% Italian 2% Serbian 1%
- Foreign-born
- 8% · Canada, Vietnam
- Languages at home
- 79% English-only · Spanish 18% Other Indo-European 1% Vietnamese 1%
Political lean MEDSL · Tarrant
- 2024 margin
- Lean R (+5.1) · D 46.7% · R 51.9% · Other 1.4%
- 2008→2024 swing
- +6.6pp toward D · 2008: -11.7pp · 2024: -5.1pp
- All cycles
- 2024: R+5.1 2020: D+0.2 2016: R+8.7 2012: R+15.7 2008: R+11.7
Not yet ingested
- Civics
- —
Market trends
- HPI YoY
- ▼ -80.45%
- Current HPI
- 238.6365
- Rent YoY
- ▲ 2.28%
- Metro
- Dallas-Fort Worth-Arlington, TX
- State GDP YoY
- ▲ 3.95%
- F500 in state
- 110
Industry mix (Fortune 500 HQ in TX)
| Industry | F500 HQs | Revenue |
|---|---|---|
| Energy | 16 | $1,198B |
|
||
| Technology | 5 | $198B |
|
||
| Engineering / Construction | 4 | $72B |
|
||
| Energy Services | 3 | $60B |
|
||
| Utilities | 3 | $41B |
|
||
| Healthcare | 2 | $330B |
|
||
Price history
+1.0% since first listed2 events — show timeline
- 2026-05-08 Price Changed $295,940 NTREIS
- 2026-03-28 Listed $292,990 NTREIS
Property tax history
+0.4%/yrLatest (2025): $1,319 · +0.4% YoY. Source: county tax records.
Cash-flow waterfall
monthlySold comps — $/sqft
last 12 mo · ≤1 miLoading sold comps…