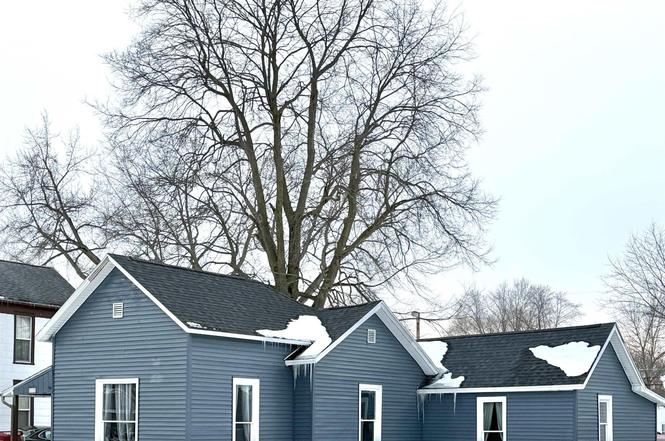
172 N Main St · Andrews, IN
Flood risk 1/10 · Minimal
- FEMA flood zone
- X (unshaded)
- Chance of flooding over 30 yrs
- 0.0%
- Est. flood insurance / yr
- $507 – $1,088
Fire risk 1/10 · Minimal
- Est. fire insurance / yr
- $717 – $1,331
Heat risk 3/10 · Minor
- Hot days now (above 102°F)
- 7 days/yr
- Hot days in 30 yrs
- 17 days/yr
Wind risk 2/10 · Minimal
- Chance of severe wind over 30 yrs
- —
Air-quality risk 3/10 · Minor
- Unhealthy air days now
- 1 days/yr
- Unhealthy air days in 30 yrs
- 3 days/yr
Risk factors via First Street. Map © Google.
Why this score? — see what drove the B grade
The composite is a weighted blend of 9 inputs, each scored 0–100. Each bar is that input's sub-score; the figure is the points it added to the 100-point composite (weight × sub-score).
- Cash flow +23.7/30.0
- ARV discount +15.0/15.0
- Appreciation +7.7/10.0
- DSCR +7.6/10.0
- 1% rule +6.0/10.0
- Livability +3.3/5.0
- Schools +3.1/10.0
- Rent growth +2.5/5.0
- Condition / age +2.5/5.0
$89,500
🖨 Deal sheet 📄 Offer letter ✓ Due diligence
Listing remarks
Move right in this renovated home located just inside Andrews. Fresh paint, new flooring, updated and remodeled kitchen, laundry room and full bath. Enjoy lots of hot water with the new tankless water heater. Spacious laundry room is also updated with plenty of space for extra storage and includes a washer/electric dryer hook up as well as sliding glass doors to back yard. Kitchen is a dream with fresh paint, new vinyl plank flooring, new cabinets with lights under top cabinets. The butcher block counters and ceramic back splash and trim make a perfect combination. Third bedroom is conveniently located right off the kitchen so can be used as either a dining area or bedroom. There are 4 moti
Key facts
- Renovated home
- Updated kitchen
- Ceramic back splash
Tags
Property features AI
Exterior
- Parking: Shared driveway
- Utilities: Public water; Public sewer
- Home design: Single-family residence; Site-built home; 1 story
- Construction: Vinyl siding; Asphalt roof; Crawl space foundation; Built as site-built construction
- Exterior features: Covered porch
Interior
- Kitchen: Dishwasher; Microwave; Refrigerator; Electric range
- Flooring: Carpet; Laminate
- Bathrooms: 1 full bathroom (main level)
- Heating & cooling: Natural gas forced air heating; Central air conditioning
- Interior features: Laminate counters; Tankless water heater
- Laundry & utility: Washer hookup; Electric dryer hookup (main level); Water heater
Neighborhood map
What this means for you Summary
Snapshot
- This is a 2-bed/1.0-bath single-family listed at $90k.
Deal economics
- At list price, monthly cash flow is $170 ($2k/yr) — positive.
- The deal already cash-flows at list — no discount required.
- Meets the 1% rule at list price ($987 rent vs $90k).
- Recommended offer: $79k (12.0% below list) — sets the bar for market timing.
Location & tenants
- Location reads 66/100 on livability (#274 in IN) — a middle-class / working-renter tenant base. Strengths: crime A+, cost of living A+, housing A+; Watch: health & safety C-, employment D+, amenities F.
- Huntington County Community School Corporation (rural): math 34% / reading 39% proficiency, ranked #176 of 301 in IN (top 58%) — families likely to look elsewhere, expect single-tenant / working-renter base with shorter leases.
- Zoned schools: Andrews Elementary School (math 47% / reading 37%, grade F, #434 of 994 statewide, top 48%, 316 students, 45% FRL); Riverview School (math 29% / reading 40%, grade F, #167 of 330 statewide, top 52%, 503 students, 54% FRL); Huntington North High School (math 30% / reading 55%, grade F, #195 of 369 statewide, top 53%, 1,424 students, 42% FRL).
- Market conditions: 9 active listings in the ZIP; 79 units permitted in Huntington County in 2024 (0 in 5+ unit buildings).
Forward outlook
- In year one you build about $5k of equity ($619 loan paydown + $5k appreciation (5.4% local appreciation)).
- Huntington County population projected at -14% by 2050 — secular population decline; favor cash flow + early exit over multi-decade hold.
- At projected returns (5.4% appreciation + 3.0% rent growth), your $25k cash investment doubles in ~4 years — after that, you're playing with house money.
- By year 7, paydown + projected appreciation supports a ~$35k cash-out refi (75% LTV) — recoverable capital for the next deal without selling this one.
Negotiation context
- It's been on market 124 days — a 12% lower offer ($79k) is reasonable based on typical stale-listing flexibility.
- 2 sale attempts; this cycle's ask has dropped $40k (31%) from the opening price — seller is motivated, your offer sets the floor, not the list.
- Current owner paid $10k; list at $90k implies a 795% gain — meaningful room to come down on a strong offer.
Risks & watch-outs
- Watch-outs: built in 1900 — expect roof / HVAC / electrical / plumbing capex.
Questions for the listing agent
- It's been on market 124 days. Have you received any prior offers? Is the seller open to a 12% concession, seller financing, or rate buy-down credit?
- Built in 1900 — when were the roof, HVAC, electrical panel, plumbing, and water heater last replaced?
- Why hasn't it sold? Are there any deal-killer items the seller is aware of (foundation, flood, title, zoning, code violations)?
- Is there a deadline driving the sale (1031 exchange, divorce, estate, relocation)? That informs how much negotiation room exists.
- Schools are D-rated, which usually means shorter tenancies and higher turnover. Who's the typical renter profile here, and what's been the actual vacancy rate?
- What's the average days-on-market for RENTAL listings here right now (not sales)? A rising rental-DOM trend means longer vacancies and softer asking-rent achievability than the comps imply.
- What's the recent tenant-quality profile in this submarket — average credit score on applications, eviction rate, late-payment / NSF rate, and stable-employment percentage? A property-management company in the area should have these aggregated.
- How much new for-sale + rental construction is in the pipeline within 1–3 miles? Heavy new supply typically softens prices + rents 12–24 months out; constrained supply supports both.
Investment metrics
- 1% rule
- 1.10% ✓
- Cap rate
- 8.57%
- Cash-on-cash
- 8.12%
- DSCR
- 1.36
- GRM
- 7.6
CMA / ARV
- ARV (on-the-fly)
- $112,700
- Comps found
- 9
Show comp detail 9 sales within ~0.75 mi
| Address | Dist | Beds/Ba | Sqft | Sold | Price | $/sf | Match |
|---|---|---|---|---|---|---|---|
| 172 N Main St | 0.00mi | 3/1.0 (+1) | 1,127 (0%) | 0mo | $91,500 | $81 | 95 |
| 288 N Main St | 0.06mi | 2/1.5 | 1,160 (+3%) | 2mo | $75,000 | $65 | 88 |
| 68 S Maple St | 0.25mi | 2/1.0 | 1,104 (-2%) | 13mo | $60,000 | $54 | 74 |
| 791 N Main St | 0.35mi | 2/1.0 | 1,160 (+3%) | 7mo | $119,900 | $103 | 73 |
| 874 N Jackson St | 0.42mi | 3/2.0 (+1) | 1,113 (-1%) | 5mo | $157,000 | $141 | 65 |
| 425 N Jackson St | 0.21mi | 3/1.0 (+1) | 1,008 (-11%) | 15mo | $125,000 | $124 | 55 |
| 409 N Jackson St | 0.20mi | 3/1.5 (+1) | 1,008 (-11%) | 17mo | $84,900 | $84 | 52 |
| 465 W Bellville Ave | 0.54mi | 2/1.0 | 995 (-12%) | 24mo | $115,000 | $116 | 36 |
| 1065 N Market St | 0.53mi | 3/1.0 (+1) | 1,295 (+15%) | 18mo | $130,000 | $100 | 30 |
Match score weights: distance 35% · size 25% · config 20% · recency 20%. Top-matched comps best support the ARV.
Projected returns pro-forma
5.41% appreciation · 3.0% rent growth · sell at horizon
- IRR
- 20.8%
- Equity multiple
- 2.34×
- Total profit
- $33,538
- Equity at exit
- $52,947
- IRR
- 20.2%
- Equity multiple
- 4.64×
- Total profit
- $91,148
- Equity at exit
- $93,278
Cash invested: $25,060 (down + closing). Projections, not guarantees.
Landlord ↔ Tenant lean methodology
- Overall (STATE)
- 90 Strongly Landlord-Friendly
- State Indiana
- 90 Strongly Landlord-Friendly · R+11
- County
- — inherits STATE
- City
- — inherits STATE
ZIP-level market 46702
- Home prices YoY
- 2.4%
- Active inventory
- 9
- Price-to-rent
- 7.6×
Monthly cashflow live
- Estimated rent
- $987 medium interval (Pro) →
- Mortgage (P&I)
- −$469
- Tax from tax record
- −$104 /mo · $1,246/yr
- Insurance
- −$37
- HOA
- −$0
- Vacancy / Maint / Mgmt
- −$207
- Net cashflow
- $170
Break-even live
UW: 25.0% down · 7.5% · 30yr · 1.5% tax · 5.0% vac · 8.0% maint · 8.0% mgmt
Financing live
Cash to close
- Down payment
- $22,375
- Closing costs
- $2,685
- Reserves months
- —
- Total cash needed
- —
Loan-product check · same deal, 3 products live
Conventional
25% down · 7.5% · 30yr
- Down + closing
- —
- Monthly P&I
- —
- Monthly cashflow
- —
- DSCR
- —
- Eligible?
- —
Personal DTI + credit; lowest rate.
DSCR
20% down · 8.5% · 30yr
- Down + closing
- —
- Monthly P&I
- —
- Monthly cashflow
- —
- DSCR
- —
- Eligible?
- —
No personal income docs; deal must DSCR.
Hard money
10% down · 12.0% · 12mo
- Down + closing
- —
- Monthly P&I
- —
- Monthly cashflow
- —
- DSCR
- —
- Eligible?
- —
Short-term bridge; refi at stabilization.
Listing history 27 events
-
2026-06-15statusdays on market $89,500 Pending 124 DOM
-
2026-06-14days on market $89,500 Active Under Contract 123 DOM
-
2026-06-12days on market $89,500 Active Under Contract 122 DOM
-
2026-06-09days on market $89,500 Active Under Contract 119 DOM
-
2026-06-08days on market $89,500 Active Under Contract 118 DOM
-
2026-06-07days on market $89,500 Active Under Contract 117 DOM
-
2026-06-05days on market $89,500 Active Under Contract 114 DOM
-
2026-06-03days on market $89,500 Active Under Contract 113 DOM
-
2026-06-02days on market $89,500 Active Under Contract 112 DOM
-
2026-06-01days on market $89,500 Active Under Contract 111 DOM
-
2026-05-31days on market $89,500 Active Under Contract 110 DOM
-
2026-05-30days on market $89,500 Active Under Contract 109 DOM
-
2026-05-11historical Active Under Contract
-
2026-05-07price $89,500
-
2026-04-30price $92,900
-
2026-04-27price $94,900
-
2026-04-27price $96,900
-
2026-04-18price $97,900
-
2026-04-11price $99,900
-
2026-04-07status Active
-
2026-03-02historical Active Under Contract
-
2026-03-01price $110,000
-
2026-02-28price $113,000
-
2026-02-21price $115,000
-
2026-02-13price $120,000
-
2026-02-10$130,000 Active
-
2010-10-21soldstatus $10,000
ⓘ Source: listings_history table (triggers on properties + properties_extension) + one-shot
backfill from property_details.listing_events for pre-trigger history.
Tax reassessment forecast IN · Partial reset (capped growth)
- Current annual tax
- $1,246 · $104/mo
- Projected year-2 tax
- $1,246 · $104/mo
- Expected delta
- $0/yr ($0/mo · 0.0%)
ⓘ Screening estimate from a state-policy table — verify with the county assessor before closing.
Climate risk First Street
- Flood 1/10 Low FEMA zone X (unshaded) · 0% chance over 30 yrs
- Wildfire 1/10 Low
- Heat 3/10 Moderate 7 d/yr ≥102°F today · 17 d/yr by 30 yrs out
- Wind 2/10 Low
- Air quality 3/10 Moderate 1 unhealthy d/yr today · 3 by 30 yrs out
Nearby sold comps map
Loading sold comps map…
Walkable amenities ~0.75 mi
Loading nearby amenities…
Taxation est. · year 1
- Rental income
- $11,850
- − Mortgage interest
- −$5,013
- − Property taxes
- −$1,246
- − Insurance
- −$448
- − Repairs & maintenance
- −$948
- − Management
- −$948
- − Depreciation
- −$2,604
- Taxable income
- $643
- Est. tax owed @ 24.0%
- −$154
- After-tax cash flow
- $1,881/yr
For passive investors: Depreciation is non-cash, so a rental often shows a tax loss while cash-flowing — sheltering income. Rental losses are passive: they offset passive income freely, and up to $25,000/yr can offset ordinary (W-2) income if you actively participate and your MAGI is under $100k (phasing out to $0 by $150k); unused losses carry forward. On sale, claimed depreciation is recaptured at up to 25%, and gains may owe capital-gains tax (a 1031 exchange can defer both). Figures are a year-1 estimate at your 24.0% rate — not tax advice; consult a CPA.
Schools (NCES district)
- District
- Huntington County Community School Corporation
- NCES district ID
- 1804710
- Math proficiency
- 34% ▼ -6.00%
- Reading proficiency
- 39% ▼ -10.00%
- Median HH income
- $47,010
- Composite
- 31.29/100
- National rank
- #6013
- State rank
- #176 of 301 in IN
Livability — Andrews
- Score
- 66/100
- State rank
- #274
- US rank
- #11452
Category grades
Schools grade is shown separately in the Schools card above.
Census & demographics
- Census place
- Andrews, IN
- Population (ZIP)
- 1,955
Population outlook (Huntington County) Hauer SSP2
- Today (2025)
- 35,613 people
- By 2030
- 34,759 · -2.4%
- By 2040
- 32,682 · -8.2%
- By 2050
- 30,495 · -14.4%
- By 2075
- 26,298 · -26.2%
- By 2100
- 22,653 · -36.4%
Race, ethnicity, and origin ACS 2023
- Neighborhood character
- Predominantly White (93%)
- Race & ethnicity
- White 93% Two or more races 5% Hispanic / Latino 4% Native American 1%
- Common ancestry
- Lithuanian 3% Portuguese 1% Slovak 1%
- Foreign-born
- 2% · Canada, South Korea
- Languages at home
- 99% English-only · Korean 1%
Political lean MEDSL · Huntington
- 2024 margin
- Solid R (+48.4) · D 24.9% · R 73.3% · Other 1.8%
- 2008→2024 swing
- -21.2pp toward R · 2008: -27.2pp · 2024: -48.4pp
- All cycles
- 2024: R+48.4 2020: R+49.9 2016: R+51.0 2012: R+39.8 2008: R+27.2
Not yet ingested
- Civics
- —
Market trends
- HPI YoY
- ▲ 5.41%
- Current HPI
- 229.3828
- Rent YoY
- —
- Metro
- —
- State GDP YoY
- ▲ 2.90%
- F500 in state
- 18
Industry mix (Fortune 500 HQ in IN)
| Industry | F500 HQs | Revenue |
|---|---|---|
| Industrial Machinery | 2 | $37B |
|
||
| Healthcare | 1 | $177B |
|
||
| Pharmaceuticals | 1 | $45B |
|
||
| Metals / Steel | 1 | $18B |
|
||
| Agriculture | 1 | $17B |
|
||
| Packaging | 1 | $12B |
|
||
Price history
+795.0% since first listed15 events — show timeline
- 2026-05-11 Contingent — IRMLS
- 2026-05-07 Price Changed $89,500 IRMLS
- 2026-04-30 Price Changed $92,900 IRMLS
- 2026-04-27 Price Changed $94,900 IRMLS
- 2026-04-27 Price Changed $96,900 IRMLS
- 2026-04-18 Price Changed $97,900 IRMLS
- 2026-04-11 Price Changed $99,900 IRMLS
- 2026-04-07 Relisted — IRMLS
- 2026-03-02 Contingent — IRMLS
- 2026-03-01 Price Changed $110,000 IRMLS
- 2026-02-28 Price Changed $113,000 IRMLS
- 2026-02-21 Price Changed $115,000 IRMLS
- 2026-02-13 Price Changed $120,000 IRMLS
- 2026-02-10 Listed $130,000 IRMLS
- 2010-10-21 Sold (Public Records) $10,000 Public Records
Property tax history
+2.3%/yrLatest (2024): $1,246 · +0.0% YoY. Source: county tax records.
Cash-flow waterfall
monthlySold comps — $/sqft
last 12 mo · ≤1 miLoading sold comps…