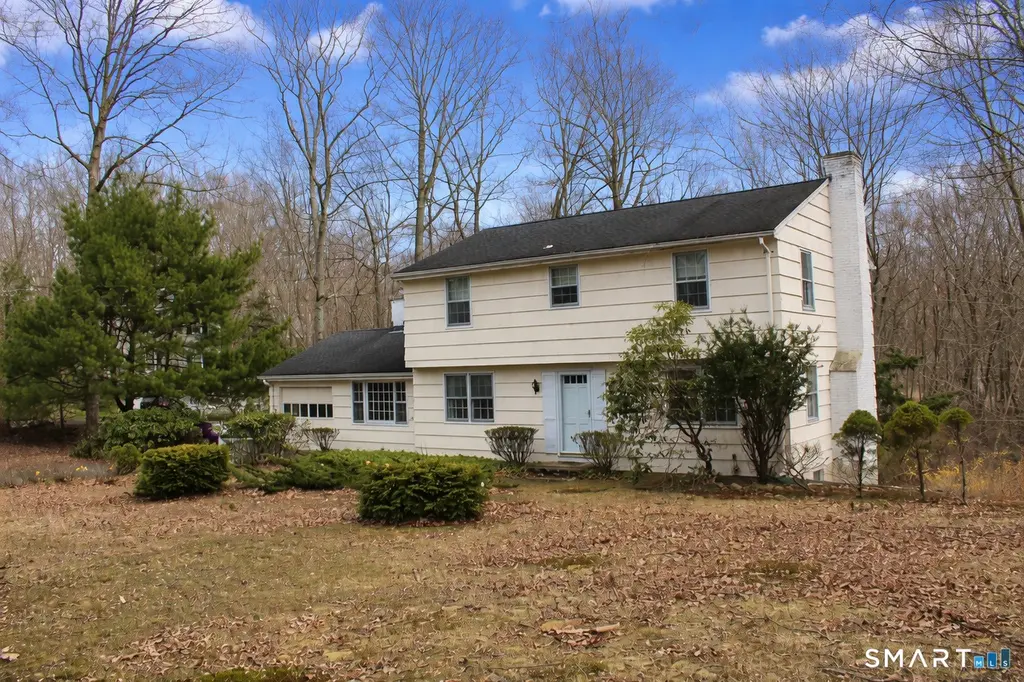
12 Sportsman's Hill Rd · Madison Center, CT
Flood risk 1/10 · Minimal
- FEMA flood zone
- X (unshaded)
- Chance of flooding over 30 yrs
- 0.0%
- Est. flood insurance / yr
- $507 – $1,088
Fire risk 3/10 · Minor
- Est. fire insurance / yr
- $829 – $1,539
Heat risk 6/10 · Moderate
- Hot days now (above 93°F)
- 7 days/yr
- Hot days in 30 yrs
- 18 days/yr
Wind risk 7/10 · Major
- Chance of severe wind over 30 yrs
- 78.0%
Air-quality risk 5/10 · Moderate
- Unhealthy air days now
- 5 days/yr
- Unhealthy air days in 30 yrs
- 8 days/yr
Risk factors via First Street. Map © Google.
Why this score? — see what drove the D grade
The composite is a weighted blend of 9 inputs, each scored 0–100. Each bar is that input's sub-score; the figure is the points it added to the 100-point composite (weight × sub-score).
- ARV discount +13.3/15.0
- Cash flow +10.2/30.0
- Schools +6.6/10.0
- Livability +4.0/5.0
- DSCR +2.9/10.0
- 1% rule +2.8/10.0
- Rent growth +2.5/5.0
- Condition / age +2.5/5.0
- Appreciation +0.0/10.0
$499,000
🖨 Deal sheet 📄 Offer letter ✓ Due diligence
Listing remarks
4 Bedroom 2.5 Bath traditional Colonial, 1 car attached garage on quiet road near town and beaches. Solid home, Dry. Roof is 13 years old. Investors and flippers and DIY's this one is for you! Hot Madison Market! Full unfinished walk out basement. Raised Hearth Fireplace in Family room, and Raised Hearth fireplace in Living Room with Built ins alongside. Terrific location as house is set back slightly and on a knoll above the road which is not a shortcut. Well + Septic. Sloping lot, Lots of woods on 2 sides.
Key facts
- 0.94 acre lot
- Garage
- Built 1966
Neighborhood map
What this means for you Summary
Snapshot
- This is a 4-bed/2.0-bath single-family listed at $499k.
Deal economics
- At list price, monthly cash flow is $-287 ($-3k/yr) — negative.
- To cash-flow at today's rent, offer at most $448k (10.2% below list).
- To meet the 1% rule (rent ≥ 1% of price), the offer needs to be $389k (22.0% below list).
- Recommended offer: $389k (22.0% below list) — sets the bar for 1% rule.
- Cap rate 5.6% vs local median 3.4% in Madison Center — top-decile yield for the area; either an underpriced asset or a hidden risk that comps aren't pricing in. Stress-test before assuming the spread holds.
Location & tenants
- Location reads 79/100 on livability (#33 in CT, #2,238 nationally) — a middle-class / working-renter tenant base. Strengths: crime A+, health & safety A+, employment A; Watch: amenities C-, housing C-, cost of living F.
- Madison School District (suburban): math 69% / reading 75% proficiency, ranked #10 of 153 in CT (top 6%) — strong family-tenant draw, lease renewals of 3-5y typical; only 3% free/reduced lunch — higher-income household profile.
- Zoned schools: Daniel Hand High School (math 69% / reading 86%, grade A-, #8 of 194 statewide, top 4%, 828 students, 5% FRL) — zoned schools at 5% FRL track the district average.
- Market conditions: 105 active listings in the ZIP; 7 comparable units currently listed for rent nearby; rentals at typical pace (median 24d on market — plan ~3-4 weeks tenant-placement turnaround); 1,059 units permitted in South Central Connecticut Planning Region in 2024 (779 in 5+ unit buildings).
Forward outlook
- Local home prices are declining (-3.0%/yr); year-one equity from $3k of loan paydown is wiped out by about $15k of value loss. Plan a longer hold.
Negotiation context
- Only 5 days on market — expect competitive offers; lowballing is unlikely to land.
Risks & watch-outs
- Climate carrying-cost: major wind risk, 78% chance of damaging wind over 30y; extreme-heat days projected 7→18/yr by 2055 (HVAC capex compounding) — expect insurance premiums to compound above CPI over the hold.
Questions for the listing agent
- What do current leases actually rent for vs. the listed asking? Can we see a recent rent roll and the last 12 months of T-12 income?
- Built in 1966 — when were the roof, HVAC, electrical panel, plumbing, and water heater last replaced?
- Is there a deadline driving the sale (1031 exchange, divorce, estate, relocation)? That informs how much negotiation room exists.
- Schools are A-rated — typically a magnet for longer-tenancy family renters. What's the average tenant stay here, and is there a school-zone premium baked into asking?
- The area grade is low — what's the realistic commute time and amenity access for the typical tenant pool here? Any planned neighborhood developments (good or bad) we should know about?
- What's the average days-on-market for RENTAL listings here right now (not sales)? A rising rental-DOM trend means longer vacancies and softer asking-rent achievability than the comps imply.
- What's the recent tenant-quality profile in this submarket — average credit score on applications, eviction rate, late-payment / NSF rate, and stable-employment percentage? A property-management company in the area should have these aggregated.
- How much new for-sale + rental construction is in the pipeline within 1–3 miles? Heavy new supply typically softens prices + rents 12–24 months out; constrained supply supports both.
Investment metrics
- 1% rule
- 0.78% ✗
- Cap rate
- 5.60%
- Cash-on-cash
- -2.46%
- DSCR
- 0.89
- GRM
- 10.7
CMA / ARV
- ARV (on-the-fly)
- $573,210
- Comps found
- 9
Show comp detail 9 sales within ~0.75 mi
| Address | Dist | Beds/Ba | Sqft | Sold | Price | $/sf | Match |
|---|---|---|---|---|---|---|---|
| 92 Sportsman Hill Rd | 0.32mi | 4/2.5 | 1,902 (-2%) | 20mo | $550,000 | $289 | 64 |
| 14 Timber Ridge Rd | 0.37mi | 4/2.5 | 2,008 (+4%) | 13mo | $700,000 | $349 | 64 |
| 118 Flintlock Rd | 0.55mi | 3/2.0 (-1) | 1,840 (-5%) | 10mo | $705,000 | $383 | 53 |
| 99 Horse Pond Rd | 0.57mi | 3/2.0 (-1) | 1,956 (+1%) | 23mo | $480,000 | $245 | 47 |
| 29 Puritan Ln | 0.59mi | 4/2.5 | 2,072 (+7%) | 18mo | $627,000 | $303 | 43 |
| 36 Wellsweep Dr | 0.54mi | 4/2.5 | 1,688 (-12%) | 16mo | $501,750 | $297 | 39 |
| 38 Skytop Dr | 0.48mi | 3/2.5 (-1) | 2,204 (+14%) | 12mo | $878,000 | $398 | 37 |
| 97 Yankee Peddler Path | 0.48mi | 5/2.0 (+1) | 2,147 (+11%) | 22mo | $550,000 | $256 | 36 |
| 303 Durham Rd | 0.60mi | 4/2.0 | 2,192 (+14%) | 19mo | $540,000 | $246 | 33 |
Match score weights: distance 35% · size 25% · config 20% · recency 20%. Top-matched comps best support the ARV.
Projected returns pro-forma
-3.0% appreciation · 3.0% rent growth · sell at horizon
- IRR
- -20.4%
- Equity multiple
- 0.29×
- Total profit
- $-99,120
- Equity at exit
- $74,403
- IRR
- -13.5%
- Equity multiple
- 0.21×
- Total profit
- $-109,813
- Equity at exit
- $43,144
Cash invested: $139,720 (down + closing). Projections, not guarantees.
Landlord ↔ Tenant lean methodology
- Overall (STATE)
- 27 Tenant-Leaning
- State Connecticut
- 27 Tenant-Leaning · D+7
- County
- — inherits STATE
- City
- — inherits STATE
ZIP-level market 06443
- Active inventory
- 105
- Price-to-rent
- 10.7×
Monthly cashflow live
- Estimated rent
- $3,890 high interval (Pro) →
- Mortgage (P&I)
- −$2,617
- Tax from tax record
- −$535 /mo · $6,423/yr
- Insurance
- −$208
- HOA
- −$0
- Vacancy / Maint / Mgmt
- −$817
- Net cashflow
- $-287
Break-even live
UW: 25.0% down · 7.5% · 30yr · 1.5% tax · 5.0% vac · 8.0% maint · 8.0% mgmt
Financing live
Cash to close
- Down payment
- $124,750
- Closing costs
- $14,970
- Reserves months
- —
- Total cash needed
- —
Loan-product check · same deal, 3 products live
Conventional
25% down · 7.5% · 30yr
- Down + closing
- —
- Monthly P&I
- —
- Monthly cashflow
- —
- DSCR
- —
- Eligible?
- —
Personal DTI + credit; lowest rate.
DSCR
20% down · 8.5% · 30yr
- Down + closing
- —
- Monthly P&I
- —
- Monthly cashflow
- —
- DSCR
- —
- Eligible?
- —
No personal income docs; deal must DSCR.
Hard money
10% down · 12.0% · 12mo
- Down + closing
- —
- Monthly P&I
- —
- Monthly cashflow
- —
- DSCR
- —
- Eligible?
- —
Short-term bridge; refi at stabilization.
Rent comps 7 comps
| Address | Beds | Baths | Sqft | Rent | $/sqft | DOM | Units | Dist |
|---|---|---|---|---|---|---|---|---|
| 141 Flintlock Rd Madison, CT | 3.0 | 2.0 | 2000 | $3,485 | $1.74 | 16d | 1 | 0.58mi |
| 14 Bower Rd Madison, CT | 4.0 | 1.5 | 1884 | $3,850 | $2.04 | 44d | 1 | 0.69mi |
| 61 Scotland Ave Madison, CT | 3.0 | 1.5 | 1590 | $2,500 | $1.57 | 23d | 1 | 0.80mi |
| 509 Boston Post Rd Madison, CT | 3.0 | 3.0 | 2382 | $12,000 | $5.04 | 21d | 1 | 1.10mi |
| 323 Green Hill Rd Madison, CT | 3.0 | 2.5 | 2112 | $12,000 | $5.68 | 2d | 1 | 1.21mi |
| 41 Liberty St Madison, CT | 3.0 | 2.5 | 1586 | $5,600 | $3.53 | 23d | 1 | 1.37mi |
| 72 Cherry Ln Madison, CT | 4.0 | 2.5 | 2511 | $6,000 | $2.39 | 44d | 1 | 1.43mi |
Listing history 3 events
-
2026-04-22status Under Contract
-
2026-04-18$499,000 Active
-
2026-04-13historical $499,000
ⓘ Source: listings_history table (triggers on properties + properties_extension) + one-shot
backfill from property_details.listing_events for pre-trigger history.
Tax reassessment forecast CT · Partial reset (capped growth)
- Current annual tax
- $6,423 · $535/mo
- Projected year-2 tax
- $8,551 · $713/mo
- Expected delta
- +$2,128/yr (+$177/mo · 33.1%)
ⓘ Screening estimate from a state-policy table — verify with the county assessor before closing.
Climate risk First Street
- Flood 1/10 Low FEMA zone X (unshaded) · 0% chance over 30 yrs
- Wildfire 3/10 Moderate
- Heat 6/10 Major 7 d/yr ≥93°F today · 18 d/yr by 30 yrs out
- Wind 7/10 Severe 78% chance of damaging wind over 30 yrs
- Air quality 5/10 Major 5 unhealthy d/yr today · 8 by 30 yrs out
Nearby sold comps map
Loading sold comps map…
Walkable amenities ~0.75 mi
Loading nearby amenities…
Taxation est. · year 1
- Rental income
- $46,682
- − Mortgage interest
- −$27,952
- − Property taxes
- −$6,423
- − Insurance
- −$2,495
- − Repairs & maintenance
- −$3,735
- − Management
- −$3,735
- − Depreciation
- −$14,516
- Taxable loss
- −$12,174
- Est. tax savings @ 24.0%
- +$2,922
- After-tax cash flow
- $-520/yr
For passive investors: Depreciation is non-cash, so a rental often shows a tax loss while cash-flowing — sheltering income. Rental losses are passive: they offset passive income freely, and up to $25,000/yr can offset ordinary (W-2) income if you actively participate and your MAGI is under $100k (phasing out to $0 by $150k); unused losses carry forward. On sale, claimed depreciation is recaptured at up to 25%, and gains may owe capital-gains tax (a 1031 exchange can defer both). Figures are a year-1 estimate at your 24.0% rate — not tax advice; consult a CPA.
Schools (NCES district)
- District
- Madison School District
- NCES district ID
- 0902280
- Math proficiency
- 69% ▲ 1.00%
- Reading proficiency
- 75% ▲ 2.00%
- Median HH income
- $103,788
- Composite
- 66.15/100
- National rank
- #435
- State rank
- #10 of 153 in CT
Livability — Madison Center
- Score
- 79/100
- State rank
- #33
- US rank
- #2238
Category grades
Schools grade is shown separately in the Schools card above.
Census & demographics
- Population (ZIP)
- 17,577
Population outlook (South Central Connecticut County) Hauer SSP2
- By 2040
- 608,362
Race, ethnicity, and origin ACS 2023
- Neighborhood character
- Predominantly White (88%)
- Race & ethnicity
- White 88% Two or more races 5% Asian 4% Hispanic / Latino 3%
- Common ancestry
- Romanian 5% Lithuanian 3% Slovak 2%
- Foreign-born
- 9% · Canada, China
- Languages at home
- 92% English-only · Other Indo-European 2% Spanish 2% German/W. Germanic 1%
Political lean MEDSL · South Central Connecticut
- 2024 margin
- Strong D (+20.1) · D 59.0% · R 38.9% · Other 2.1%
- All cycles
- 2024: D+20.1
Not yet ingested
- Civics
- —
Market trends
- HPI YoY
- ▼ -375.58%
- Current HPI
- 242.8467
- Rent YoY
- —
- Metro
- —
- State GDP YoY
- ▲ 1.06%
- F500 in state
- 38
Industry mix (Fortune 500 HQ in CT)
| Industry | F500 HQs | Revenue |
|---|---|---|
| Industrial Machinery | 4 | $38B |
|
||
| Insurance | 3 | $71B |
|
||
| Financial Services | 2 | $25B |
|
||
| Transportation / Logistics | 2 | $18B |
|
||
| Healthcare | 1 | $247B |
|
||
| Telecommunications | 1 | $55B |
|
||
Price history
+0.0% since first listed3 events — show timeline
- 2026-04-22 Pending — Smart MLS
- 2026-04-18 Listed $499,000 Smart MLS
- 2026-04-13 Coming Soon $499,000 Smart MLS
Property tax history
+1.3%/yrLatest (2023): $6,423 · +1.9% YoY. Source: county tax records.
Cash-flow waterfall
monthlySold comps — $/sqft
last 12 mo · ≤1 miLoading sold comps…