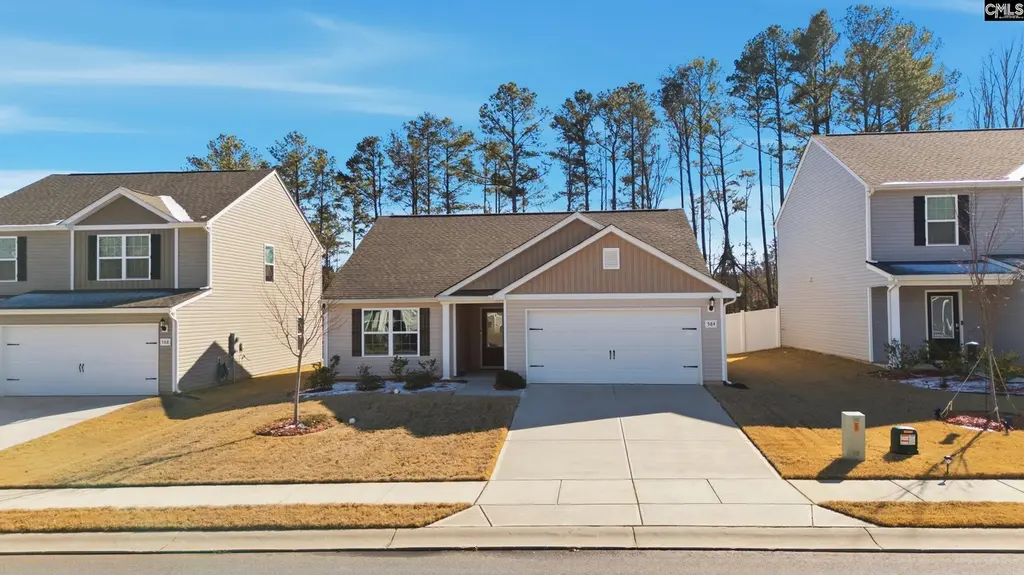
584 Lamorak Pl · Richburg, SC
Flood risk No data
- FEMA flood zone
- —
- Chance of flooding over 30 yrs
- —
- Est. flood insurance / yr
- —
Fire risk No data
- Est. fire insurance / yr
- —
Heat risk No data
- Hot days now (above threshold)
- —
- Hot days in 30 yrs
- —
Wind risk No data
- Chance of severe wind over 30 yrs
- —
Air-quality risk No data
- Unhealthy air days now
- —
- Unhealthy air days in 30 yrs
- —
Risk factors via First Street. Map © Google.
Why this score? — see what drove the C grade
The composite is a weighted blend of 9 inputs, each scored 0–100. Each bar is that input's sub-score; the figure is the points it added to the 100-point composite (weight × sub-score).
- Cash flow +21.7/30.0
- ARV discount +7.5/15.0
- DSCR +6.9/10.0
- Appreciation +6.5/10.0
- 1% rule +4.9/10.0
- Condition / age +4.0/5.0
- Livability +3.2/5.0
- Rent growth +2.5/5.0
- Schools +2.3/10.0
$284,900
🖨 Deal sheet 📄 Offer letter ✓ Due diligence
Listing remarks
Practically new and meticulously maintained, this 2023 ranch-style home in the Knights Bridge community features one-level living with an open layout and a premium lot that backs to trees for added privacy. Inside, you’ll find luxury vinyl plank flooring, beadboard doors, vaulted ceilings, and softly curved wall corners that create a warm, welcoming feel. The bright kitchen has granite countertops, staggered cabinetry, stainless steel appliances, and a breakfast bar that opens to the vaulted great room and dining area—ideal for both everyday living and entertaining. The private primary suite includes a vaulted ceiling and raised dual vanity with granite, while two additional bed
Key facts
- Beadboard doors
- Curved wall corners
- Backs to trees
Tags
Property features AI
Finance
- HOA & community: Home association present
Exterior
- Parking: Attached garage with 2 garage spaces (main level)
- Utilities: Public water; Public sewer
- Home design: Single-story home
- Construction: Slab foundation
- Exterior features: Vinyl exterior; Paved road access
Interior
- Kitchen: Kitchen located on the main level
- Bedrooms: Master bedroom on the main level; Second bedroom on the main level; Third bedroom on the main level
- Bathrooms: Two full bathrooms
- Heating & cooling: Central heating; Central cooling
- Interior features: Family room on the main level; Kitchen on the main level
- Laundry & utility: Washer/Dryer area on the main level
Neighborhood map
What this means for you Summary
Snapshot
- This is a 3-bed/1.0-bath other listed at $285k. Condition is rated good.
Deal economics
- At list price, monthly cash flow is $436 ($5k/yr) — positive.
- The deal already cash-flows at list — no discount required.
- To meet the 1% rule (rent ≥ 1% of price), the offer needs to be $283k (0.8% below list).
- Recommended offer: $259k (9.0% below list) — sets the bar for market timing.
- Cap rate 8.1% vs local median 5.7% in Richburg — top-decile yield for the area; either an underpriced asset or a hidden risk that comps aren't pricing in. Stress-test before assuming the spread holds.
Location & tenants
- Location reads 63/100 on livability (#182 in SC) — a middle-class / working-renter tenant base. Strengths: cost of living A+, housing A+; Watch: schools D+, crime D+, health & safety D+.
- Chester 01 (rural): math 23% / reading 34% proficiency, ranked #59 of 80 in SC (top 74%) — low school quality limits family demand, transient renter base, plan for 1-2y turnover; 64% free/reduced lunch — lower-income household profile, screen leases tightly.
- Market conditions: 81 active listings in the ZIP; 269 units permitted in Chester County in 2024 (0 in 5+ unit buildings).
Forward outlook
- In year one you build about $10k of equity ($2k loan paydown + $9k appreciation (3.0% local appreciation)).
- Chester County population projected at -24% by 2050 — secular population decline; favor cash flow + early exit over multi-decade hold.
- At projected returns (3.0% appreciation + 3.0% rent growth), your $80k cash investment doubles in ~5 years — after that, you're playing with house money.
- By year 4, paydown + projected appreciation supports a ~$36k cash-out refi (75% LTV) — recoverable capital for the next deal without selling this one.
Negotiation context
- It's been on market 91 days — a 9% lower offer ($259k) is reasonable based on typical stale-listing flexibility.
- 4 sale attempts since 3y ago with the ask held roughly flat each time — persistent listings suggest the price (not the market) is what's stuck; bring a comps-based counter.
Questions for the listing agent
- It's been on market 91 days. Have you received any prior offers? Is the seller open to a 9% concession, seller financing, or rate buy-down credit?
- What does the HOA fee cover, when was the last increase, and are there any pending special assessments or reserve-fund shortfalls?
- Why hasn't it sold? Are there any deal-killer items the seller is aware of (foundation, flood, title, zoning, code violations)?
- Is there a deadline driving the sale (1031 exchange, divorce, estate, relocation)? That informs how much negotiation room exists.
- Schools are D-rated, which usually means shorter tenancies and higher turnover. Who's the typical renter profile here, and what's been the actual vacancy rate?
- Crime grade is D in this area — have there been break-ins, vandalism, or insurance claims at this property in the last 3 years? What carrier currently insures it and at what premium?
- What's the average days-on-market for RENTAL listings here right now (not sales)? A rising rental-DOM trend means longer vacancies and softer asking-rent achievability than the comps imply.
- What's the recent tenant-quality profile in this submarket — average credit score on applications, eviction rate, late-payment / NSF rate, and stable-employment percentage? A property-management company in the area should have these aggregated.
- How much new for-sale + rental construction is in the pipeline within 1–3 miles? Heavy new supply typically softens prices + rents 12–24 months out; constrained supply supports both.
Investment metrics
- 1% rule
- 0.99% ✗
- Cap rate
- 8.13%
- Cash-on-cash
- 6.55%
- DSCR
- 1.29
- GRM
- 8.4
CMA / ARV
No comps found within radius.
Projected returns pro-forma
2.99% appreciation · 3.0% rent growth · sell at horizon
- IRR
- 13.6%
- Equity multiple
- 1.78×
- Total profit
- $61,900
- Equity at exit
- $127,998
- IRR
- 15.5%
- Equity multiple
- 3.28×
- Total profit
- $181,560
- Equity at exit
- $197,177
Cash invested: $79,772 (down + closing). Projections, not guarantees.
Landlord ↔ Tenant lean methodology
- Overall (STATE)
- 90 Strongly Landlord-Friendly
- State South Carolina
- 90 Strongly Landlord-Friendly · R+6
- County
- — inherits STATE
- City
- — inherits STATE
ZIP-level market 29729
- Home prices YoY
- 1.4%
- Active inventory
- 81
- Price-to-rent
- 8.4×
Monthly cashflow live
- Estimated rent
- $2,826 medium interval (Pro) →
- Mortgage (P&I)
- −$1,494
- Tax from tax record
- −$146 /mo · $1,757/yr
- Insurance
- −$119
- HOA
- −$38
- Vacancy / Maint / Mgmt
- −$594
- Net cashflow
- $436
Break-even live
UW: 25.0% down · 7.5% · 30yr · 1.5% tax · 5.0% vac · 8.0% maint · 8.0% mgmt
Financing live
Cash to close
- Down payment
- $71,225
- Closing costs
- $8,547
- Reserves months
- —
- Total cash needed
- —
Loan-product check · same deal, 3 products live
Conventional
25% down · 7.5% · 30yr
- Down + closing
- —
- Monthly P&I
- —
- Monthly cashflow
- —
- DSCR
- —
- Eligible?
- —
Personal DTI + credit; lowest rate.
DSCR
20% down · 8.5% · 30yr
- Down + closing
- —
- Monthly P&I
- —
- Monthly cashflow
- —
- DSCR
- —
- Eligible?
- —
No personal income docs; deal must DSCR.
Hard money
10% down · 12.0% · 12mo
- Down + closing
- —
- Monthly P&I
- —
- Monthly cashflow
- —
- DSCR
- —
- Eligible?
- —
Short-term bridge; refi at stabilization.
HOA detail
- Monthly dues
- $38 · $456/yr
Listing history 28 events
-
2026-06-18days on market $284,900 Active 91 DOM
-
2026-06-17days on market $284,900 Active 90 DOM
-
2026-06-16days on market $284,900 Active 89 DOM
-
2026-06-15days on market $284,900 Active 88 DOM
-
2026-06-13days on market $284,900 Active 86 DOM
-
2026-06-09days on market $284,900 Active 82 DOM
-
2026-06-08days on market $284,900 Active 81 DOM
-
2026-06-07days on market $284,900 Active 80 DOM
-
2026-06-04days on market $284,900 Active 77 DOM
-
2026-06-03days on market $284,900 Active 76 DOM
-
2026-06-02days on market $284,900 Active 75 DOM
-
2026-06-01days on market $284,900 Active 74 DOM
-
2026-05-31days on market $284,900 Active 73 DOM
-
2026-05-08price $284,900
-
2026-04-24price $287,399
-
2026-03-17$287,400 Active
-
2026-03-12historical
-
2026-02-13price $287,400
-
2026-01-29$287,900 Active
-
2025-09-17price $289,900
-
2025-06-23price $296,999
-
2025-06-06price $300,000
-
2025-06-06price $301,000
-
2025-05-21$306,900 Active
-
2025-05-03historical
-
2023-07-21soldstatus $284,900 Closed
-
2023-03-31historical Active Under Contract
-
2023-03-31$284,900 Active
ⓘ Source: listings_history table (triggers on properties + properties_extension) + one-shot
backfill from property_details.listing_events for pre-trigger history.
Tax reassessment forecast SC · Resets to sale price
- Current annual tax
- $1,757 · $146/mo
- Projected year-2 tax
- $1,757 · $146/mo
- Expected delta
- $0/yr ($0/mo · 0.0%)
ⓘ Screening estimate from a state-policy table — verify with the county assessor before closing.
Nearby sold comps map
Loading sold comps map…
Walkable amenities ~0.75 mi
Loading nearby amenities…
Taxation est. · year 1
- Rental income
- $33,915
- − Mortgage interest
- −$15,959
- − Property taxes
- −$1,757
- − Insurance
- −$1,424
- − Repairs & maintenance
- −$2,713
- − Management
- −$2,713
- − HOA
- −$456
- − Depreciation
- −$8,288
- Taxable income
- $604
- Est. tax owed @ 24.0%
- −$145
- After-tax cash flow
- $5,082/yr
For passive investors: Depreciation is non-cash, so a rental often shows a tax loss while cash-flowing — sheltering income. Rental losses are passive: they offset passive income freely, and up to $25,000/yr can offset ordinary (W-2) income if you actively participate and your MAGI is under $100k (phasing out to $0 by $150k); unused losses carry forward. On sale, claimed depreciation is recaptured at up to 25%, and gains may owe capital-gains tax (a 1031 exchange can defer both). Figures are a year-1 estimate at your 24.0% rate — not tax advice; consult a CPA.
Condition & rehab AI · 12 photos
This 2023 ranch-style home in Knights Bridge is in good condition with minimal repairs needed. It offers a good return on investment with updates that can significantly increase its value.
Value-add opportunities
- Resale paint exterior — fresh paint enhances curb appeal
- Resale landscaping — improved landscaping can increase curb appeal
- Both replace carpet — new carpet can improve both resale and rental value
Renovation cost estimate screening
Value-add ROI direction
- Resale paint exterior — fresh paint enhances curb appeal ↑
- Resale landscaping — improved landscaping can increase curb appeal ↑
- Both replace carpet — new carpet can improve both resale and rental value ↑
ⓘ Cost ranges are severity-bucket heuristics (US national rule-of-thumb). Get contractor quotes + a written scope before underwriting a rehab budget.
Schools (NCES district)
- District
- Chester 01
- NCES district ID
- 4501530
- Math proficiency
- 23% ▼ -6.00%
- Reading proficiency
- 34% ▬ 0.00%
- Median HH income
- $34,041
- Composite
- 23.39/100
- National rank
- #7902
- State rank
- #59 of 80 in SC
Livability — Richburg
- Score
- 63/100
- State rank
- #182
- US rank
- #15927
Category grades
Schools grade is shown separately in the Schools card above.
Census & demographics
- Population (ZIP)
- 2,313
Population outlook (Chester County) Hauer SSP2
- Today (2025)
- 30,121 people
- By 2030
- 28,700 · -4.7%
- By 2040
- 25,784 · -14.4%
- By 2050
- 23,001 · -23.6%
- By 2075
- 17,770 · -41.0%
- By 2100
- 13,584 · -54.9%
Race, ethnicity, and origin ACS 2023
- Neighborhood character
- Diverse neighborhood (Simpson 0.57)
- Race & ethnicity
- White 60% Black 26% Two or more races 12% Hispanic / Latino 7%
- Hispanic origin (detail)
- Mexican 2% Puerto Rican 5%
- Common ancestry
- Danish 2% Serbian 2% Lithuanian 2%
- Foreign-born
- 2% · Canada, Guatemala
- Languages at home
- 99% English-only · Spanish 1%
Political lean MEDSL · Chester
- 2024 margin
- R (+17.2) · D 40.8% · R 58.0% · Other 1.1%
- 2008→2024 swing
- -25.5pp toward R · 2008: 8.3pp · 2024: -17.2pp
- All cycles
- 2024: R+17.2 2020: R+10.9 2016: R+4.8 2012: D+10.5 2008: D+8.3
Not yet ingested
- Civics
- —
Market trends
- HPI YoY
- ▲ 2.99%
- Current HPI
- 210.6518
- Rent YoY
- —
- Metro
- —
- State GDP YoY
- ▲ 4.51%
- F500 in state
- 2
Industry mix (Fortune 500 HQ in SC)
| Industry | F500 HQs | Revenue |
|---|---|---|
| Packaging | 1 | $7B |
|
||
Price history
+0.0% since first listed15 events — show timeline
- 2026-05-08 Price Changed $284,900 Consolidated MLS
- 2026-04-24 Price Changed $287,399 Consolidated MLS
- 2026-03-17 Listed $287,400 Consolidated MLS
- 2026-03-12 Delisted — Consolidated MLS
- 2026-02-13 Price Changed $287,400 Consolidated MLS
- 2026-01-29 Listed $287,900 Consolidated MLS
- 2025-09-17 Price Changed $289,900 CANOPYMLS as Distributed by MLS Grid
- 2025-06-23 Price Changed $296,999 CANOPYMLS as Distributed by MLS Grid
- 2025-06-06 Price Changed $300,000 CANOPYMLS as Distributed by MLS Grid
- 2025-06-06 Price Changed $301,000 CANOPYMLS as Distributed by MLS Grid
- 2025-05-21 Listed $306,900 CANOPYMLS as Distributed by MLS Grid
- 2025-05-03 Coming Soon — CANOPYMLS as Distributed by MLS Grid
- 2023-07-21 Sold (MLS) $284,900 CANOPYMLS as Distributed by MLS Grid
- 2023-03-31 Contingent — CANOPYMLS as Distributed by MLS Grid
- 2023-03-31 Listed $284,900 CANOPYMLS as Distributed by MLS Grid
Property tax history
+8.5%/yrLatest (2025): $1,757 · -76.5% YoY. Source: county tax records.
Cash-flow waterfall
monthlySold comps — $/sqft
last 12 mo · ≤1 miLoading sold comps…