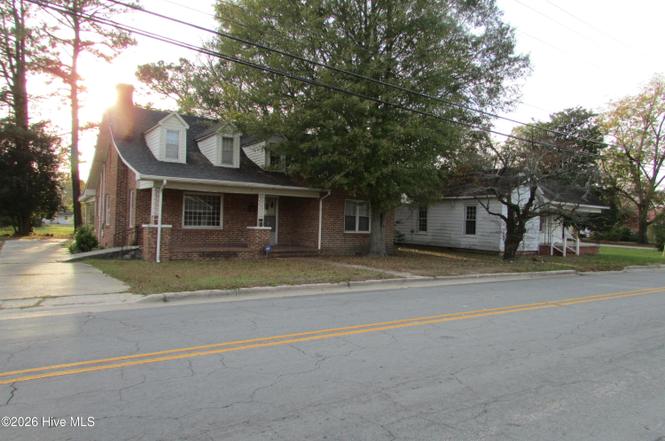
803 Mc Koy St · Clinton, NC
Flood risk 1/10 · Minimal
- FEMA flood zone
- X (unshaded)
- Chance of flooding over 30 yrs
- 0.0%
- Est. flood insurance / yr
- $507 – $1,088
Fire risk 2/10 · Minimal
- Est. fire insurance / yr
- $906 – $1,684
Heat risk 7/10 · Major
- Hot days now (above 105°F)
- 7 days/yr
- Hot days in 30 yrs
- 16 days/yr
Wind risk 8/10 · Major
- Chance of severe wind over 30 yrs
- 80.0%
Air-quality risk 2/10 · Minimal
- Unhealthy air days now
- 1 days/yr
- Unhealthy air days in 30 yrs
- 1 days/yr
Risk factors via First Street. Map © Google.
Why this score? — see what drove the C+ grade
The composite is a weighted blend of 9 inputs, each scored 0–100. Each bar is that input's sub-score; the figure is the points it added to the 100-point composite (weight × sub-score).
- Cash flow +21.9/30.0
- ARV discount +15.0/15.0
- DSCR +7.0/10.0
- 1% rule +5.6/10.0
- Schools +3.6/10.0
- Livability +3.3/5.0
- Rent growth +2.5/5.0
- Condition / age +2.5/5.0
- Appreciation +0.0/10.0
$139,000
🖨 Deal sheet 📄 Offer letter ✓ Due diligence
Listing remarks
Brick home located on McKoy St in Clinton offering 3 bedrooms and 1.5 bathrooms. The home includes a living room, kitchen, and designated laundry area. Interior features a practical floor plan with bedrooms and shared bath along the hallway and a half bath for additional convenience. The property sits on a residential lot with driveway parking and yard space in the front and rear. Located within the Clinton city limits with access to local streets, shopping, schools, and other services. Property is being sold as-is.
Key facts
- Residential lot
- Brick home
- Driveway parking
Tags
Property features AI
Exterior
- Parking: Other parking
- Utilities: Sewer connected; Water connected
- Home design: Single-family residence; Two levels; Residential zoning
- Construction: Block and brick construction; Shingle roof; Built with crawl space foundation
- Exterior features: Porch; Partial fencing; City street and state road frontage; Irregular lot shape
Interior
- Bathrooms: 1 full bathroom; 1 half bathroom
- Heating & cooling: Heat pump heating; Electric heating; Heat pump cooling
- Interior features: Crawl space basement; 9 total rooms; Has a view
Neighborhood map
What this means for you Summary
Snapshot
- This is a 5-bed/1.5-bath single-family listed at $139k.
Deal economics
- At list price, monthly cash flow is $218 ($3k/yr) — positive.
- The deal already cash-flows at list — no discount required.
- Meets the 1% rule at list price ($1k rent vs $139k).
- Recommended offer: $126k (9.0% below list) — sets the bar for market timing.
- Cap rate 8.2% vs local median 3.0% in Clinton — top-decile yield for the area; either an underpriced asset or a hidden risk that comps aren't pricing in. Stress-test before assuming the spread holds.
Location & tenants
- Location reads 66/100 on livability (#261 in NC) — a middle-class / working-renter tenant base. Strengths: cost of living A+, health & safety A+, housing A-; Watch: crime F, amenities F, commute F.
- Clinton City Schools (town): math 46% / reading 40% proficiency, ranked #102 of 178 in NC (top 57%) — families likely to look elsewhere, expect single-tenant / working-renter base with shorter leases; 71% free/reduced lunch — lower-income household profile, screen leases tightly.
- Zoned schools: Butler Avenue Elementary (437 students, 99% FRL); Sampson Middle (math 43% / reading 44%, grade D, #182 of 475 statewide, top 40%, 647 students, 100% FRL); Clinton High (math 62% / reading 44%, grade C-, #281 of 535 statewide, top 53%, 851 students, 99% FRL) — zoned schools average 99% FRL vs 71% district-wide (28 pts higher); higher-poverty schools than district average — tighter screening recommended.
- Market conditions: 147 active listings in the ZIP; 189 units permitted in Sampson County in 2024 (0 in 5+ unit buildings).
Forward outlook
- Local home prices are declining (-3.0%/yr); year-one equity from $961 of loan paydown is wiped out by about $4k of value loss. Plan a longer hold.
- Sampson County population projected to shrink 5% by 2050 — rents likely to lag national; underwrite the cash flow, not the appreciation.
Negotiation context
- It's been on market 104 days — a 9% lower offer ($126k) is reasonable based on typical stale-listing flexibility.
- 7 sale attempts since 12y ago with the ask held roughly flat each time — persistent listings suggest the price (not the market) is what's stuck; bring a comps-based counter.
Risks & watch-outs
- Watch-outs: built in 1952 — expect roof / HVAC / electrical / plumbing capex.
- Climate carrying-cost: severe wind risk, 80% chance of damaging wind over 30y; extreme-heat days projected 7→16/yr by 2055 (HVAC capex compounding) — expect insurance premiums to compound above CPI over the hold.
Questions for the listing agent
- It's been on market 104 days. Have you received any prior offers? Is the seller open to a 9% concession, seller financing, or rate buy-down credit?
- Built in 1952 — when were the roof, HVAC, electrical panel, plumbing, and water heater last replaced?
- Why hasn't it sold? Are there any deal-killer items the seller is aware of (foundation, flood, title, zoning, code violations)?
- Is there a deadline driving the sale (1031 exchange, divorce, estate, relocation)? That informs how much negotiation room exists.
- Schools are D-rated, which usually means shorter tenancies and higher turnover. Who's the typical renter profile here, and what's been the actual vacancy rate?
- Crime grade is F in this area — have there been break-ins, vandalism, or insurance claims at this property in the last 3 years? What carrier currently insures it and at what premium?
- What's the average days-on-market for RENTAL listings here right now (not sales)? A rising rental-DOM trend means longer vacancies and softer asking-rent achievability than the comps imply.
- What's the recent tenant-quality profile in this submarket — average credit score on applications, eviction rate, late-payment / NSF rate, and stable-employment percentage? A property-management company in the area should have these aggregated.
- How much new for-sale + rental construction is in the pipeline within 1–3 miles? Heavy new supply typically softens prices + rents 12–24 months out; constrained supply supports both.
Investment metrics
- 1% rule
- 1.06% ✓
- Cap rate
- 8.17%
- Cash-on-cash
- 6.71%
- DSCR
- 1.30
- GRM
- 7.9
CMA / ARV
- ARV (on-the-fly)
- $276,210
- Comps found
- 1
Show comp detail 1 sale within ~0.75 mi
| Address | Dist | Beds/Ba | Sqft | Sold | Price | $/sf | Match |
|---|---|---|---|---|---|---|---|
| 302 W Boney St | 0.21mi | 4/3.0 (-1) | 1,625 (-9%) | 15mo | $252,000 | $155 | 53 |
Match score weights: distance 35% · size 25% · config 20% · recency 20%. Top-matched comps best support the ARV.
Projected returns pro-forma
-3.0% appreciation · 3.0% rent growth · sell at horizon
- IRR
- -6.0%
- Equity multiple
- 0.78×
- Total profit
- $-8,651
- Equity at exit
- $20,725
- IRR
- 3.7%
- Equity multiple
- 1.27×
- Total profit
- $10,359
- Equity at exit
- $12,018
Cash invested: $38,920 (down + closing). Projections, not guarantees.
Landlord ↔ Tenant lean methodology
- Overall (STATE)
- 85 Strongly Landlord-Friendly
- State North Carolina
- 85 Strongly Landlord-Friendly · R+3
- County
- — inherits STATE
- City
- — inherits STATE
ZIP-level market 28328
- Home prices YoY
- -17.3%
- Active inventory
- 147
- Price-to-rent
- 7.9×
Monthly cashflow live
- Estimated rent
- $1,467 medium interval (Pro) →
- Mortgage (P&I)
- −$729
- Tax from tax record
- −$155 /mo · $1,858/yr
- Insurance
- −$58
- HOA
- −$0
- Vacancy / Maint / Mgmt
- −$308
- Net cashflow
- $218
Break-even live
UW: 25.0% down · 7.5% · 30yr · 1.5% tax · 5.0% vac · 8.0% maint · 8.0% mgmt
Financing live
Cash to close
- Down payment
- $34,750
- Closing costs
- $4,170
- Reserves months
- —
- Total cash needed
- —
Loan-product check · same deal, 3 products live
Conventional
25% down · 7.5% · 30yr
- Down + closing
- —
- Monthly P&I
- —
- Monthly cashflow
- —
- DSCR
- —
- Eligible?
- —
Personal DTI + credit; lowest rate.
DSCR
20% down · 8.5% · 30yr
- Down + closing
- —
- Monthly P&I
- —
- Monthly cashflow
- —
- DSCR
- —
- Eligible?
- —
No personal income docs; deal must DSCR.
Hard money
10% down · 12.0% · 12mo
- Down + closing
- —
- Monthly P&I
- —
- Monthly cashflow
- —
- DSCR
- —
- Eligible?
- —
Short-term bridge; refi at stabilization.
Listing history 15 events
-
2026-06-18days on market $139,000 Active 104 DOM
-
2026-06-17days on market $139,000 Active 103 DOM
-
2026-06-16days on market $139,000 Active 102 DOM
-
2026-06-15days on market $139,000 Active 101 DOM
-
2026-06-13days on market $139,000 Active 99 DOM
-
2026-06-12days on market $139,000 Active 98 DOM
-
2026-06-09days on market $139,000 Active 95 DOM
-
2026-06-08days on market $139,000 Active 94 DOM
-
2026-06-07days on market $139,000 Active 93 DOM
-
2026-06-07days on market $139,000 Active 92 DOM
-
2026-06-04days on market $139,000 Active 89 DOM
-
2026-06-02days on market $139,000 Active 88 DOM
-
2026-06-01days on market $139,000 Active 87 DOM
-
2026-05-31remarks 521-char remark
-
2026-05-31$139,000 Active 86 DOM
ⓘ Source: listings_history table (triggers on properties + properties_extension) + one-shot
backfill from property_details.listing_events for pre-trigger history.
Tax reassessment forecast NC · Resets to sale price
- Current annual tax
- $1,858 · $155/mo
- Projected year-2 tax
- $1,858 · $155/mo
- Expected delta
- $0/yr ($0/mo · 0.0%)
ⓘ Screening estimate from a state-policy table — verify with the county assessor before closing.
Climate risk First Street
- Flood 1/10 Low FEMA zone X (unshaded) · 0% chance over 30 yrs
- Wildfire 2/10 Low
- Heat 7/10 Severe 7 d/yr ≥105°F today · 16 d/yr by 30 yrs out
- Wind 8/10 Severe 80% chance of damaging wind over 30 yrs
- Air quality 2/10 Low 1 unhealthy d/yr today · 1 by 30 yrs out
Nearby sold comps map
Loading sold comps map…
Walkable amenities ~0.75 mi
Loading nearby amenities…
Taxation est. · year 1
- Rental income
- $17,610
- − Mortgage interest
- −$7,786
- − Property taxes
- −$1,858
- − Insurance
- −$695
- − Repairs & maintenance
- −$1,409
- − Management
- −$1,409
- − Depreciation
- −$4,044
- Taxable income
- $410
- Est. tax owed @ 24.0%
- −$98
- After-tax cash flow
- $2,513/yr
For passive investors: Depreciation is non-cash, so a rental often shows a tax loss while cash-flowing — sheltering income. Rental losses are passive: they offset passive income freely, and up to $25,000/yr can offset ordinary (W-2) income if you actively participate and your MAGI is under $100k (phasing out to $0 by $150k); unused losses carry forward. On sale, claimed depreciation is recaptured at up to 25%, and gains may owe capital-gains tax (a 1031 exchange can defer both). Figures are a year-1 estimate at your 24.0% rate — not tax advice; consult a CPA.
Schools (NCES district)
- District
- Clinton City Schools
- NCES district ID
- 3700930
- Math proficiency
- 46% ▲ 7.00%
- Reading proficiency
- 40% ▲ 3.00%
- Median HH income
- $34,166
- Composite
- 35.5/100
- National rank
- #4919
- State rank
- #102 of 178 in NC
Livability — Clinton
- Score
- 66/100
- State rank
- #261
- US rank
- #11402
Category grades
Schools grade is shown separately in the Schools card above.
Census & demographics
- Census place
- Clinton, NC
- City population
- 26,314
- Population (ZIP)
- 26,314
Population outlook (Sampson County) Hauer SSP2
- Today (2025)
- 63,499 people
- By 2030
- 62,970 · -0.8%
- By 2040
- 61,609 · -3.0%
- By 2050
- 60,462 · -4.8%
- By 2075
- 60,108 · -5.3%
- By 2100
- 62,120 · -2.2%
Race, ethnicity, and origin ACS 2023
- Neighborhood character
- Diverse neighborhood (Simpson 0.69)
- Race & ethnicity
- White 40% Black 29% Hispanic / Latino 26% Two or more races 4% Native American 4%
- Hispanic origin (detail)
- Mexican 12% Cuban 1%
- Common ancestry
- Serbian 1% Slovak 1%
- Foreign-born
- 15% · Canada
- Languages at home
- 77% English-only · Spanish 22%
Political lean MEDSL · Sampson
- 2024 margin
- Strong R (+29.8) · D 34.8% · R 64.6%
- 2008→2024 swing
- -21.3pp toward R · 2008: -8.4pp · 2024: -29.8pp
- All cycles
- 2024: R+29.8 2020: R+22.5 2016: R+16.7 2012: R+11.0 2008: R+8.4
Not yet ingested
- Civics
- —
Market trends
- HPI YoY
- ▼ -49.24%
- Current HPI
- 236.0823
- Rent YoY
- —
- Metro
- —
- State GDP YoY
- ▲ 3.28%
- F500 in state
- 26
Industry mix (Fortune 500 HQ in NC)
| Industry | F500 HQs | Revenue |
|---|---|---|
| Financial Services | 2 | $213B |
|
||
| Retail | 2 | $95B |
|
||
| Industrial Conglomerate | 1 | $38B |
|
||
| Metals / Steel | 1 | $35B |
|
||
| Utilities | 1 | $30B |
|
||
| Industrial Machinery | 1 | $19B |
|
||
Price history
+11.2% since first listed17 events — show timeline
- 2026-03-06 Listed $139,000 Hive MLS
- 2026-01-30 Listing Removed — Hive MLS
- 2025-12-09 Relisted — Hive MLS
- 2025-11-28 Listing Removed — Hive MLS
- 2025-10-30 Price Changed $139,000 Hive MLS
- 2025-10-09 Price Changed $149,000 Hive MLS
- 2025-09-13 Relisted — Hive MLS
- 2025-08-30 Listing Removed — Hive MLS
- 2025-07-31 Relisted — Hive MLS
- 2025-07-30 Listing Removed — Hive MLS
- 2025-07-14 Price Changed $159,000 Hive MLS
- 2025-07-09 Price Changed $169,000 Hive MLS
- 2025-05-03 Listed $179,000 Hive MLS
- 2025-02-28 Listing Removed — Hive MLS
- 2024-12-12 Listed $194,900 Hive MLS
- 2015-01-24 Listing Removed — Hive MLS
- 2014-10-30 Listed $125,000 Hive MLS
Property tax history
+5.3%/yrLatest (2025): $1,858 · +5.6% YoY. Source: county tax records.
Cash-flow waterfall
monthlySold comps — $/sqft
last 12 mo · ≤1 miLoading sold comps…