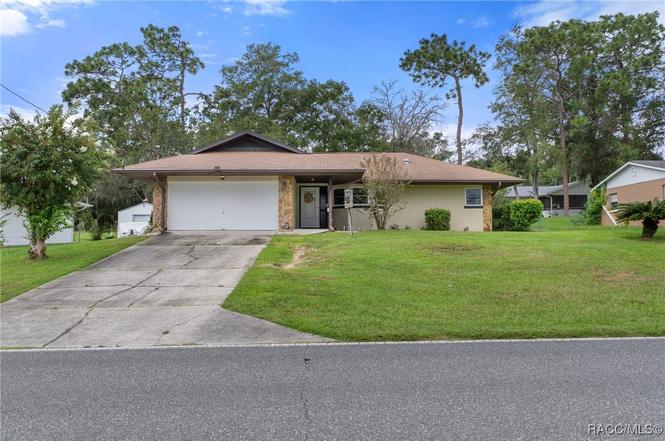
811 S Apopka Ave · Inverness, FL
Flood risk 4/10 · Minor
- FEMA flood zone
- X (unshaded)
- Chance of flooding over 30 yrs
- 0.22%
- Est. flood insurance / yr
- $507 – $1,088
Fire risk 3/10 · Minor
- Est. fire insurance / yr
- $947 – $1,759
Heat risk 9/10 · Severe
- Hot days now (above 108°F)
- 7 days/yr
- Hot days in 30 yrs
- 24 days/yr
Wind risk 9/10 · Severe
- Chance of severe wind over 30 yrs
- 99.0%
Air-quality risk 1/10 · Minimal
- Unhealthy air days now
- 0 days/yr
- Unhealthy air days in 30 yrs
- 0 days/yr
Risk factors via First Street. Map © Google.
Why this score? — see what drove the D grade
The composite is a weighted blend of 9 inputs, each scored 0–100. Each bar is that input's sub-score; the figure is the points it added to the 100-point composite (weight × sub-score).
- Cash flow +14.9/30.0
- ARV discount +9.2/15.0
- DSCR +4.5/10.0
- Schools +4.1/10.0
- Livability +3.4/5.0
- 1% rule +2.9/10.0
- Rent growth +2.5/5.0
- Condition / age +2.5/5.0
- Appreciation +0.0/10.0
$198,900
🖨 Deal sheet (PDF) 📄 Offer letter ✓ Due diligence
Listing remarks MLS
ACCENT ON VALUE--2/2/2 IDEALLY LOCATED CLOSE TO ALL CONVENIENCES. This two bedroom, split plan home features full two car garage, enclosed porch, great room with fireplace. Open plan lends itself to entertaining and cathedral ceiling offers feeling of spaciousness. CITY WATER. You are within minutes from shopping, bike trail, medical, schools. Perfect year round or winter home.
Key facts
- Cathedral ceilings
- Master ensuite
- Gas fireplace
Tags
Neighborhood map
What this means for you Summary
Snapshot
- This is a 2-bed/2.0-bath single-family listed at $199k.
Deal economics
- At list price, monthly cash flow is $57 ($687/yr) — positive.
- The deal already cash-flows at list — no discount required.
- To meet the 1% rule (rent ≥ 1% of price), the offer needs to be $157k (21.2% below list).
- Recommended offer: $157k (21.2% below list) — sets the bar for 1% rule.
- Cap rate 6.6% vs local median 4.9% in Inverness — top-decile yield for the area; either an underpriced asset or a hidden risk that comps aren't pricing in. Stress-test before assuming the spread holds.
Location & tenants
- Location reads 67/100 on livability (#564 in FL) — a middle-class / working-renter tenant base. Strengths: cost of living A+, housing A-; Watch: health & safety C-, amenities F, commute F.
- Citrus (rural): math 49% / reading 50% proficiency, ranked #44 of 73 in FL (top 60%) — families likely to look elsewhere, expect single-tenant / working-renter base with shorter leases.
- Zoned schools: Inverness Primary School (math 54% / reading 55%, grade C, #892 of 2,144 statewide, top 44%, 683 students, 65% FRL); Inverness Middle School (math 52% / reading 48%, grade C, #254 of 571 statewide, top 45%, 1,017 students, 60% FRL); Citrus High School (math 34% / reading 51%, grade F, #264 of 667 statewide, top 41%, 1,503 students, 54% FRL) — zoned schools at 60% FRL track the district average.
- Market conditions: 262 active listings in the ZIP; 13 comparable units currently listed for rent nearby; rentals at typical pace (median 24d on market — plan ~3-4 weeks tenant-placement turnaround); 2,443 units permitted in Citrus County in 2024 (0 in 5+ unit buildings).
Forward outlook
- Local home prices are declining (-3.0%/yr); year-one equity from $1k of loan paydown is wiped out by about $6k of value loss. Plan a longer hold.
- Citrus County population projected to shrink 10% by 2050 — rents likely to lag national; underwrite the cash flow, not the appreciation.
Negotiation context
- It's been on market 216 days — a 12% lower offer ($175k) is reasonable based on typical stale-listing flexibility.
- 3 sale attempts since 13y ago; this cycle's ask has dropped $17k (8%) from the opening price — seller is motivated, your offer sets the floor, not the list.
- Current owner paid $65k; list at $199k implies a 206% gain — meaningful room to come down on a strong offer.
Risks & watch-outs
- Climate carrying-cost: severe wind risk, 99% chance of damaging wind over 30y; extreme-heat days projected 7→24/yr by 2055 (HVAC capex compounding) — expect insurance premiums to compound above CPI over the hold.
Questions for the listing agent
- It's been on market 216 days. Have you received any prior offers? Is the seller open to a 21% concession, seller financing, or rate buy-down credit?
- Why hasn't it sold? Are there any deal-killer items the seller is aware of (foundation, flood, title, zoning, code violations)?
- Is there a deadline driving the sale (1031 exchange, divorce, estate, relocation)? That informs how much negotiation room exists.
- Schools are B-rated — typically a magnet for longer-tenancy family renters. What's the average tenant stay here, and is there a school-zone premium baked into asking?
- The area grade is low — what's the realistic commute time and amenity access for the typical tenant pool here? Any planned neighborhood developments (good or bad) we should know about?
- What's the average days-on-market for RENTAL listings here right now (not sales)? A rising rental-DOM trend means longer vacancies and softer asking-rent achievability than the comps imply.
- What's the recent tenant-quality profile in this submarket — average credit score on applications, eviction rate, late-payment / NSF rate, and stable-employment percentage? A property-management company in the area should have these aggregated.
- How much new for-sale + rental construction is in the pipeline within 1–3 miles? Heavy new supply typically softens prices + rents 12–24 months out; constrained supply supports both.
Investment metrics
- 1% rule
- 0.79% ✗
- Cap rate
- 6.64%
- Cash-on-cash
- 1.23%
- DSCR
- 1.05
- GRM
- 10.6
CMA / ARV
- ARV (on-the-fly)
- $206,822
- Comps found
- 12
Show comp detail 12 sales within ~0.75 mi
| Address | Dist | Beds/Ba | Sqft | Sold | Price | $/sf | Match |
|---|---|---|---|---|---|---|---|
| 811 S Apopka Ave | 0.00mi | 2/2.0 | 1,106 (0%) | 1mo | $185,000 | $167 | 99 |
| 821 Maple Ave | 0.13mi | 2/2.0 | 1,084 (-2%) | 4mo | $191,000 | $176 | 88 |
| 300 Daffodil St | 0.17mi | 2/2.0 | 1,135 (+3%) | 6mo | $143,400 | $126 | 83 |
| 810 Windy Ave | 0.19mi | 3/2.0 (+1) | 1,157 (+5%) | 2mo | $265,000 | $229 | 77 |
| 101 E Inverness Blvd | 0.29mi | 2/2.0 | 1,138 (+3%) | 7mo | $205,000 | $180 | 76 |
| 105 E Harvard St | 0.57mi | 2/2.0 | 1,104 (-0%) | 3mo | $215,000 | $195 | 71 |
| 729 Desota Ave | 0.44mi | 2/2.0 | 1,134 (+2%) | 6mo | $255,500 | $225 | 70 |
| 405 E Circlewood St | 0.61mi | 2/2.0 | 1,124 (+2%) | 2mo | $215,900 | $192 | 67 |
| 1037 Fordham Ter | 0.47mi | 2/2.0 | 1,057 (-4%) | 7mo | $185,000 | $175 | 65 |
| 210 Red Rose Ln | 0.50mi | 2/2.0 | 973 (-12%) | 1mo | $205,000 | $211 | 56 |
| 3415 S Apopka Ave | 0.70mi | 2/1.0 | 1,126 (+2%) | 8mo | $164,550 | $146 | 54 |
| 410 Tulip Ln | 0.50mi | 3/2.0 (+1) | 1,250 (+13%) | 5mo | $234,000 | $187 | 46 |
Match score weights: distance 35% · size 25% · config 20% · recency 20%. Top-matched comps best support the ARV.
Projected returns pro-forma
-3.0% appreciation · 3.0% rent growth · sell at horizon
- IRR
- -14.4%
- Equity multiple
- 0.49×
- Total profit
- $-28,679
- Equity at exit
- $29,657
- IRR
- -5.7%
- Equity multiple
- 0.63×
- Total profit
- $-20,664
- Equity at exit
- $17,197
Cash invested: $55,692 (down + closing). Projections, not guarantees.
Landlord ↔ Tenant lean methodology
- Overall (STATE)
- 87 Strongly Landlord-Friendly
- State Florida
- 87 Strongly Landlord-Friendly · R+3
- County
- — inherits STATE
- City
- — inherits STATE
ZIP-level market 34452
- Home prices YoY
- -25.2%
- Active inventory
- 262
- Price-to-rent
- 10.6×
Monthly cashflow live
- Estimated rent
- $1,568 high interval (Pro) →
- Mortgage (P&I)
- −$1,043
- Tax from tax record
- −$55 /mo · $663/yr
- Insurance
- −$83
- HOA
- −$0
- Lot rent
- −$0
- Vacancy / Maint / Mgmt
- −$329
- Net cashflow
- $57
Break-even live
Sensitivity live
| Price | -10% $170 | -5% $114 | +0% $57 | +5% $1 | +10% $-55 |
|---|---|---|---|---|---|
| Rent | -10% $-67 | -5% $-5 | +0% $57 | +5% $119 | +10% $181 |
| Rate | -1.0pp $157 | -0.5pp $108 | base $57 | +0.5pp $6 | +1.0pp $-47 |
UW: 25.0% down · 7.5% · 30yr · 1.5% tax · 5.0% vac · 8.0% maint · 8.0% mgmt
Financing live
Cash to close
- Down payment
- $49,725
- Closing costs
- $5,967
- Reserves months
- —
- Total cash needed
- —
Loan-product check · same deal, 3 products live
Conventional
25% down · 7.5% · 30yr
- Down + closing
- —
- Monthly P&I
- —
- Monthly cashflow
- —
- DSCR
- —
- Eligible?
- —
Personal DTI + credit; lowest rate.
DSCR
20% down · 8.5% · 30yr
- Down + closing
- —
- Monthly P&I
- —
- Monthly cashflow
- —
- DSCR
- —
- Eligible?
- —
No personal income docs; deal must DSCR.
Hard money
10% down · 12.0% · 12mo
- Down + closing
- —
- Monthly P&I
- —
- Monthly cashflow
- —
- DSCR
- —
- Eligible?
- —
Short-term bridge; refi at stabilization.
Rent comps 13 comps
| Address | Beds | Baths | Sqft | Rent | $/sqft | DOM | Units | Dist |
|---|---|---|---|---|---|---|---|---|
| 608 Whitney Ave Inverness, FL | 3.0 | 2.0 | 1288 | $1,660 | $1.29 | 23d | 1 | 0.25mi |
| 400 S Pine Ave Unit 10 Inverness, FL | 2.0 | 1.0 | 700 | $1,200 | $1.71 | 23d | 1 | 0.50mi |
| 315 S Seminole Ave Inverness, FL | 3.0 | 1.0 | 792 | $1,300 | $1.64 | 23d | 1 | 0.56mi |
| 3367 S Dalton Ter Inverness, FL | 3.0 | 2.0 | 1357 | $1,795 | $1.32 | 23d | 1 | 0.72mi |
| 6106 E Calico Ln Inverness, FL | 2.0 | 1.0 | 1126 | $1,500 | $1.33 | 23d | 1 | 0.78mi |
| 908 Columbia Ln Inverness, FL | 3.0 | 2.0 | 1334 | $1,800 | $1.35 | 23d | 1 | 0.84mi |
| 1112 Eden Dr Inverness, FL | 3.0 | 2.0 | 1334 | $1,750 | $1.31 | 23d | 1 | 0.85mi |
| 6874 E Culpepper Ct Inverness, FL | 2.0 | 2.0 | 1233 | $1,600 | $1.30 | 23d | 1 | 0.95mi |
| 412 Tompkins St Unit 4 Inverness, FL | 2.0 | 1.0 | 810 | $1,300 | $1.60 | 23d | 1 | 1.02mi |
| 210 Talmage Ave Inverness, FL | 3.0 | 2.0 | 1400 | $1,600 | $1.14 | 23d | 1 | 1.21mi |
| 417 Wilda Ave Inverness, FL | 2.0 | 1.0 | 870 | $1,300 | $1.49 | 23d | 1 | 1.34mi |
| 732 Sinclair Ter Inverness, FL | 3.0 | 2.0 | 1347 | $1,700 | $1.26 | 23d | 1 | 1.37mi |
| 1017 Carnegie Dr Inverness, FL | 3.0 | 2.0 | 1334 | $1,800 | $1.35 | 23d | 1 | 1.48mi |
Listing history 11 events
-
2026-04-27status Pending
-
2026-04-08price $198,900
-
2026-03-22status Active
-
2026-03-22historical
-
2025-09-20$215,900 Active
-
2014-02-18soldstatus $65,000
-
2014-02-14soldstatus $65,000 380-char remark
Show marketing remark (380 chars)
ACCENT ON VALUE--2/2/2 IDEALLY LOCATED CLOSE TO ALL CONVENIENCES. This two bedroom, split plan home features full two car garage, enclosed porch, great room with fireplace. Open plan lends itself to entertaining and cathedral ceiling offers feeling of spaciousness. CITY WATER. You are within minutes from shopping, bike trail, medical, schools. Perfect year round or winter home.
-
2013-11-16$68,900 380-char remark
Show marketing remark (380 chars)
ACCENT ON VALUE--2/2/2 IDEALLY LOCATED CLOSE TO ALL CONVENIENCES. This two bedroom, split plan home features full two car garage, enclosed porch, great room with fireplace. Open plan lends itself to entertaining and cathedral ceiling offers feeling of spaciousness. CITY WATER. You are within minutes from shopping, bike trail, medical, schools. Perfect year round or winter home.
-
1987-01-01soldstatus $56,000
-
1986-05-01soldstatus $7,500
-
1980-04-01soldstatus $7,000
ⓘ Source: listings_history table (triggers on properties + properties_extension) + one-shot
backfill from property_details.listing_events for pre-trigger history.
Tax reassessment forecast FL · Resets to sale price
- Current annual tax
- $663 · $55/mo
- Projected year-2 tax
- $1,651 · $138/mo
- Expected delta
- +$988/yr (+$82/mo · 149.1%)
ⓘ Screening estimate from a state-policy table — verify with the county assessor before closing.
Climate risk First Street
- Flood 4/10 Moderate FEMA zone X (unshaded) · 22% chance over 30 yrs
- Wildfire 3/10 Moderate
- Heat 9/10 Extreme 7 d/yr ≥108°F today · 24 d/yr by 30 yrs out
- Wind 9/10 Extreme 99% chance of damaging wind over 30 yrs
- Air quality 1/10 Low 0 unhealthy d/yr today · 0 by 30 yrs out
Nearby sold comps map
Loading sold comps map…
Walkable amenities ~0.75 mi
Loading nearby amenities…
Taxation est. · year 1
- Rental income
- $18,811
- − Mortgage interest
- −$11,141
- − Property taxes
- −$663
- − Insurance
- −$994
- − Repairs & maintenance
- −$1,505
- − Management
- −$1,505
- − Depreciation
- −$5,786
- Taxable loss
- −$2,783
- Est. tax savings @ 24.0%
- +$668
- After-tax cash flow
- $1,355/yr
For passive investors: Depreciation is non-cash, so a rental often shows a tax loss while cash-flowing — sheltering income. Rental losses are passive: they offset passive income freely, and up to $25,000/yr can offset ordinary (W-2) income if you actively participate and your MAGI is under $100k (phasing out to $0 by $150k); unused losses carry forward. On sale, claimed depreciation is recaptured at up to 25%, and gains may owe capital-gains tax (a 1031 exchange can defer both). Figures are a year-1 estimate at your 24.0% rate — not tax advice; consult a CPA.
Schools (NCES district)
- District
- Citrus
- NCES district ID
- 1200270
- Math proficiency
- 49% ▼ -10.00%
- Reading proficiency
- 50% ▼ -6.00%
- Median HH income
- $38,618
- Composite
- 41.28/100
- National rank
- #3519
- State rank
- #44 of 73 in FL
Livability — Inverness
- Score
- 67/100
- State rank
- #564
- US rank
- #10791
Category grades
Schools grade is shown separately in the Schools card above.
Census & demographics
- Census place
- Inverness, FL
- City population
- 10,621
- Population (ZIP)
- 13,729
Population outlook (Citrus County) Hauer SSP2
- Today (2025)
- 138,622 people
- By 2030
- 136,886 · -1.3%
- By 2040
- 132,009 · -4.8%
- By 2050
- 125,196 · -9.7%
- By 2075
- 108,570 · -21.7%
- By 2100
- 84,454 · -39.1%
Race, ethnicity, and origin ACS 2023
- Neighborhood character
- Predominantly White (86%)
- Race & ethnicity
- White 86% Hispanic / Latino 9% Two or more races 5% Asian 2%
- Hispanic origin (detail)
- Mexican 1% Puerto Rican 3% Cuban 2% Dominican 1%
- Common ancestry
- Lithuanian 3% Romanian 2% Slovak 2%
- Foreign-born
- 4% · Canada, Jamaica, Dominican Republic
- Languages at home
- 92% English-only · Spanish 6%
Political lean MEDSL · Citrus
- 2024 margin
- Solid R (+45.9) · D 26.8% · R 72.6%
- 2008→2024 swing
- -29.8pp toward R · 2008: -16.1pp · 2024: -45.9pp
- All cycles
- 2024: R+45.9 2020: R+41.0 2016: R+39.7 2012: R+21.9 2008: R+16.1
Not yet ingested
- Civics
- —
Market trends
- HPI YoY
- ▼ -105.43%
- Current HPI
- 312.8871
- Rent YoY
- —
- Metro
- —
- State GDP YoY
- ▲ 3.28%
- F500 in state
- 36
Industry mix (Fortune 500 HQ in FL)
| Industry | F500 HQs | Revenue |
|---|---|---|
| Industrial Technology | 2 | $29B |
|
||
| Insurance | 2 | $17B |
|
||
| Retail | 1 | $60B |
|
||
| Technology Distribution | 1 | $58B |
|
||
| Homebuilding | 1 | $35B |
|
||
| Technology Manufacturing | 1 | $35B |
|
||
Price history
+2741.4% since first listed11 events — show timeline
- 2026-04-27 Pending — RACC
- 2026-04-08 Price Changed $198,900 RACC
- 2026-03-22 Relisted — RACC
- 2026-03-22 Delisted — RACC
- 2025-09-20 Listed $215,900 RACC
- 2014-02-18 Sold (Public Records) $65,000 Public Records
- 2014-02-14 Sold (MLS) $65,000 RACC
- 2013-11-16 Listed $68,900 RACC
- 1987-01-01 Sold (Public Records) $56,000 Public Records
- 1986-05-01 Sold (Public Records) $7,500 Public Records
- 1980-04-01 Sold (Public Records) $7,000 Public Records
Property tax history
+3.1%/yrLatest (2025): $663 · +1.3% YoY. Source: county tax records.
Cash-flow waterfall
monthlySold comps — $/sqft
last 12 mo · ≤1 miLoading sold comps…