117 Constitution Ct · Broad Creek, NC
Flood risk 1/10 · Minimal
- FEMA flood zone
- X (unshaded)
- Chance of flooding over 30 yrs
- 0.0%
- Est. flood insurance / yr
- $507 – $1,088
Fire risk 5/10 · Moderate
- Est. fire insurance / yr
- $906 – $1,684
Heat risk 9/10 · Severe
- Hot days now (above 102°F)
- 7 days/yr
- Hot days in 30 yrs
- 20 days/yr
Wind risk 8/10 · Major
- Chance of severe wind over 30 yrs
- 99.0%
Air-quality risk 2/10 · Minimal
- Unhealthy air days now
- 2 days/yr
- Unhealthy air days in 30 yrs
- 2 days/yr
Risk factors via First Street. Map © Google.
Why this score? — see what drove the B grade
The composite is a weighted blend of 9 inputs, each scored 0–100. Each bar is that input's sub-score; the figure is the points it added to the 100-point composite (weight × sub-score).
- Cash flow +30.0/30.0
- 1% rule +10.0/10.0
- DSCR +10.0/10.0
- ARV discount +8.4/15.0
- Schools +5.1/10.0
- Livability +3.2/5.0
- Rent growth +2.5/5.0
- Condition / age +1.0/5.0
- Appreciation +0.0/10.0
$355,800
🖨 Deal sheet 📄 Offer letter ✓ Due diligence
Listing remarks
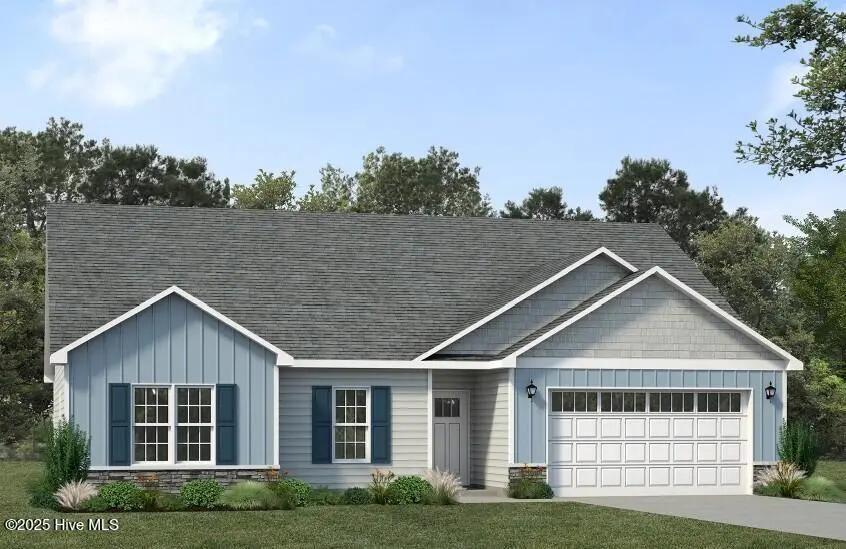
NO SHOWINGS! PRE SALE! The single story classic Bayhill is a part of the JC Jackson's Carolina Series. With three bedrooms and two bathrooms this split bedroom home features a great room open to the kitchen and dining area that includes a corner pantry, and center eat at island. The owner's suite is separate from the secondary bedrooms, overlooks the backyard, and features a large walk-in closet.
Key facts
- Corner pantry
- Center eat at island
- Single story
Tags
Neighborhood map
What this means for you Summary
Snapshot
- This is a 3-bed/2.0-bath single-family listed at $356k. Condition is rated poor.
Deal economics
- At list price, monthly cash flow is $7k ($88k/yr) — positive.
- The deal already cash-flows at list — no discount required.
- Meets the 1% rule at list price ($12k rent vs $356k).
- Cap rate 31.0% vs local median 22.6% in Broad Creek — top-decile yield for the area; either an underpriced asset or a hidden risk that comps aren't pricing in. Stress-test before assuming the spread holds.
Location & tenants
- Location reads 64/100 on livability (#340 in NC) — a middle-class / working-renter tenant base. Strengths: crime A+, cost of living A+, housing A+; Watch: amenities F, commute F, health & safety D-.
- Carteret County Public Schools (rural): math 59% / reading 61% proficiency, ranked #31 of 178 in NC (top 17%) — acceptable for families but not a draw, mixed tenant base, ~2y average lease.
- Zoned schools: Newport Elementary (math 48% / reading 45%, grade D-, #542 of 1,410 statewide, top 39%, 645 students, 100% FRL); Newport Middle (math 39% / reading 56%, grade C-, #140 of 475 statewide, top 30%, 378 students, 98% FRL); West Carteret High (math 82% / reading 71%, grade A-, #89 of 535 statewide, top 16%, 1,146 students, 40% FRL) — zoned schools average 79% FRL vs 39% district-wide (40 pts higher); higher-poverty schools than district average — tighter screening recommended.
- Market conditions: 216 active listings in the ZIP; 935 units permitted in Carteret County in 2024 (360 in 5+ unit buildings).
- At $12,434/mo this rent would consume 212% of the median local household income ($70k/yr) (locally 461% of renters already pay >50% of income on rent) — very limited rent-growth headroom before tenants either downsize or default.
Forward outlook
- Local home prices are declining (-3.0%/yr); year-one equity from $2k of loan paydown is wiped out by about $11k of value loss. Plan a longer hold.
- Carteret County population projected at +9% by 2050 — modest demand growth; plan on rents tracking national, not racing it.
- At projected returns (-3.0% appreciation + 3.0% rent growth), your $100k cash investment doubles in ~2 years — after that, you're playing with house money.
Negotiation context
- Only 1 days on market — expect competitive offers; lowballing is unlikely to land.
Risks & watch-outs
- Climate carrying-cost: severe wind risk, 99% chance of damaging wind over 30y; moderate wildfire risk; extreme-heat days projected 7→20/yr by 2055 (HVAC capex compounding) — expect insurance premiums to compound above CPI over the hold.
Questions for the listing agent
- Have any recent inspections been done? Can we get a copy of the seller's disclosures and any deferred-maintenance estimates?
- What does the HOA fee cover, when was the last increase, and are there any pending special assessments or reserve-fund shortfalls?
- Is there a deadline driving the sale (1031 exchange, divorce, estate, relocation)? That informs how much negotiation room exists.
- Schools are F-rated, which usually means shorter tenancies and higher turnover. Who's the typical renter profile here, and what's been the actual vacancy rate?
- What's the average days-on-market for RENTAL listings here right now (not sales)? A rising rental-DOM trend means longer vacancies and softer asking-rent achievability than the comps imply.
- What's the recent tenant-quality profile in this submarket — average credit score on applications, eviction rate, late-payment / NSF rate, and stable-employment percentage? A property-management company in the area should have these aggregated.
- How much new for-sale + rental construction is in the pipeline within 1–3 miles? Heavy new supply typically softens prices + rents 12–24 months out; constrained supply supports both.
Investment metrics
- 1% rule
- 3.49% ✓
- Cap rate
- 31.04%
- Cash-on-cash
- 88.38%
- DSCR
- 4.93
- GRM
- 2.4
CMA / ARV
- ARV (on-the-fly)
- $363,192
- Comps found
- 12
Show comp detail 12 sales within ~0.75 mi
| Address | Dist | Beds/Ba | Sqft | Sold | Price | $/sf | Match |
|---|---|---|---|---|---|---|---|
| 121 Guthrie Dr | 0.20mi | 3/2.0 | 1,497 (-8%) | 5mo | $374,500 | $250 | 72 |
| 270 Jones Ridge Ln | 0.50mi | 3/2.0 | 1,618 (-1%) | 8mo | $375,000 | $232 | 68 |
| 227 Jones Ridge Ln | 0.51mi | 4/2.0 (+1) | 1,705 (+4%) | 3mo | $377,000 | $221 | 62 |
| 111 Whitewater Cv | 0.40mi | 3/2.0 | 1,733 (+6%) | 13mo | $389,900 | $225 | 61 |
| 129 Ballantine Grove Ln | 0.41mi | 3/2.0 | 1,760 (+8%) | 11mo | $387,000 | $220 | 59 |
| 202 Jones Ridge Ln | 0.45mi | 3/2.0 | 1,475 (-10%) | 8mo | $350,000 | $237 | 56 |
| 111 Dixon Pond Dr Lot 96 | 0.38mi | 4/2.0 (+1) | 1,774 (+8%) | 16mo | $369,999 | $209 | 50 |
| 214 Jones Ridge Ln Lot 88 | 0.49mi | 3/2.0 | 1,475 (-10%) | 14mo | $339,999 | $231 | 49 |
| 210 Jones Ridge Ln Lot 89 | 0.47mi | 4/2.0 (+1) | 1,774 (+8%) | 13mo | $374,199 | $211 | 48 |
| 200 Jones Ridge Ln Lot 91 | 0.42mi | 4/2.0 (+1) | 1,774 (+8%) | 16mo | $369,999 | $209 | 47 |
| 206 Fawns Path Cir Lot 87 | 0.50mi | 4/2.0 (+1) | 1,774 (+8%) | 17mo | $385,990 | $218 | 44 |
| 211 Fawns Path Cir Lot 83 | 0.55mi | 4/2.0 (+1) | 1,774 (+8%) | 15mo | $393,000 | $222 | 43 |
Match score weights: distance 35% · size 25% · config 20% · recency 20%. Top-matched comps best support the ARV.
Projected returns pro-forma
-3.0% appreciation · 3.0% rent growth · sell at horizon
- IRR
- 89.0%
- Equity multiple
- 5.11×
- Total profit
- $409,848
- Equity at exit
- $53,051
- IRR
- 92.0%
- Equity multiple
- 10.63×
- Total profit
- $959,439
- Equity at exit
- $30,763
Cash invested: $99,624 (down + closing). Projections, not guarantees.
Landlord ↔ Tenant lean methodology
- Overall (STATE)
- 85 Strongly Landlord-Friendly
- State North Carolina
- 85 Strongly Landlord-Friendly · R+3
- County
- — inherits STATE
- City
- — inherits STATE
ZIP-level market 28570
- Home prices YoY
- -16.2%
- Active inventory
- 216
- Price-to-rent
- 2.4×
Monthly cashflow live
- Estimated rent
- $12,434 medium interval (Pro) →
- Mortgage (P&I)
- −$1,866
- Tax est. 1.5%
- −$445 /mo · $5,337/yr
- Insurance
- −$148
- HOA
- −$27
- Vacancy / Maint / Mgmt
- −$2,611
- Net cashflow
- $7,337
Break-even live
UW: 25.0% down · 7.5% · 30yr · 1.5% tax · 5.0% vac · 8.0% maint · 8.0% mgmt
Financing live
Cash to close
- Down payment
- $88,950
- Closing costs
- $10,674
- Reserves months
- —
- Total cash needed
- —
Loan-product check · same deal, 3 products live
Conventional
25% down · 7.5% · 30yr
- Down + closing
- —
- Monthly P&I
- —
- Monthly cashflow
- —
- DSCR
- —
- Eligible?
- —
Personal DTI + credit; lowest rate.
DSCR
20% down · 8.5% · 30yr
- Down + closing
- —
- Monthly P&I
- —
- Monthly cashflow
- —
- DSCR
- —
- Eligible?
- —
No personal income docs; deal must DSCR.
Hard money
10% down · 12.0% · 12mo
- Down + closing
- —
- Monthly P&I
- —
- Monthly cashflow
- —
- DSCR
- —
- Eligible?
- —
Short-term bridge; refi at stabilization.
HOA detail
- Monthly dues
- $27 · $324/yr
Listing history 2 events
-
2026-03-25status Pending
-
2026-03-24$355,800 Active
ⓘ Source: listings_history table (triggers on properties + properties_extension) + one-shot
backfill from property_details.listing_events for pre-trigger history.
Climate risk First Street
- Flood 1/10 Low FEMA zone X (unshaded) · 0% chance over 30 yrs
- Wildfire 5/10 Major
- Heat 9/10 Extreme 7 d/yr ≥102°F today · 20 d/yr by 30 yrs out
- Wind 8/10 Severe 99% chance of damaging wind over 30 yrs
- Air quality 2/10 Low 2 unhealthy d/yr today · 2 by 30 yrs out
Nearby sold comps map
Loading sold comps map…
Walkable amenities ~0.75 mi
Loading nearby amenities…
Taxation est. · year 1
- Rental income
- $149,208
- − Mortgage interest
- −$19,930
- − Property taxes
- −$5,337
- − Insurance
- −$1,779
- − Repairs & maintenance
- −$11,937
- − Management
- −$11,937
- − HOA
- −$324
- − Depreciation
- −$10,351
- Taxable income
- $87,614
- Est. tax owed @ 24.0%
- −$21,027
- After-tax cash flow
- $67,017/yr
For passive investors: Depreciation is non-cash, so a rental often shows a tax loss while cash-flowing — sheltering income. Rental losses are passive: they offset passive income freely, and up to $25,000/yr can offset ordinary (W-2) income if you actively participate and your MAGI is under $100k (phasing out to $0 by $150k); unused losses carry forward. On sale, claimed depreciation is recaptured at up to 25%, and gains may owe capital-gains tax (a 1031 exchange can defer both). Figures are a year-1 estimate at your 24.0% rate — not tax advice; consult a CPA.
Condition & rehab AI · 2 photos
This single-story home requires extensive repairs and updates to its exterior, roof, landscaping, and interior systems. Significant improvements are needed to bring the property up to a livable condition.
Repairs flagged
- Major roof — Significant wear and tear visible.
- Major exterior siding — Significant wear and tear visible.
- Major landscaping — Sparse and unmaintained appearance.
- Major interior walls/paint — No interior walls or paint are visible in the photos, but the exterior suggests poor condition.
- Major bathrooms — No bathrooms are visible in the photos, but the exterior suggests poor condition.
- Major kitchen — No kitchen is visible in the photos, but the exterior suggests poor condition.
- Major systems — No systems are visible in the photos, but the exterior suggests poor condition.
- Major windows — No windows are visible in the photos, but the exterior suggests poor condition.
- Major foundation/structure — No foundation or structure is visible in the photos, but the exterior suggests poor condition.
- Major HVAC/mechanicals — No HVAC or mechanicals are visible in the photos, but the exterior suggests poor condition.
- Major landscaping — Sparse and unmaintained appearance, no visible curb appeal features.
Value-add opportunities
- Both landscaping and curb appeal — Improving the landscaping and curb appeal would enhance both the resale and rental value.
- Both exterior repairs and painting — Repairing and repainting the exterior would significantly improve the home's appearance and value.
- Both roof replacement — Replacing the roof would address a major issue and improve the home's overall condition.
- Both interior repairs and painting — Repairing and repainting the interior would improve the home's condition and appearance.
- Both bathroom and kitchen updates — Updating the bathrooms and kitchen would improve the home's functionality and appeal.
- Both HVAC and mechanicals — Upgrading the HVAC and mechanicals would improve the home's comfort and energy efficiency.
- Both landscaping and curb appeal — Improving the landscaping and curb appeal would enhance both the resale and rental value.
Renovation cost estimate screening
| Repair item | Severity | Est. cost |
|---|---|---|
| roof · Significant wear and tear visible. | Major | $15,000–50,000 |
| exterior siding · Significant wear and tear visible. | Major | $15,000–50,000 |
| landscaping · Sparse and unmaintained appearance. | Major | $15,000–50,000 |
| interior walls/paint · No interior walls or paint are visible in the photos, but the exterior suggests poor condition. | Major | $15,000–50,000 |
| bathrooms · No bathrooms are visible in the photos, but the exterior suggests poor condition. | Major | $15,000–50,000 |
| kitchen · No kitchen is visible in the photos, but the exterior suggests poor condition. | Major | $15,000–50,000 |
| systems · No systems are visible in the photos, but the exterior suggests poor condition. | Major | $15,000–50,000 |
| windows · No windows are visible in the photos, but the exterior suggests poor condition. | Major | $15,000–50,000 |
| foundation/structure · No foundation or structure is visible in the photos, but the exterior suggests poor condition. | Major | $15,000–50,000 |
| HVAC/mechanicals · No HVAC or mechanicals are visible in the photos, but the exterior suggests poor condition. | Major | $15,000–50,000 |
| landscaping · Sparse and unmaintained appearance, no visible curb appeal features. | Major | $15,000–50,000 |
| Total estimated repair cost · 11 items | $165,000–550,000 |
Value-add ROI direction
- Both landscaping and curb appeal — Improving the landscaping and curb appeal would enhance both the resale and rental value. ↑
- Both exterior repairs and painting — Repairing and repainting the exterior would significantly improve the home's appearance and value. ↑
- Both roof replacement — Replacing the roof would address a major issue and improve the home's overall condition. ↑
- Both interior repairs and painting — Repairing and repainting the interior would improve the home's condition and appearance. ↑
- Both bathroom and kitchen updates — Updating the bathrooms and kitchen would improve the home's functionality and appeal. ↑
- Both HVAC and mechanicals — Upgrading the HVAC and mechanicals would improve the home's comfort and energy efficiency. ↑
- Both landscaping and curb appeal — Improving the landscaping and curb appeal would enhance both the resale and rental value. ↑
ⓘ Cost ranges are severity-bucket heuristics (US national rule-of-thumb). Get contractor quotes + a written scope before underwriting a rehab budget.
Schools (NCES district)
- District
- Carteret County Public Schools
- NCES district ID
- 3700630
- Math proficiency
- 59% ▲ 5.00%
- Reading proficiency
- 61% ▲ 2.00%
- Median HH income
- $48,330
- Composite
- 50.92/100
- National rank
- #1786
- State rank
- #31 of 178 in NC
Livability — Broad Creek
- Score
- 64/100
- State rank
- #340
- US rank
- #13718
Category grades
Schools grade is shown separately in the Schools card above.
Census & demographics
- Census place
- Broad Creek, NC
- County
- Carteret County · 52,389 people
- City population
- 22,197
- Metro
- Morehead City, NC
- Population (ZIP)
- 22,197
- Household income
- $70,229
- Rent vs Own
- Severe rent burden
- 461.0
Population outlook (Carteret County) Hauer SSP2
- Today (2025)
- 73,443 people
- By 2030
- 75,344 · +2.6%
- By 2040
- 78,142 · +6.4%
- By 2050
- 80,091 · +9.1%
- By 2075
- 86,120 · +17.3%
- By 2100
- 89,408 · +21.7%
Race, ethnicity, and origin ACS 2023
- Neighborhood character
- Predominantly White (82%)
- Race & ethnicity
- White 82% Hispanic / Latino 7% Two or more races 6% Black 3% Asian 1%
- Hispanic origin (detail)
- Mexican 4%
- Common ancestry
- Slovak 3% Romanian 3% Lithuanian 2%
- Foreign-born
- 5% · Canada, Dominican Republic
- Languages at home
- 92% English-only · Spanish 6% German/W. Germanic 1%
Political lean MEDSL · Carteret
- 2024 margin
- Solid R (+43.1) · D 28.0% · R 71.1%
- 2008→2024 swing
- -8.4pp toward R · 2008: -34.7pp · 2024: -43.1pp
- All cycles
- 2024: R+43.1 2020: R+42.0 2016: R+44.5 2012: R+41.0 2008: R+34.7
Not yet ingested
- Civics
- —
Market trends
- HPI YoY
- ▼ -53.54%
- Current HPI
- 276.6589
- Rent YoY
- —
- Metro
- Morehead City, NC
- State GDP YoY
- ▲ 3.28%
- F500 in state
- 26
Industry mix (Fortune 500 HQ in NC)
| Industry | F500 HQs | Revenue |
|---|---|---|
| Financial Services | 2 | $213B |
|
||
| Retail | 2 | $95B |
|
||
| Industrial Conglomerate | 1 | $38B |
|
||
| Metals / Steel | 1 | $35B |
|
||
| Utilities | 1 | $30B |
|
||
| Industrial Machinery | 1 | $19B |
|
||
Price history
2 events — show timeline
- 2026-03-25 Pending — Hive MLS
- 2026-03-24 Listed $355,800 Hive MLS
Cash-flow waterfall
monthlySold comps — $/sqft
last 12 mo · ≤1 miLoading sold comps…