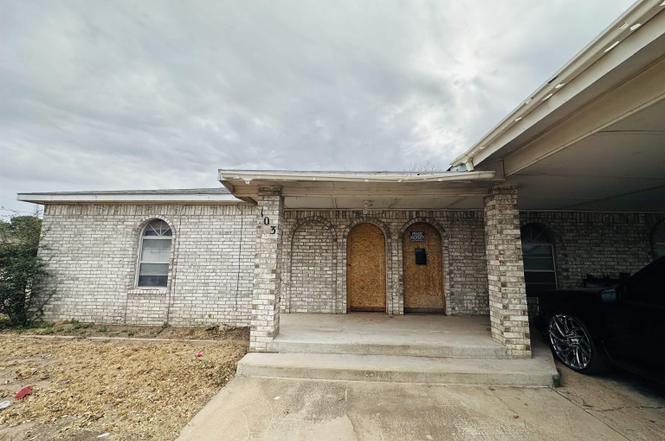
103 W Yeso Dr · Hobbs, NM
Flood risk 1/10 · Minimal
- FEMA flood zone
- X (unshaded)
- Chance of flooding over 30 yrs
- 0.0%
- Est. flood insurance / yr
- $507 – $1,088
Fire risk 7/10 · Major
- Est. fire insurance / yr
- $706 – $1,312
Heat risk 5/10 · Moderate
- Hot days now (above 100°F)
- 7 days/yr
- Hot days in 30 yrs
- 19 days/yr
Wind risk 2/10 · Minimal
- Chance of severe wind over 30 yrs
- 1.0%
Air-quality risk 2/10 · Minimal
- Unhealthy air days now
- 1 days/yr
- Unhealthy air days in 30 yrs
- 1 days/yr
Risk factors via First Street. Map © Google.
Why this score? — see what drove the B- grade
The composite is a weighted blend of 9 inputs, each scored 0–100. Each bar is that input's sub-score; the figure is the points it added to the 100-point composite (weight × sub-score).
- Cash flow +30.0/30.0
- 1% rule +10.0/10.0
- DSCR +10.0/10.0
- ARV discount +7.5/15.0
- Livability +3.3/5.0
- Rent growth +2.5/5.0
- Schools +2.5/10.0
- Condition / age +2.5/5.0
- Appreciation +0.0/10.0
$120,000
🖨 Deal sheet 📄 Offer letter ✓ Due diligence
Listing remarks MLS
Fixer upper with tons of potential! Just needs the right person willing to give it some TLC. Check out this beautiful 4 bedroom/2 bath, brick home on a corner lot in a nice, quiet neighborhood!
Key facts
- 0.3 acre lot
- 2 garage spots
- Built 1965
Neighborhood map
What this means for you Summary
Snapshot
- This is a 4-bed/2.0-bath single-family listed at $120k.
Deal economics
- At list price, monthly cash flow is $1k ($12k/yr) — positive.
- The deal already cash-flows at list — no discount required.
- Meets the 1% rule at list price ($2k rent vs $120k).
- Recommended offer: $116k (3.0% below list) — sets the bar for market timing.
Location & tenants
- Location reads 66/100 on livability (#37 in NM) — a middle-class / working-renter tenant base. Strengths: cost of living A+, housing A+; Watch: employment D+, schools F, crime F.
- Hobbs Municipal Schools (town): math 17% / reading 31% proficiency, ranked #45 of 95 in NM (top 47%) — low school quality limits family demand, transient renter base, plan for 1-2y turnover.
- Market conditions: 231 active listings in the ZIP; 2 comparable units currently listed for rent nearby; 172 units permitted in Lea County in 2024 (0 in 5+ unit buildings).
- This rent runs 43% of the median local income ($63k/yr) — at the standard rent-burdened threshold; future hikes will face affordability resistance.
Forward outlook
- Local home prices are declining (-3.0%/yr); year-one equity from $830 of loan paydown is wiped out by about $4k of value loss. Plan a longer hold.
- Lea County population projected at +50% by 2050 — long-run rental-demand tailwind backs the buy-and-hold thesis.
- At projected returns (-3.0% appreciation + 3.0% rent growth), your $34k cash investment doubles in ~4 years — after that, you're playing with house money.
Negotiation context
- It's been on market 49 days — a 3% lower offer ($116k) is reasonable based on typical stale-listing flexibility.
- 3 sale attempts since 4y ago; this cycle's ask has dropped $20k (14%) from the opening price — seller is motivated, your offer sets the floor, not the list.
Risks & watch-outs
- Climate carrying-cost: major wildfire risk; extreme-heat days projected 7→19/yr by 2055 (HVAC capex compounding) — expect insurance premiums to compound above CPI over the hold.
Questions for the listing agent
- It's been on market 49 days. Have you received any prior offers? Is the seller open to a 3% concession, seller financing, or rate buy-down credit?
- Built in 1965 — when were the roof, HVAC, electrical panel, plumbing, and water heater last replaced?
- Is there a deadline driving the sale (1031 exchange, divorce, estate, relocation)? That informs how much negotiation room exists.
- Schools are F-rated, which usually means shorter tenancies and higher turnover. Who's the typical renter profile here, and what's been the actual vacancy rate?
- Crime grade is F in this area — have there been break-ins, vandalism, or insurance claims at this property in the last 3 years? What carrier currently insures it and at what premium?
- What's the average days-on-market for RENTAL listings here right now (not sales)? A rising rental-DOM trend means longer vacancies and softer asking-rent achievability than the comps imply.
- What's the recent tenant-quality profile in this submarket — average credit score on applications, eviction rate, late-payment / NSF rate, and stable-employment percentage? A property-management company in the area should have these aggregated.
- How much new for-sale + rental construction is in the pipeline within 1–3 miles? Heavy new supply typically softens prices + rents 12–24 months out; constrained supply supports both.
Investment metrics
- 1% rule
- 1.87% ✓
- Cap rate
- 16.34%
- Cash-on-cash
- 35.87%
- DSCR
- 2.60
- GRM
- 4.5
CMA / ARV
No comps found within radius.
Projected returns pro-forma
-3.0% appreciation · 3.0% rent growth · sell at horizon
- IRR
- 31.6%
- Equity multiple
- 2.32×
- Total profit
- $44,519
- Equity at exit
- $17,892
- IRR
- 38.7%
- Equity multiple
- 4.60×
- Total profit
- $121,122
- Equity at exit
- $10,375
Cash invested: $33,600 (down + closing). Projections, not guarantees.
Landlord ↔ Tenant lean methodology
- Overall (STATE)
- 55 Moderately Landlord-Leaning
- State New Mexico
- 55 Moderately Landlord-Leaning · D+3
- County
- — inherits STATE
- City
- — inherits STATE
ZIP-level market 88240
- Active inventory
- 231
- Price-to-rent
- 4.5×
Monthly cashflow live
- Estimated rent
- $2,245 medium interval (Pro) →
- Mortgage (P&I)
- −$629
- Tax from tax record
- −$90 /mo · $1,078/yr
- Insurance
- −$50
- HOA
- −$0
- Vacancy / Maint / Mgmt
- −$471
- Net cashflow
- $1,004
Break-even live
UW: 25.0% down · 7.5% · 30yr · 1.5% tax · 5.0% vac · 8.0% maint · 8.0% mgmt
Financing live
Cash to close
- Down payment
- $30,000
- Closing costs
- $3,600
- Reserves months
- —
- Total cash needed
- —
Loan-product check · same deal, 3 products live
Conventional
25% down · 7.5% · 30yr
- Down + closing
- —
- Monthly P&I
- —
- Monthly cashflow
- —
- DSCR
- —
- Eligible?
- —
Personal DTI + credit; lowest rate.
DSCR
20% down · 8.5% · 30yr
- Down + closing
- —
- Monthly P&I
- —
- Monthly cashflow
- —
- DSCR
- —
- Eligible?
- —
No personal income docs; deal must DSCR.
Hard money
10% down · 12.0% · 12mo
- Down + closing
- —
- Monthly P&I
- —
- Monthly cashflow
- —
- DSCR
- —
- Eligible?
- —
Short-term bridge; refi at stabilization.
Rent comps 2 comps
| Address | Beds | Baths | Sqft | Rent | $/sqft | DOM | Units | Dist |
|---|---|---|---|---|---|---|---|---|
| 211 E Alto Dr Hobbs, NM | 3.0 | 2.0 | 2066 | $2,400 | $1.16 | 43d | 1 | 0.28mi |
| 1107 E La Brea Ave Hobbs, NM | 4.0 | 2.0 | 1900 | $3,200 | $1.68 | 43d | 1 | 1.41mi |
Listing history 8 events
-
2026-03-28status Pending
-
2026-03-17status Active
-
2026-03-17price $120,000
-
2026-02-21status Pending
-
2026-01-14$140,000 Active
-
2022-07-20soldstatus 195-char remark
Show marketing remark (195 chars)
Fixer upper with tons of potential! Just needs the right person willing to give it some TLC. Check out this beautiful 4 bedroom/2 bath, brick home on a corner lot in a nice, quiet neighborhood!
-
2022-05-13$155,000 195-char remark
Show marketing remark (195 chars)
Fixer upper with tons of potential! Just needs the right person willing to give it some TLC. Check out this beautiful 4 bedroom/2 bath, brick home on a corner lot in a nice, quiet neighborhood!
-
1999-06-07soldstatus
ⓘ Source: listings_history table (triggers on properties + properties_extension) + one-shot
backfill from property_details.listing_events for pre-trigger history.
Tax reassessment forecast NM · Resets to sale price
- Current annual tax
- $1,078 · $90/mo
- Projected year-2 tax
- $1,078 · $90/mo
- Expected delta
- $0/yr ($0/mo · 0.0%)
ⓘ Screening estimate from a state-policy table — verify with the county assessor before closing.
Climate risk First Street
- Flood 1/10 Low FEMA zone X (unshaded) · 0% chance over 30 yrs
- Wildfire 7/10 Severe
- Heat 5/10 Major 7 d/yr ≥100°F today · 19 d/yr by 30 yrs out
- Wind 2/10 Low 100% chance of damaging wind over 30 yrs
- Air quality 2/10 Low 1 unhealthy d/yr today · 1 by 30 yrs out
Nearby sold comps map
Loading sold comps map…
Walkable amenities ~0.75 mi
Loading nearby amenities…
Taxation est. · year 1
- Rental income
- $26,939
- − Mortgage interest
- −$6,722
- − Property taxes
- −$1,078
- − Insurance
- −$600
- − Repairs & maintenance
- −$2,155
- − Management
- −$2,155
- − Depreciation
- −$3,491
- Taxable income
- $10,738
- Est. tax owed @ 24.0%
- −$2,577
- After-tax cash flow
- $9,475/yr
For passive investors: Depreciation is non-cash, so a rental often shows a tax loss while cash-flowing — sheltering income. Rental losses are passive: they offset passive income freely, and up to $25,000/yr can offset ordinary (W-2) income if you actively participate and your MAGI is under $100k (phasing out to $0 by $150k); unused losses carry forward. On sale, claimed depreciation is recaptured at up to 25%, and gains may owe capital-gains tax (a 1031 exchange can defer both). Figures are a year-1 estimate at your 24.0% rate — not tax advice; consult a CPA.
Schools (NCES district)
- District
- Hobbs Municipal Schools
- NCES district ID
- 3501260
- Math proficiency
- 17% —
- Reading proficiency
- 31% —
- Median HH income
- $52,575
- Composite
- 24.53/100
- National rank
- #13068
- State rank
- #45 of 95 in NM
Livability — Hobbs
- Score
- 66/100
- State rank
- #37
- US rank
- #11817
Category grades
Schools grade is shown separately in the Schools card above.
Census & demographics
- Census place
- Hobbs, NM
- County
- Lea County · 41,557 people
- City population
- 41,557
- Metro
- Hobbs, NM
- Population (ZIP)
- 41,557
- Household income
- $63,270
- Rent vs Own
- Severe rent burden
- 968.0
Population outlook (Lea County) Hauer SSP2
- Today (2025)
- 84,268 people
- By 2030
- 91,695 · +8.8%
- By 2040
- 108,366 · +28.6%
- By 2050
- 126,264 · +49.8%
- By 2075
- 170,606 · +102.5%
- By 2100
- 199,235 · +136.4%
Race, ethnicity, and origin ACS 2023
- Neighborhood character
- Majority Hispanic (63%)
- Race & ethnicity
- Hispanic / Latino 63% Two or more races 32% White 29% Black 5%
- Hispanic origin (detail)
- Mexican 55%
- Common ancestry
- Italian 2% Lithuanian 1% Slovak 1%
- Foreign-born
- 18% · Canada
- Languages at home
- 57% English-only · Spanish 41% German/W. Germanic 1%
Political lean MEDSL · Lea
- 2024 margin
- Solid R (+61.6) · D 18.5% · R 80.1% · Other 1.3%
- 2008→2024 swing
- -17.4pp toward R · 2008: -44.2pp · 2024: -61.6pp
- All cycles
- 2024: R+61.6 2020: R+59.6 2016: R+48.5 2012: R+49.7 2008: R+44.2
Not yet ingested
- Civics
- —
Market trends
- HPI YoY
- ▼ -246.71%
- Current HPI
- 100.9905
- Rent YoY
- —
- Metro
- Hobbs, NM
- State GDP YoY
- —
- F500 in state
- 0
Price history
-22.6% since first listed8 events — show timeline
- 2026-03-28 Pending — NMMLS
- 2026-03-17 Relisted — NMMLS
- 2026-03-17 Price Changed $120,000 NMMLS
- 2026-02-21 Pending — NMMLS
- 2026-01-14 Listed $140,000 NMMLS
- 2022-07-20 Sold (MLS) — NMMLS
- 2022-05-13 Listed $155,000 NMMLS
- 1999-06-07 Sold (Public Records) — Public Records
Property tax history
+8.2%/yrLatest (2025): $1,078 · -1.2% YoY. Source: county tax records.
Cash-flow waterfall
monthlySold comps — $/sqft
last 12 mo · ≤1 miLoading sold comps…