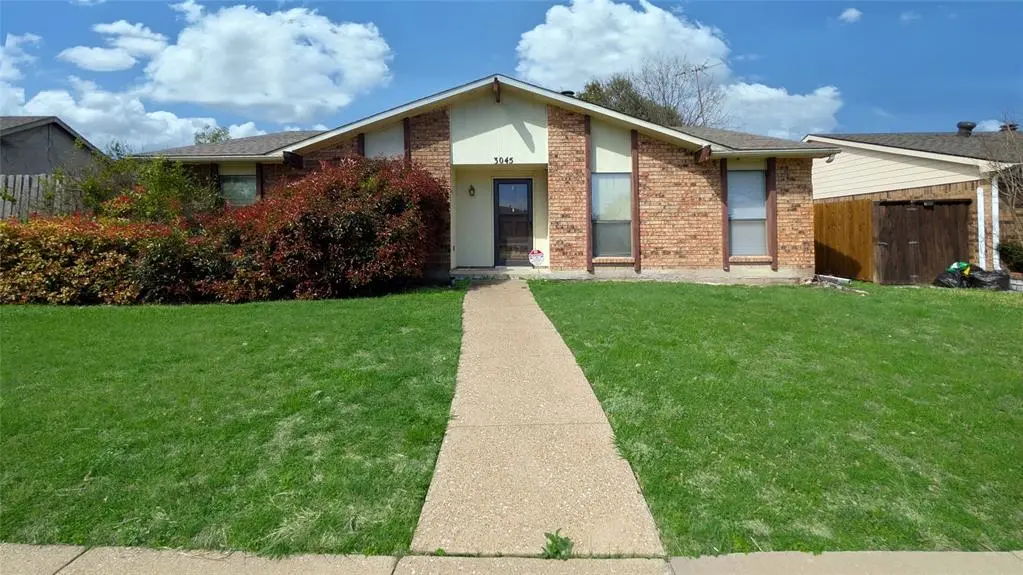
3045 Villa Sur Trl · Dallas, TX
Flood risk 1/10 · Minimal
- FEMA flood zone
- X (unshaded)
- Chance of flooding over 30 yrs
- 0.0%
- Est. flood insurance / yr
- $507 – $1,088
Fire risk 1/10 · Minimal
- Est. fire insurance / yr
- $1,222 – $2,270
Heat risk 7/10 · Major
- Hot days now (above 109°F)
- 7 days/yr
- Hot days in 30 yrs
- 23 days/yr
Wind risk 6/10 · Moderate
- Chance of severe wind over 30 yrs
- 27.0%
Air-quality risk 3/10 · Minor
- Unhealthy air days now
- 3 days/yr
- Unhealthy air days in 30 yrs
- 3 days/yr
Risk factors via First Street. Map © Google.
Why this score? — see what drove the D- grade
The composite is a weighted blend of 9 inputs, each scored 0–100. Each bar is that input's sub-score; the figure is the points it added to the 100-point composite (weight × sub-score).
- ARV discount +15.0/15.0
- Cash flow +8.0/30.0
- 1% rule +4.1/10.0
- Livability +4.0/5.0
- Schools +2.8/10.0
- Condition / age +2.5/5.0
- DSCR +2.1/10.0
- Rent growth +1.3/5.0
- Appreciation +0.0/10.0
$215,000
🖨 Deal sheet 📄 Offer letter ✓ Due diligence
Listing remarks MLS
Calling all Investor, fixer upper. This is a fantastic opportunity to own an investment property. No HOA. this property is in the Casa View neighborhood, minutes from I-635 and Garland Rd, about 10 mins from White Rock Lake. It’s 3 bedrooms, 2baths, foundation walks straight, depending on your scope of work, HVAC is old but working, no leak in roof but may need to be replaced. The property is 1982 built, with 3 bedrooms and 2 full baths. The seller is selling AS IS. No repairs will be made. Cash buyers only. This home will be great to add to your rental portfolio. No survey, buyer will need to pay for one. Contracts with no option period will receive much stronger consideration, required proof of funds. We invite you to conduct your due diligence. no blind offer will be accepted, agent and buyer must walk the property.
Key facts
- No leak in roof
- Minutes from i-635
- 6,273 sq ft lot
Tags
Neighborhood map
What this means for you Summary
Snapshot
- This is a 3-bed/2.0-bath single-family listed at $215k.
Deal economics
- At list price, monthly cash flow is $-218 ($-3k/yr) — negative.
- To cash-flow at today's rent, offer at most $176k (17.9% below list).
- To meet the 1% rule (rent ≥ 1% of price), the offer needs to be $196k (9.0% below list).
- Recommended offer: $176k (17.9% below list) — sets the bar for cash-flow.
- Cap rate 5.1% vs local median 2.3% in Dallas — top-decile yield for the area; either an underpriced asset or a hidden risk that comps aren't pricing in. Stress-test before assuming the spread holds.
Location & tenants
- Location reads 81/100 on livability (#24 in TX, #1,380 nationally) — a professional / high-income tenant draw. Strengths: amenities A+, commute A+, housing A+; Watch: schools C-, crime F.
- Dallas ISD (urban): math 31% / reading 36% proficiency, ranked #559 of 826 in TX (top 68%) — families likely to look elsewhere, expect single-tenant / working-renter base with shorter leases; 83% free/reduced lunch — lower-income household profile, screen leases tightly.
- Market conditions: Rents falling (-4.8%/yr); 306 active listings in the ZIP; 40 comparable units currently listed for rent nearby; rentals at typical pace (median 22d on market — plan ~3-4 weeks tenant-placement turnaround); 12,577 units permitted in Dallas County in 2024 (6,829 in 5+ unit buildings).
- This rent runs 37% of the median local income ($63k/yr) — at the standard rent-burdened threshold; future hikes will face affordability resistance.
Forward outlook
- Local home prices are declining (-3.0%/yr); year-one equity from $1k of loan paydown is wiped out by about $6k of value loss. Plan a longer hold.
- Dallas County population projected at +35% by 2050 — long-run rental-demand tailwind backs the buy-and-hold thesis.
Negotiation context
- It's been on market 54 days — a 3% lower offer ($209k) is reasonable based on typical stale-listing flexibility.
- 2 sale attempts since 7y ago; this cycle's ask has dropped $15k (7%) from the opening price — seller is motivated, your offer sets the floor, not the list.
Risks & watch-outs
- Watch-outs: property tax is 3.1% of price.
- Climate carrying-cost: major wind risk, 27% chance of damaging wind over 30y; extreme-heat days projected 7→23/yr by 2055 (HVAC capex compounding) — expect insurance premiums to compound above CPI over the hold.
Questions for the listing agent
- What do current leases actually rent for vs. the listed asking? Can we see a recent rent roll and the last 12 months of T-12 income?
- It's been on market 54 days. Have you received any prior offers? Is the seller open to a 18% concession, seller financing, or rate buy-down credit?
- Property tax is high relative to price — has the assessment been appealed recently, and will the sale trigger a re-assessment?
- Is there a deadline driving the sale (1031 exchange, divorce, estate, relocation)? That informs how much negotiation room exists.
- Crime grade is F in this area — have there been break-ins, vandalism, or insurance claims at this property in the last 3 years? What carrier currently insures it and at what premium?
- The area grade is low — what's the realistic commute time and amenity access for the typical tenant pool here? Any planned neighborhood developments (good or bad) we should know about?
- What's the average days-on-market for RENTAL listings here right now (not sales)? A rising rental-DOM trend means longer vacancies and softer asking-rent achievability than the comps imply.
- What's the recent tenant-quality profile in this submarket — average credit score on applications, eviction rate, late-payment / NSF rate, and stable-employment percentage? A property-management company in the area should have these aggregated.
- How much new for-sale + rental construction is in the pipeline within 1–3 miles? Heavy new supply typically softens prices + rents 12–24 months out; constrained supply supports both.
Investment metrics
- 1% rule
- 0.91% ✗
- Cap rate
- 5.08%
- Cash-on-cash
- -4.35%
- DSCR
- 0.81
- GRM
- 9.2
CMA / ARV
- ARV (median comp)
- $288,720
- List price
- $215,000
- Delta
- -25.53%
- Verdict
- UNDERPRICED
- Comps
- 20 within 1.0 mi
Show comp detail 12 sales within ~0.75 mi
| Address | Dist | Beds/Ba | Sqft | Sold | Price | $/sf | Match |
|---|---|---|---|---|---|---|---|
| 3045 Villa Sur Trl | 0.00mi | 3/2.0 | 1,674 (0%) | 1mo | $215,000 | $128 | 99 |
| 2938 Weather Vane Ln | 0.08mi | 3/2.0 | 1,674 (0%) | 10mo | $297,900 | $178 | 87 |
| 11638 Featherbrook Dr | 0.37mi | 3/1.0 | 1,674 (0%) | 4mo | $2,000 | $1 | 76 |
| 11501 Cotillion Dr | 0.46mi | 3/2.0 | 1,642 (-2%) | 1mo | $310,000 | $189 | 74 |
| 2816 Barnes Bridge Rd | 0.45mi | 4/2.0 (+1) | 1,676 (+0%) | 2mo | $275,000 | $164 | 72 |
| 11750 Featherbrook Dr | 0.40mi | 3/2.0 | 1,731 (+3%) | 8mo | $339,000 | $196 | 69 |
| 11219 Dumbarton Dr | 0.57mi | 3/1.5 | 1,612 (-4%) | 4mo | $285,000 | $177 | 62 |
| 3331 Ruidosa Ave | 0.50mi | 3/2.0 | 1,759 (+5%) | 11mo | $319,900 | $182 | 59 |
| 11533 Dumbarton Dr | 0.69mi | 3/2.0 | 1,603 (-4%) | 2mo | $249,000 | $155 | 59 |
| 3824 Casa Del Sol Ln | 0.38mi | 3/2.0 | 1,842 (+10%) | 11mo | $349,900 | $190 | 56 |
| 11539 Dumbarton Dr | 0.71mi | 3/2.0 | 1,516 (-9%) | 2mo | $299,900 | $198 | 50 |
| 11011 Visalia Dr | 0.68mi | 4/2.0 (+1) | 1,518 (-9%) | 8mo | $269,000 | $177 | 41 |
Match score weights: distance 35% · size 25% · config 20% · recency 20%. Top-matched comps best support the ARV.
Projected returns pro-forma
-3.0% appreciation · 0.0% rent growth · sell at horizon
- IRR
- -27.7%
- Equity multiple
- 0.10×
- Total profit
- $-54,270
- Equity at exit
- $32,057
- IRR
- -47.5%
- Equity multiple
- -0.44×
- Total profit
- $-86,499
- Equity at exit
- $18,589
Cash invested: $60,200 (down + closing). Projections, not guarantees.
Landlord ↔ Tenant lean methodology
- Overall (STATE)
- 87 Strongly Landlord-Friendly
- State Texas
- 87 Strongly Landlord-Friendly · R+5
- County
- — inherits STATE
- City
- — inherits STATE
ZIP-level market 75228
- Rents YoY
- -4.8%
- Active inventory
- 306
- Price-to-rent
- 9.2×
Monthly cashflow live
- Estimated rent
- $1,957 high interval (Pro) →
- Mortgage (P&I)
- −$1,127
- Tax from tax record
- −$547 /mo · $6,564/yr
- Insurance
- −$90
- HOA
- −$0
- Vacancy / Maint / Mgmt
- −$411
- Net cashflow
- $-218
Break-even live
UW: 25.0% down · 7.5% · 30yr · 1.5% tax · 5.0% vac · 8.0% maint · 8.0% mgmt
Financing live
Cash to close
- Down payment
- $53,750
- Closing costs
- $6,450
- Reserves months
- —
- Total cash needed
- —
Loan-product check · same deal, 3 products live
Conventional
25% down · 7.5% · 30yr
- Down + closing
- —
- Monthly P&I
- —
- Monthly cashflow
- —
- DSCR
- —
- Eligible?
- —
Personal DTI + credit; lowest rate.
DSCR
20% down · 8.5% · 30yr
- Down + closing
- —
- Monthly P&I
- —
- Monthly cashflow
- —
- DSCR
- —
- Eligible?
- —
No personal income docs; deal must DSCR.
Hard money
10% down · 12.0% · 12mo
- Down + closing
- —
- Monthly P&I
- —
- Monthly cashflow
- —
- DSCR
- —
- Eligible?
- —
Short-term bridge; refi at stabilization.
Rent comps 40 comps
| Address | Beds | Baths | Sqft | Rent | $/sqft | DOM | Units | Dist |
|---|---|---|---|---|---|---|---|---|
| 3053 Villa Sur Trl Dallas, TX | 3.0 | 2.0 | 1674 | $2,100 | $1.25 | 24d | 1 | 0.00mi |
| 3014 Tres Logos Ln Dallas, TX | 4.0 | 2.0 | 2151 | $2,300 | $1.07 | 7d | 1 | 0.15mi |
| 3850 Ruidosa Ave Dallas, TX | 3.0 | 2.0 | 1869 | $1,895 | $1.01 | 43d | 1 | 0.27mi |
| 11622 Cotillion Dr Unit 1019514P Dallas, TX | 4.0 | 2.0 | 2142 | $11,341 | $5.29 | 22d | 1 | 0.32mi |
| 11622 Cotillion Dr Dallas, TX | 4.0 | 2.0 | 2151 | $6,950 | $3.23 | 1d | 1 | 0.32mi |
| 3839 Casa del Sol Ln Dallas, TX | 3.0 | 2.0 | 1960 | $2,183 | $1.11 | 24d | 1 | 0.41mi |
| 11501 Cotillion Dr Dallas, TX | 3.0 | 2.0 | 2167 | $2,350 | $1.08 | 7d | 1 | 0.45mi |
| 2811 Tisinger Ave Dallas, TX | 3.0 | 1.0 | 1248 | $1,925 | $1.54 | 7d | 1 | 0.52mi |
| 3134 Truxillo St Dallas, TX | 3.0 | 2.0 | 2208 | $2,500 | $1.13 | 43d | 1 | 0.54mi |
| 11220 Visalia Dr Dallas, TX | 3.0 | 2.0 | 1224 | $1,970 | $1.61 | 43d | 1 | 0.56mi |
| 11211 Ulloa Ln Dallas, TX | 3.0 | 1.0 | 1151 | $1,683 | $1.46 | 12d | 1 | 0.65mi |
| 2402 Housley Dr Dallas, TX | 3.0 | 2.0 | 1679 | $2,420 | $1.44 | 24d | 1 | 0.66mi |
| 2315 Housley Dr Dallas, TX | 4.0 | 2.0 | 1167 | $2,600 | $2.23 | 11d | 1 | 0.67mi |
| 4689 Saturn Rd Garland, TX | 1.0–2.0 | 1.0–2.0 | 965 | $2,139 | $2.22 | 2d | 29 | 0.73mi |
| 10911 Visalia Dr Dallas, TX | 3.0 | 1.0 | 1385 | $1,925 | $1.39 | 43d | 1 | 0.74mi |
| 10850 Shiloh Rd Dallas, TX | 2.0 | 1.5 | 1200 | $1,300 | $1.08 | 24d | 1 | 0.74mi |
| 11211 Stallcup Dr Dallas, TX | 3.0 | 1.0 | 1111 | $1,950 | $1.76 | 43d | 1 | 0.79mi |
| 11321 Woodmeadow Pkwy Dallas, TX | 1.0–3.0 | 1.0–2.0 | 1027 | $1,499 | $1.46 | 3d | 1 | 0.80mi |
| 10858 Cassandra Way Dallas, TX | 3.0 | 1.5 | 1439 | $1,850 | $1.29 | 17d | 1 | 0.82mi |
| 2005 Town Ct Garland, TX | 4.0 | 2.5 | 1757 | $2,050 | $1.17 | 3d | 1 | 0.85mi |
| 2012 Court Pl Garland, TX | 3.0 | 2.5 | 1880 | $1,995 | $1.06 | 17d | 1 | 0.88mi |
| 2031 Towngate Dr Garland, TX | 2.0 | 2.0 | 1464 | $1,690 | $1.15 | 22d | 1 | 1.02mi |
| 10403 Sandra Lynn Dr Dallas, TX | 3.0 | 2.0 | 1610 | $2,195 | $1.36 | 4d | 1 | 1.03mi |
| 11011 Woodmeadow Pkwy Dallas, TX | 1.0–2.0 | 1.0–2.0 | 864 | $1,763 | $2.04 | 2d | 4 | 1.10mi |
| 10830 Cotillion Dr Dallas, TX | 3.0 | 1.5 | 1200 | $1,795 | $1.50 | 24d | 1 | 1.11mi |
| 2518 Winthrop Dr Dallas, TX | 4.0 | 2.0 | 1436 | $2,050 | $1.43 | 24d | 1 | 1.11mi |
| 2518 Winthrop Dr Dallas, TX | 4.0 | 2.0 | 1436 | $2,050 | $1.43 | 20d | 1 | 1.11mi |
| 10943 Desdemona Dr Dallas, TX | 2.0 | 1.0 | 1060 | $1,600 | $1.51 | 19d | 1 | 1.19mi |
| 10732 Cotillion Dr Dallas, TX | 3.0 | 2.0 | 1513 | $1,895 | $1.25 | 43d | 1 | 1.20mi |
| 11524 Strand St Dallas, TX | 3.0 | 1.0 | 1364 | $2,100 | $1.54 | 24d | 1 | 1.23mi |
| 11517 Fernald Ave Dallas, TX | 4.0 | 2.0 | 1426 | $2,146 | $1.50 | 7d | 1 | 1.24mi |
| 11517 Fernald Ave Dallas, TX | 4.0 | 2.0 | 1426 | $2,080 | $1.46 | 6d | 1 | 1.24mi |
| 1817 Hemlock Dr Garland, TX | 3.0 | 2.0 | 1927 | $2,350 | $1.22 | 20d | 1 | 1.24mi |
| 735 Ticonderoga Dr Garland, TX | 2.0 | 1.5 | 1120 | $1,700 | $1.52 | 43d | 1 | 1.25mi |
| 4839 Spindrift Psge Garland, TX | 4.0 | 2.0 | 1546 | $2,400 | $1.55 | 4d | 1 | 1.26mi |
| 1101 Key Colony Dr Garland, TX | 3.0 | 2.0 | 1219 | $2,000 | $1.64 | 43d | 1 | 1.27mi |
| 10922 Castolon Dr Dallas, TX | 3.0 | 1.0 | 1275 | $1,795 | $1.41 | 7d | 1 | 1.28mi |
| 1818 Andover Dr Garland, TX | 3.0 | 2.0 | 1637 | $2,100 | $1.28 | 24d | 1 | 1.31mi |
| 10803 Mandalay Dr Dallas, TX | 3.0 | 2.5 | 1882 | $2,700 | $1.43 | 43d | 1 | 1.35mi |
| 734 Sceptre Cir Garland, TX | 3.0 | 2.0 | 1254 | $2,000 | $1.59 | 43d | 1 | 1.35mi |
Listing history 10 events
-
2026-05-16status Pending 836-char remark
Show marketing remark (836 chars)
Calling all Investor, fixer upper. This is a fantastic opportunity to own an investment property. No HOA. this property is in the Casa View neighborhood, minutes from I-635 and Garland Rd, about 10 mins from White Rock Lake. It’s 3 bedrooms, 2baths, foundation walks straight, depending on your scope of work, HVAC is old but working, no leak in roof but may need to be replaced. The property is 1982 built, with 3 bedrooms and 2 full baths. The seller is selling AS IS. No repairs will be made. Cash buyers only. This home will be great to add to your rental portfolio. No survey, buyer will need to pay for one. Contracts with no option period will receive much stronger consideration, required proof of funds. We invite you to conduct your due diligence. no blind offer will be accepted, agent and buyer must walk the property.
-
2026-04-14price $215,000 836-char remark
Show marketing remark (836 chars)
Calling all Investor, fixer upper. This is a fantastic opportunity to own an investment property. No HOA. this property is in the Casa View neighborhood, minutes from I-635 and Garland Rd, about 10 mins from White Rock Lake. It’s 3 bedrooms, 2baths, foundation walks straight, depending on your scope of work, HVAC is old but working, no leak in roof but may need to be replaced. The property is 1982 built, with 3 bedrooms and 2 full baths. The seller is selling AS IS. No repairs will be made. Cash buyers only. This home will be great to add to your rental portfolio. No survey, buyer will need to pay for one. Contracts with no option period will receive much stronger consideration, required proof of funds. We invite you to conduct your due diligence. no blind offer will be accepted, agent and buyer must walk the property.
-
2026-03-23$230,000 Active 836-char remark
Show marketing remark (836 chars)
Calling all Investor, fixer upper. This is a fantastic opportunity to own an investment property. No HOA. this property is in the Casa View neighborhood, minutes from I-635 and Garland Rd, about 10 mins from White Rock Lake. It’s 3 bedrooms, 2baths, foundation walks straight, depending on your scope of work, HVAC is old but working, no leak in roof but may need to be replaced. The property is 1982 built, with 3 bedrooms and 2 full baths. The seller is selling AS IS. No repairs will be made. Cash buyers only. This home will be great to add to your rental portfolio. No survey, buyer will need to pay for one. Contracts with no option period will receive much stronger consideration, required proof of funds. We invite you to conduct your due diligence. no blind offer will be accepted, agent and buyer must walk the property.
-
2026-02-03soldstatus
-
2019-04-01soldstatus
-
2019-03-29soldstatus Sold 420-char remark
Show marketing remark (420 chars)
NICE 3 BEDROOM, 2 BATH HOME IN CASA VIEW AREA. HOUSE HAS TWO LIVING AREAS, BREAKFAST NOOK AND DINING ROOM. ALSO HAS CENTRAL AIR AND HEAT; WOOD BURNING FIREPLACE; CARPET AND VINYL FLOORING; 2 CAR GARAGE; AND FENCED IN BACKYARD. CONNECTIONS FOR WASHER AND DRYER. KITHCEN APPLIANCES INCLUDE: ELECTRIC STOVE, DISHWASHER, AND DISPOSAL. $35 APPLICATION FEE PER PERSON AND CERTIFIED FUNDS FOR FIRST MONTHS RENT AND DEPOSIT(S).
-
2019-03-19status Pending 420-char remark
Show marketing remark (420 chars)
NICE 3 BEDROOM, 2 BATH HOME IN CASA VIEW AREA. HOUSE HAS TWO LIVING AREAS, BREAKFAST NOOK AND DINING ROOM. ALSO HAS CENTRAL AIR AND HEAT; WOOD BURNING FIREPLACE; CARPET AND VINYL FLOORING; 2 CAR GARAGE; AND FENCED IN BACKYARD. CONNECTIONS FOR WASHER AND DRYER. KITHCEN APPLIANCES INCLUDE: ELECTRIC STOVE, DISHWASHER, AND DISPOSAL. $35 APPLICATION FEE PER PERSON AND CERTIFIED FUNDS FOR FIRST MONTHS RENT AND DEPOSIT(S).
-
2019-03-19$165,000 Active 420-char remark
Show marketing remark (420 chars)
NICE 3 BEDROOM, 2 BATH HOME IN CASA VIEW AREA. HOUSE HAS TWO LIVING AREAS, BREAKFAST NOOK AND DINING ROOM. ALSO HAS CENTRAL AIR AND HEAT; WOOD BURNING FIREPLACE; CARPET AND VINYL FLOORING; 2 CAR GARAGE; AND FENCED IN BACKYARD. CONNECTIONS FOR WASHER AND DRYER. KITHCEN APPLIANCES INCLUDE: ELECTRIC STOVE, DISHWASHER, AND DISPOSAL. $35 APPLICATION FEE PER PERSON AND CERTIFIED FUNDS FOR FIRST MONTHS RENT AND DEPOSIT(S).
-
1993-11-17soldstatus
-
1985-04-02soldstatus
ⓘ Source: listings_history table (triggers on properties + properties_extension) + one-shot
backfill from property_details.listing_events for pre-trigger history.
Tax reassessment forecast TX · Resets to sale price
- Current annual tax
- $6,564 · $547/mo
- Projected year-2 tax
- $6,564 · $547/mo
- Expected delta
- $0/yr ($0/mo · 0.0%)
ⓘ Screening estimate from a state-policy table — verify with the county assessor before closing.
Climate risk First Street
- Flood 1/10 Low FEMA zone X (unshaded) · 0% chance over 30 yrs
- Wildfire 1/10 Low
- Heat 7/10 Severe 7 d/yr ≥109°F today · 23 d/yr by 30 yrs out
- Wind 6/10 Major 27% chance of damaging wind over 30 yrs
- Air quality 3/10 Moderate 3 unhealthy d/yr today · 3 by 30 yrs out
Nearby sold comps map
Loading sold comps map…
Walkable amenities ~0.75 mi
Loading nearby amenities…
Taxation est. · year 1
- Rental income
- $23,481
- − Mortgage interest
- −$12,043
- − Property taxes
- −$6,564
- − Insurance
- −$1,075
- − Repairs & maintenance
- −$1,878
- − Management
- −$1,878
- − Depreciation
- −$6,255
- Taxable loss
- −$6,212
- Est. tax savings @ 24.0%
- +$1,491
- After-tax cash flow
- $-1,127/yr
For passive investors: Depreciation is non-cash, so a rental often shows a tax loss while cash-flowing — sheltering income. Rental losses are passive: they offset passive income freely, and up to $25,000/yr can offset ordinary (W-2) income if you actively participate and your MAGI is under $100k (phasing out to $0 by $150k); unused losses carry forward. On sale, claimed depreciation is recaptured at up to 25%, and gains may owe capital-gains tax (a 1031 exchange can defer both). Figures are a year-1 estimate at your 24.0% rate — not tax advice; consult a CPA.
Schools (NCES district)
- District
- Dallas ISD
- NCES district ID
- 4816230
- Math proficiency
- 31% ▼ -16.00%
- Reading proficiency
- 36% ▼ -4.00%
- Median HH income
- $42,881
- Composite
- 28.41/100
- National rank
- #6763
- State rank
- #559 of 826 in TX
Livability — Dallas
- Score
- 81/100
- State rank
- #24
- US rank
- #1380
Category grades
Schools grade is shown separately in the Schools card above.
Census & demographics
- Census place
- Dallas, TX
- County
- Dallas County · 2,612,404 people
- City population
- 1,168,437
- Metro
- Dallas-Fort Worth-Arlington, TX
- Population (ZIP)
- 67,714
- Household income
- $62,667
- Rent vs Own
- Severe rent burden
- 3281.0
Population outlook (Dallas County) Hauer SSP2
- Today (2025)
- 2,979,839 people
- By 2030
- 3,191,823 · +7.1%
- By 2040
- 3,619,611 · +21.5%
- By 2050
- 4,026,915 · +35.1%
- By 2075
- 4,957,073 · +66.4%
- By 2100
- 5,508,725 · +84.9%
Race, ethnicity, and origin ACS 2023
- Neighborhood character
- Diverse neighborhood (Simpson 0.61)
- Race & ethnicity
- Hispanic / Latino 56% Two or more races 32% White 20% Black 19% Asian 2%
- Hispanic origin (detail)
- Mexican 48%
- Common ancestry
- Slovak 1% Lithuanian 1% Italian 1%
- Foreign-born
- 28% · Canada, China, Vietnam
- Languages at home
- 48% English-only · Spanish 48% Vietnamese 1%
Political lean MEDSL · Dallas
- 2024 margin
- Strong D (+22.2) · D 60.2% · R 38.0% · Other 1.8%
- 2008→2024 swing
- +6.9pp toward D · 2008: 15.3pp · 2024: 22.2pp
- All cycles
- 2024: D+22.2 2020: D+31.6 2016: D+26.2 2012: D+15.4 2008: D+15.3
Not yet ingested
- Civics
- —
Market trends
- HPI YoY
- ▼ -319.11%
- Current HPI
- 354.1624
- Rent YoY
- ▼ -4.85%
- Metro
- Dallas-Fort Worth-Arlington, TX
- State GDP YoY
- ▲ 3.95%
- F500 in state
- 110
Industry mix (Fortune 500 HQ in TX)
| Industry | F500 HQs | Revenue |
|---|---|---|
| Energy | 16 | $1,198B |
|
||
| Technology | 5 | $198B |
|
||
| Engineering / Construction | 4 | $72B |
|
||
| Energy Services | 3 | $60B |
|
||
| Utilities | 3 | $41B |
|
||
| Healthcare | 2 | $330B |
|
||
Price history
+30.3% since first listed10 events — show timeline
- 2026-05-16 Pending — NTREIS
- 2026-04-14 Price Changed $215,000 NTREIS
- 2026-03-23 Listed $230,000 NTREIS
- 2026-02-03 Sold (Public Records) — Public Records
- 2019-04-01 Sold (Public Records) — Public Records
- 2019-03-29 Sold (MLS) — NTREIS
- 2019-03-19 Pending — NTREIS
- 2019-03-19 Listed $165,000 NTREIS
- 1993-11-17 Sold (Public Records) — Public Records
- 1985-04-02 Sold (Public Records) — Public Records
Property tax history
+5.7%/yrLatest (2025): $6,564 · -0.4% YoY. Source: county tax records.
Cash-flow waterfall
monthlySold comps — $/sqft
last 12 mo · ≤1 miLoading sold comps…