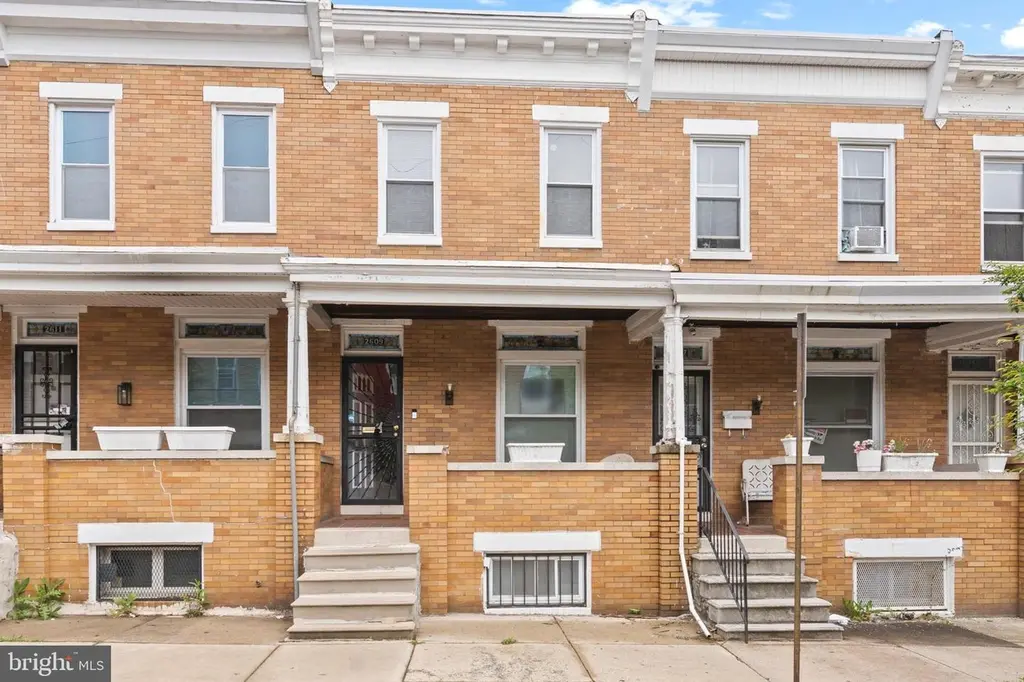
2609 E Hoffman St · Baltimore, MD
Flood risk 1/10 · Minimal
- FEMA flood zone
- X (unshaded)
- Chance of flooding over 30 yrs
- 0.0%
- Est. flood insurance / yr
- $473 – $860
Fire risk 1/10 · Minimal
- Est. fire insurance / yr
- $755 – $1,403
Heat risk 8/10 · Major
- Hot days now (above 103°F)
- 7 days/yr
- Hot days in 30 yrs
- 15 days/yr
Wind risk 6/10 · Moderate
- Chance of severe wind over 30 yrs
- 27.0%
Air-quality risk 4/10 · Minor
- Unhealthy air days now
- 6 days/yr
- Unhealthy air days in 30 yrs
- 7 days/yr
Risk factors via First Street. Map © Google.
Why this score? — see what drove the C grade
The composite is a weighted blend of 9 inputs, each scored 0–100. Each bar is that input's sub-score; the figure is the points it added to the 100-point composite (weight × sub-score).
- Cash flow +21.6/30.0
- ARV discount +7.1/15.0
- DSCR +6.9/10.0
- Appreciation +4.7/10.0
- 1% rule +4.6/10.0
- Rent growth +3.8/5.0
- Livability +3.8/5.0
- Condition / age +2.5/5.0
- Schools +1.0/10.0
$199,995
🖨 Deal sheet 📄 Offer letter ✓ Due diligence
Listing remarks MLS
✨ Fully Renovated Beauty at 2609 E Hoffman St, Baltimore, MD! ✨ Welcome to this stunning top-to-bottom renovated Baltimore rowhome where modern style meets classic charm. Step inside to an open-concept main level featuring new flooring, recessed lighting, and a spacious layout perfect for entertaining. The brand-new kitchen shines with new countertops, stainless steel appliances, soft-close cabinetry, and a stylish backsplash. Upstairs, enjoy three bedrooms and a beautifully tiled full bath with contemporary finishes. The fully finished lower level offers flexible space for a forth bedroom, home office, or family room, plus a second full bathroom—ideal for guests or extra living space. Additional upgrades include new HVAC, plumbing, electric, energy-efficient fixtures throughout—giving you comfort and peace of mind for years to come. Outside, the fenced rear yard is perfect for cookouts, pets, or creating your own urban oasis. Located minutes from Johns Hopkins, Downtown, major highways, and nearby revitalization, this home offers modern living at an incredible value. Move-in ready, beautifully updated, and priced to impress—your new home is waiting!
Key facts
- Fully renovated
- Stylish backsplash
- Soft-close cabinetry
Tags
Neighborhood map
What this means for you Summary
Snapshot
- This is a 3-bed/2.0-bath townhouse listed at $200k.
Deal economics
- At list price, monthly cash flow is $305 ($4k/yr) — positive.
- The deal already cash-flows at list — no discount required.
- To meet the 1% rule (rent ≥ 1% of price), the offer needs to be $192k (3.8% below list).
- Recommended offer: $188k (6.0% below list) — sets the bar for market timing.
- Cap rate 8.1% vs local median 6.0% in Baltimore — top-decile yield for the area; either an underpriced asset or a hidden risk that comps aren't pricing in. Stress-test before assuming the spread holds.
Location & tenants
- Location reads 76/100 on livability (#90 in MD, #3,396 nationally) — a middle-class / working-renter tenant base. Strengths: amenities A+, commute A+, housing A+; Watch: schools D, crime F.
- Baltimore City Public Schools (urban): math 7% / reading 16% proficiency, ranked #24 of 24 in MD (top 100%) — low school quality limits family demand, transient renter base, plan for 1-2y turnover; 79% free/reduced lunch — lower-income household profile, screen leases tightly.
- Market conditions: Rents rising fast (+5.2%/yr); 319 active listings in the ZIP; 8 comparable units currently listed for rent nearby; rentals at typical pace (median 24d on market — plan ~3-4 weeks tenant-placement turnaround); 1,273 units permitted in Baltimore city in 2024 (1,104 in 5+ unit buildings).
- This rent runs 45% of the median local income ($51k/yr) — at the standard rent-burdened threshold; future hikes will face affordability resistance.
Forward outlook
- In year one you build about $246 of equity ($1k loan paydown + $-1k appreciation (-0.6% local appreciation)).
- Baltimore County population projected to shrink 4% by 2050 — rents likely to lag national; underwrite the cash flow, not the appreciation.
- At projected returns (-0.6% appreciation + 5.2% rent growth), your $56k cash investment doubles in ~8 years — after that, you're playing with house money.
Negotiation context
- It's been on market 72 days — a 6% lower offer ($188k) is reasonable based on typical stale-listing flexibility.
Risks & watch-outs
- Watch-outs: built in 1939 — expect roof / HVAC / electrical / plumbing capex.
- Climate carrying-cost: major wind risk, 27% chance of damaging wind over 30y; extreme-heat days projected 7→15/yr by 2055 (HVAC capex compounding) — expect insurance premiums to compound above CPI over the hold.
Questions for the listing agent
- It's been on market 72 days. Have you received any prior offers? Is the seller open to a 6% concession, seller financing, or rate buy-down credit?
- Built in 1939 — when were the roof, HVAC, electrical panel, plumbing, and water heater last replaced?
- Why hasn't it sold? Are there any deal-killer items the seller is aware of (foundation, flood, title, zoning, code violations)?
- Is there a deadline driving the sale (1031 exchange, divorce, estate, relocation)? That informs how much negotiation room exists.
- Schools are D-rated, which usually means shorter tenancies and higher turnover. Who's the typical renter profile here, and what's been the actual vacancy rate?
- Crime grade is F in this area — have there been break-ins, vandalism, or insurance claims at this property in the last 3 years? What carrier currently insures it and at what premium?
- What's the average days-on-market for RENTAL listings here right now (not sales)? A rising rental-DOM trend means longer vacancies and softer asking-rent achievability than the comps imply.
- What's the recent tenant-quality profile in this submarket — average credit score on applications, eviction rate, late-payment / NSF rate, and stable-employment percentage? A property-management company in the area should have these aggregated.
- How much new for-sale + rental construction is in the pipeline within 1–3 miles? Heavy new supply typically softens prices + rents 12–24 months out; constrained supply supports both.
Investment metrics
- 1% rule
- 0.96% ✗
- Cap rate
- 8.12%
- Cash-on-cash
- 6.54%
- DSCR
- 1.29
- GRM
- 8.7
CMA / ARV
- ARV (median comp)
- $198,206
- List price
- $199,995
- Delta
- 0.90%
- Verdict
- FAIR
- Comps
- 20 within 1.0 mi
Show comp detail 4 sales within ~0.75 mi
| Address | Dist | Beds/Ba | Sqft | Sold | Price | $/sf | Match |
|---|---|---|---|---|---|---|---|
| 2709 E Hoffman St | 0.06mi | 2/1.0 (-1) | 840 (+13%) | 1mo | $115,000 | $137 | 66 |
| 2604 Mura St | 0.09mi | 3/2.0 | 852 (+14%) | 14mo | $125,000 | $147 | 60 |
| 1614 N Port St | 0.25mi | 3/1.0 | 800 (+8%) | 20mo | $25,000 | $31 | 55 |
| 506 N Patterson Park Ave | 0.73mi | 3/1.5 | 640 (-14%) | 8mo | $78,000 | $122 | 34 |
Match score weights: distance 35% · size 25% · config 20% · recency 20%. Top-matched comps best support the ARV.
Projected returns pro-forma
-0.57% appreciation · 5.25% rent growth · sell at horizon
- IRR
- 4.9%
- Equity multiple
- 1.23×
- Total profit
- $12,674
- Equity at exit
- $52,457
- IRR
- 12.3%
- Equity multiple
- 2.34×
- Total profit
- $75,303
- Equity at exit
- $58,732
Cash invested: $55,999 (down + closing). Projections, not guarantees.
Landlord ↔ Tenant lean methodology
- Overall (CITY)
- 12 Strongly Tenant-Friendly
- State Maryland
- 27 Tenant-Leaning · D+14
- County
- — inherits STATE
- City Baltimore
- 12 Strongly Tenant-Friendly · D+58
ZIP-level market 21213
- Home prices YoY
- -0.1%
- Rents YoY
- 5.2%
- Active inventory
- 319
- Price-to-rent
- 8.7×
Monthly cashflow live
- Estimated rent
- $1,923 high interval (Pro) →
- Mortgage (P&I)
- −$1,049
- Tax from tax record
- −$82 /mo · $986/yr
- Insurance
- −$83
- HOA
- −$0
- Vacancy / Maint / Mgmt
- −$404
- Net cashflow
- $305
Break-even live
UW: 25.0% down · 7.5% · 30yr · 1.5% tax · 5.0% vac · 8.0% maint · 8.0% mgmt
Financing live
Cash to close
- Down payment
- $49,999
- Closing costs
- $6,000
- Reserves months
- —
- Total cash needed
- —
Loan-product check · same deal, 3 products live
Conventional
25% down · 7.5% · 30yr
- Down + closing
- —
- Monthly P&I
- —
- Monthly cashflow
- —
- DSCR
- —
- Eligible?
- —
Personal DTI + credit; lowest rate.
DSCR
20% down · 8.5% · 30yr
- Down + closing
- —
- Monthly P&I
- —
- Monthly cashflow
- —
- DSCR
- —
- Eligible?
- —
No personal income docs; deal must DSCR.
Hard money
10% down · 12.0% · 12mo
- Down + closing
- —
- Monthly P&I
- —
- Monthly cashflow
- —
- DSCR
- —
- Eligible?
- —
Short-term bridge; refi at stabilization.
Rent comps 8 comps
| Address | Beds | Baths | Sqft | Rent | $/sqft | DOM | Units | Dist |
|---|---|---|---|---|---|---|---|---|
| 2410 E Federal St Baltimore, MD | 4.0 | 2.0 | 720 | $2,200 | $3.06 | 24d | 1 | 0.21mi |
| 2221 E Preston St Baltimore, MD | 2.0 | 1.0 | 658 | $1,200 | $1.82 | 24d | 1 | 0.31mi |
| 500 N Rose St Baltimore, MD | 3.0 | 2.0 | 520 | $1,200 | $2.31 | 4d | 1 | 0.69mi |
| 1607 Hakesley Pl Baltimore, MD | 3.0 | 1.0 | 720 | $1,400 | $1.94 | 44d | 1 | 0.82mi |
| 4300 Orchard Ridge Blvd Baltimore, MD | 1.0–3.0 | 1.0–2.0 | 1021 | $1,809 | $1.77 | 44d | 1 | 1.22mi |
| 520 Somerset St Baltimore, MD | 1.0–2.0 | 1.0–2.0 | 634 | $1,578 | $2.49 | 44d | 1 | 1.30mi |
| 305 S Collington Ave Baltimore, MD | 3.0 | 2.5 | 722 | $2,895 | $4.01 | 17d | 1 | 1.37mi |
| 1100 Greenmount Ave Baltimore, MD | 1.0–3.0 | 1.0–2.0 | 839 | $2,584 | $3.08 | 2d | 1 | 1.48mi |
Listing history 14 events
-
2026-06-18days on market $199,995 Active 72 DOM
-
2026-06-17days on market $199,995 Active 71 DOM
-
2026-06-16days on market $199,995 Active 70 DOM
-
2026-06-15days on market $199,995 Active 69 DOM
-
2026-06-13days on market $199,995 Active 67 DOM
-
2026-06-09days on market $199,995 Active 63 DOM
-
2026-06-08days on market $199,995 Active 62 DOM
-
2026-06-07days on market $199,995 Active 61 DOM
-
2026-06-04days on market $199,995 Active 58 DOM
-
2026-06-03days on market $199,995 Active 57 DOM
-
2026-06-02days on market $199,995 Active 56 DOM
-
2026-06-01days on market $199,995 Active 55 DOM
-
2026-05-31days on market $199,995 Active 54 DOM
-
2026-04-07$199,995 Active 1187-char remark
Show marketing remark (1187 chars)
✨ Fully Renovated Beauty at 2609 E Hoffman St, Baltimore, MD! ✨ Welcome to this stunning top-to-bottom renovated Baltimore rowhome where modern style meets classic charm. Step inside to an open-concept main level featuring new flooring, recessed lighting, and a spacious layout perfect for entertaining. The brand-new kitchen shines with new countertops, stainless steel appliances, soft-close cabinetry, and a stylish backsplash. Upstairs, enjoy three bedrooms and a beautifully tiled full bath with contemporary finishes. The fully finished lower level offers flexible space for a forth bedroom, home office, or family room, plus a second full bathroom—ideal for guests or extra living space. Additional upgrades include new HVAC, plumbing, electric, energy-efficient fixtures throughout—giving you comfort and peace of mind for years to come. Outside, the fenced rear yard is perfect for cookouts, pets, or creating your own urban oasis. Located minutes from Johns Hopkins, Downtown, major highways, and nearby revitalization, this home offers modern living at an incredible value. Move-in ready, beautifully updated, and priced to impress—your new home is waiting!
ⓘ Source: listings_history table (triggers on properties + properties_extension) + one-shot
backfill from property_details.listing_events for pre-trigger history.
Tax reassessment forecast MD · Partial reset (capped growth)
- Current annual tax
- $986 · $82/mo
- Projected year-2 tax
- $1,583 · $132/mo
- Expected delta
- +$597/yr (+$50/mo · 60.5%)
ⓘ Screening estimate from a state-policy table — verify with the county assessor before closing.
Climate risk First Street
- Flood 1/10 Low FEMA zone X (unshaded) · 0% chance over 30 yrs
- Wildfire 1/10 Low
- Heat 8/10 Severe 7 d/yr ≥103°F today · 15 d/yr by 30 yrs out
- Wind 6/10 Major 27% chance of damaging wind over 30 yrs
- Air quality 4/10 Moderate 6 unhealthy d/yr today · 7 by 30 yrs out
Nearby sold comps map
Loading sold comps map…
Walkable amenities ~0.75 mi
Loading nearby amenities…
Taxation est. · year 1
- Rental income
- $23,079
- − Mortgage interest
- −$11,203
- − Property taxes
- −$986
- − Insurance
- −$1,000
- − Repairs & maintenance
- −$1,846
- − Management
- −$1,846
- − Depreciation
- −$5,818
- Taxable income
- $379
- Est. tax owed @ 24.0%
- −$91
- After-tax cash flow
- $3,569/yr
For passive investors: Depreciation is non-cash, so a rental often shows a tax loss while cash-flowing — sheltering income. Rental losses are passive: they offset passive income freely, and up to $25,000/yr can offset ordinary (W-2) income if you actively participate and your MAGI is under $100k (phasing out to $0 by $150k); unused losses carry forward. On sale, claimed depreciation is recaptured at up to 25%, and gains may owe capital-gains tax (a 1031 exchange can defer both). Figures are a year-1 estimate at your 24.0% rate — not tax advice; consult a CPA.
Schools (NCES district)
- District
- Baltimore City Public Schools
- NCES district ID
- 2400090
- Math proficiency
- 7% ▼ -9.00%
- Reading proficiency
- 16% ▼ -5.00%
- Median HH income
- $42,108
- Composite
- 10.08/100
- National rank
- #9805
- State rank
- #24 of 24 in MD
Livability — Baltimore
- Score
- 76/100
- State rank
- #90
- US rank
- #3396
Category grades
Schools grade is shown separately in the Schools card above.
Census & demographics
- Census place
- Baltimore, MD
- County
- Baltimore City · 558,601 people
- City population
- 588,727
- Metro
- Baltimore-Columbia-Towson, MD
- Population (ZIP)
- 28,058
- Household income
- $51,344
- Rent vs Own
- Severe rent burden
- 1868.0
Population outlook (Baltimore County) Hauer SSP2
- Today (2025)
- 624,249 people
- By 2030
- 621,541 · -0.4%
- By 2040
- 609,756 · -2.3%
- By 2050
- 597,249 · -4.3%
- By 2075
- 552,236 · -11.5%
- By 2100
- 513,934 · -17.7%
Race, ethnicity, and origin ACS 2023
- Neighborhood character
- Predominantly Black (86%)
- Race & ethnicity
- Black 86% White 6% Hispanic / Latino 4% Two or more races 3%
- Foreign-born
- 3% · Canada
- Languages at home
- 96% English-only · Spanish 3%
Political lean MEDSL · Baltimore
- 2024 margin
- Solid D (+73.0) · D 85.2% · R 12.2% · Other 2.6%
- 2008→2024 swing
- -2.5pp toward R · 2008: 75.5pp · 2024: 73.0pp
- All cycles
- 2024: D+73.0 2020: D+76.6 2016: D+74.6 2012: D+76.4 2008: D+75.5
Not yet ingested
- Civics
- —
Market trends
- HPI YoY
- ▼ -0.57%
- Current HPI
- 427.4453
- Rent YoY
- ▲ 5.25%
- Metro
- Baltimore-Columbia-Towson, MD
- State GDP YoY
- ▲ 2.97%
- F500 in state
- 12
Industry mix (Fortune 500 HQ in MD)
| Industry | F500 HQs | Revenue |
|---|---|---|
| Aerospace / Defense | 1 | $71B |
|
||
| Utilities | 1 | $25B |
|
||
| Hotels | 1 | $24B |
|
||
| Consumer Goods | 1 | $7B |
|
||
| Real Estate | 1 | $6B |
|
||
| Chemicals | 1 | $2B |
|
||
Price history
1 event — show timeline
- 2026-04-07 Listed $199,995 BRIGHT MLS
Property tax history
+4.9%/yrLatest (2025): $986 · +9.6% YoY. Source: county tax records.
Cash-flow waterfall
monthlySold comps — $/sqft
last 12 mo · ≤1 miLoading sold comps…