765 Fulton · San Antonio, TX
Flood risk 1/10 · Minimal
- FEMA flood zone
- X (unshaded)
- Chance of flooding over 30 yrs
- 0.0%
- Est. flood insurance / yr
- $507 – $1,088
Fire risk 1/10 · Minimal
- Est. fire insurance / yr
- $1,222 – $2,270
Heat risk 8/10 · Major
- Hot days now (above 108°F)
- 7 days/yr
- Hot days in 30 yrs
- 22 days/yr
Wind risk 6/10 · Moderate
- Chance of severe wind over 30 yrs
- 77.0%
Air-quality risk 2/10 · Minimal
- Unhealthy air days now
- 1 days/yr
- Unhealthy air days in 30 yrs
- 1 days/yr
Risk factors via First Street. Map © Google.
Why this score? — see what drove the D grade
The composite is a weighted blend of 9 inputs, each scored 0–100. Each bar is that input's sub-score; the figure is the points it added to the 100-point composite (weight × sub-score).
- ARV discount +15.0/15.0
- Cash flow +10.8/30.0
- 1% rule +4.0/10.0
- Livability +4.0/5.0
- DSCR +3.1/10.0
- Rent growth +2.7/5.0
- Condition / age +2.5/5.0
- Schools +1.4/10.0
- Appreciation +0.0/10.0
$355,000
🖨 Deal sheet (PDF) 📄 Offer letter ✓ Due diligence
Listing remarks MLS
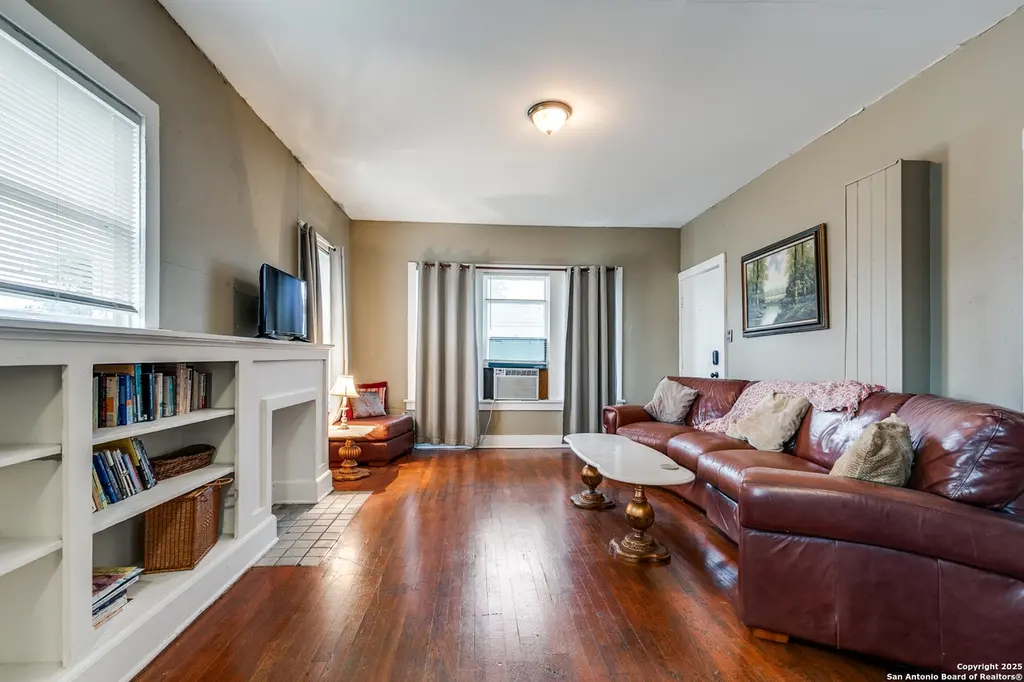
Welcome to 765 Fulton Avenue, a smart investment opportunity nestled in the heart of the sought-after Beacon Hill neighborhood in San Antonio, TX. This property offers an exceptional chance to own a four-plex that promises significant cash flow potential. Located just moments away from downtown, this property boasts unparalleled access to the vibrant city life while retaining the charm of a residential community. Its prime location is further enhanced by the convenience of nearby public transportation options, ensuring effortless connectivity for tenants seeking the perfect balance between urban amenities and a serene home environment. Each unit is designed to maximize comfort and functionality, making it a desirable choice for potential renters. Whether you're an investor looking to expand your portfolio or a homeowner interested in generating rental income, 765 Fulton Avenue presents an ideal opportunity. The property's proximity to key attractions and its accessibility make it a solid investment in a thriving community. Don't miss your chance to capitalize on this unique offering in Beacon Hill.
Key facts
- Four-plex
- 6,141 sq ft lot
- 4 parking spots
Tags
Neighborhood map
What this means for you Summary
Snapshot
- This is a 4-bed/4.0-bath single-family listed at $355k.
Deal economics
- At list price, monthly cash flow is $-163 ($-2k/yr) — negative.
- To cash-flow at today's rent, offer at most $326k (8.1% below list).
- To meet the 1% rule (rent ≥ 1% of price), the offer needs to be $320k (10.0% below list).
- Recommended offer: $312k (12.0% below list) — sets the bar for market timing.
- Cap rate 5.7% vs local median 3.8% in San Antonio — top-decile yield for the area; either an underpriced asset or a hidden risk that comps aren't pricing in. Stress-test before assuming the spread holds.
Location & tenants
- Location reads 80/100 on livability (#31 in TX, #1,616 nationally) — a professional / high-income tenant draw. Strengths: amenities A+, commute A+, cost of living A+; Watch: crime F.
- San Antonio ISD (urban): math 12% / reading 22% proficiency, ranked #805 of 826 in TX (top 98%) — low school quality limits family demand, transient renter base, plan for 1-2y turnover; 80% free/reduced lunch — lower-income household profile, screen leases tightly.
- Zoned schools: Agnes Cotton Academy (math 32% / reading 32%, grade F, #2,268 of 4,322 statewide, top 55%, 482 students, 90% FRL, charter); Edison H S (math 14% / reading 24%, grade F, #1,431 of 1,632 statewide, top 88%, 1,329 students, 90% FRL).
- Market conditions: Rents flat; 185 active listings in the ZIP; 6 comparable units currently listed for rent nearby; rentals at typical pace (median 14d on market — plan ~3-4 weeks tenant-placement turnaround); 8,308 units permitted in Bexar County in 2024 (2,506 in 5+ unit buildings).
- At $3,196/mo this rent would consume 61% of the median local household income ($63k/yr) (locally 1505% of renters already pay >50% of income on rent) — very limited rent-growth headroom before tenants either downsize or default.
Forward outlook
- Local home prices are declining (-3.0%/yr); year-one equity from $2k of loan paydown is wiped out by about $11k of value loss. Plan a longer hold.
- Bexar County population projected at +50% by 2050 — long-run rental-demand tailwind backs the buy-and-hold thesis.
Negotiation context
- It's been on market 407 days — a 12% lower offer ($312k) is reasonable based on typical stale-listing flexibility.
- 3 sale attempts since 19y ago; this cycle's ask has dropped $70k (16%) from the opening price — seller is motivated, your offer sets the floor, not the list.
Risks & watch-outs
- Watch-outs: built in 1916 — expect roof / HVAC / electrical / plumbing capex.
- Climate carrying-cost: major wind risk, 77% chance of damaging wind over 30y; extreme-heat days projected 7→22/yr by 2055 (HVAC capex compounding) — expect insurance premiums to compound above CPI over the hold.
Questions for the listing agent
- What do current leases actually rent for vs. the listed asking? Can we see a recent rent roll and the last 12 months of T-12 income?
- It's been on market 407 days. Have you received any prior offers? Is the seller open to a 12% concession, seller financing, or rate buy-down credit?
- Built in 1916 — when were the roof, HVAC, electrical panel, plumbing, and water heater last replaced?
- Why hasn't it sold? Are there any deal-killer items the seller is aware of (foundation, flood, title, zoning, code violations)?
- Is there a deadline driving the sale (1031 exchange, divorce, estate, relocation)? That informs how much negotiation room exists.
- Crime grade is F in this area — have there been break-ins, vandalism, or insurance claims at this property in the last 3 years? What carrier currently insures it and at what premium?
- The area grade is low — what's the realistic commute time and amenity access for the typical tenant pool here? Any planned neighborhood developments (good or bad) we should know about?
- What's the average days-on-market for RENTAL listings here right now (not sales)? A rising rental-DOM trend means longer vacancies and softer asking-rent achievability than the comps imply.
- What's the recent tenant-quality profile in this submarket — average credit score on applications, eviction rate, late-payment / NSF rate, and stable-employment percentage? A property-management company in the area should have these aggregated.
- How much new for-sale + rental construction is in the pipeline within 1–3 miles? Heavy new supply typically softens prices + rents 12–24 months out; constrained supply supports both.
Investment metrics
- 1% rule
- 0.90% ✗
- Cap rate
- 5.74%
- Cash-on-cash
- -1.97%
- DSCR
- 0.91
- GRM
- 9.3
CMA / ARV
- ARV (median comp)
- $439,782
- List price
- $355,000
- Delta
- -19.28%
- Verdict
- UNDERPRICED
- Comps
- 20 within 1.0 mi
Show comp detail 12 sales within ~0.75 mi
| Address | Dist | Beds/Ba | Sqft | Sold | Price | $/sf | Match |
|---|---|---|---|---|---|---|---|
| 303 W Rosewood | 0.54mi | 4/4.5 | 3,000 (-3%) | 1mo | $1,050,000 | $350 | 67 |
| 514 W Lynwood Ave | 0.26mi | 4/2.0 | 2,970 (-4%) | 11mo | $585,000 | $197 | 65 |
| 436 W Gramercy Pl | 0.31mi | 5/2.0 (+1) | 3,168 (+3%) | 4mo | $575,000 | $182 | 65 |
| 339 W Elsmere Pl | 0.40mi | 4/4.0 | 3,500 (+14%) | 2mo | $975,000 | $279 | 57 |
| 241 W Elsmere | 0.52mi | 3/2.0 (-1) | 3,066 (-0%) | 10mo | $1,195,000 | $390 | 54 |
| 319 W Hollywood Ave | 0.49mi | 4/2.5 | 3,325 (+8%) | 16mo | $995,000 | $299 | 45 |
| 220 W Mulberry | 0.66mi | 4/2.5 | 2,916 (-5%) | 14mo | $895,000 | $307 | 43 |
| 343 W Hollywood Ave | 0.44mi | 3/2.5 (-1) | 2,847 (-8%) | 16mo | $1,199,000 | $421 | 42 |
| 225 W Summit | 0.58mi | 3/3.0 (-1) | 3,378 (+10%) | 9mo | $675,000 | $200 | 40 |
| 415 W Magnolia Ave | 0.58mi | 3/2.5 (-1) | 2,916 (-5%) | 15mo | $849,000 | $291 | 40 |
| 322 W Mistletoe Ave | 0.71mi | 4/3.0 | 2,800 (-9%) | 11mo | $699,000 | $250 | 38 |
| 1024 W Mistletoe | 0.65mi | 4/3.0 | 2,754 (-11%) | 12mo | $410,000 | $149 | 38 |
Match score weights: distance 35% · size 25% · config 20% · recency 20%. Top-matched comps best support the ARV.
Projected returns pro-forma
-3.0% appreciation · 0.89% rent growth · sell at horizon
- IRR
- -22.1%
- Equity multiple
- 0.25×
- Total profit
- $-74,383
- Equity at exit
- $52,932
- IRR
- -23.0%
- Equity multiple
- -0.04×
- Total profit
- $-103,528
- Equity at exit
- $30,694
Cash invested: $99,400 (down + closing). Projections, not guarantees.
Landlord ↔ Tenant lean methodology
- Overall (STATE)
- 87 Strongly Landlord-Friendly
- State Texas
- 87 Strongly Landlord-Friendly · R+5
- County
- — inherits STATE
- City
- — inherits STATE
ZIP-level market 78212
- Home prices YoY
- -25.2%
- Rents YoY
- 0.9%
- Active inventory
- 185
- Price-to-rent
- 9.3×
Monthly cashflow live
- Estimated rent
- $3,196 high interval (Pro) →
- Mortgage (P&I)
- −$1,862
- Tax from tax record
- −$679 /mo · $8,148/yr
- Insurance
- −$148
- HOA
- −$0
- Vacancy / Maint / Mgmt
- −$671
- Net cashflow
- $-163
Break-even live
Sensitivity live
| Price | -10% $38 | -5% $-63 | +0% $-163 | +5% $-264 | +10% $-364 |
|---|---|---|---|---|---|
| Rent | -10% $-416 | -5% $-290 | +0% $-163 | +5% $-37 | +10% $89 |
| Rate | -1.0pp $15 | -0.5pp $-73 | base $-163 | +0.5pp $-255 | +1.0pp $-349 |
UW: 25.0% down · 7.5% · 30yr · 1.5% tax · 5.0% vac · 8.0% maint · 8.0% mgmt
Financing live
Cash to close
- Down payment
- $88,750
- Closing costs
- $10,650
- Reserves months
- —
- Total cash needed
- —
Loan-product check · same deal, 3 products live
Conventional
25% down · 7.5% · 30yr
- Down + closing
- —
- Monthly P&I
- —
- Monthly cashflow
- —
- DSCR
- —
- Eligible?
- —
Personal DTI + credit; lowest rate.
DSCR
20% down · 8.5% · 30yr
- Down + closing
- —
- Monthly P&I
- —
- Monthly cashflow
- —
- DSCR
- —
- Eligible?
- —
No personal income docs; deal must DSCR.
Hard money
10% down · 12.0% · 12mo
- Down + closing
- —
- Monthly P&I
- —
- Monthly cashflow
- —
- DSCR
- —
- Eligible?
- —
Short-term bridge; refi at stabilization.
Rent comps 6 comps
| Address | Beds | Baths | Sqft | Rent | $/sqft | DOM | Units | Dist |
|---|---|---|---|---|---|---|---|---|
| 801 W Mulberry Ave San Antonio, TX | 3.0 | 3.0 | 2206 | $2,800 | $1.27 | 5d | 1 | 0.37mi |
| 418 W Rosewood Ave San Antonio, TX | 3.0 | 2.0 | 2100 | $2,499 | $1.19 | 26d | 1 | 0.39mi |
| 800 W Russell Pl San Antonio, TX | 4.0 | 4.0 | 2200 | $3,500 | $1.59 | 26d | 1 | 0.79mi |
| 128 E Summit Ave San Antonio, TX | 5.0 | 4.0 | 4328 | $5,628 | $1.30 | 0d | 1 | 0.84mi |
| 202 W Woodlawn Ave San Antonio, TX | 3.0 | 3.5 | 2574 | $3,550 | $1.38 | 6d | 1 | 0.89mi |
| 417 E Hildebrand Ave San Antonio, TX | 5.0 | 3.0 | 3590 | $6,500 | $1.81 | 14d | 1 | 1.26mi |
Listing history 28 events
-
2026-06-21days on market $355,000 Active 407 DOM
-
2026-06-18days on market $355,000 Active 404 DOM
-
2026-06-17statusdays on market $355,000 Active 403 DOM
-
2026-06-16days on market $355,000 Price Change 402 DOM
-
2026-06-15days on market $355,000 Price Change 401 DOM
-
2026-06-13days on market $355,000 Price Change 399 DOM
-
2026-06-09days on market $355,000 Price Change 395 DOM
-
2026-06-08days on market $355,000 Price Change 394 DOM
-
2026-06-07pricestatusdays on market $355,000 Price Change 393 DOM
-
2026-06-04days on market $370,000 Active 390 DOM
-
2026-06-03days on market $370,000 Active 389 DOM
-
2026-06-02days on market $370,000 Active 388 DOM
-
2026-06-01days on market $370,000 Active 387 DOM
-
2026-05-31days on market $370,000 Active 386 DOM
-
2026-05-02price $370,000 1118-char remark
Show marketing remark (1118 chars)
Welcome to 765 Fulton Avenue, a smart investment opportunity nestled in the heart of the sought-after Beacon Hill neighborhood in San Antonio, TX. This property offers an exceptional chance to own a four-plex that promises significant cash flow potential. Located just moments away from downtown, this property boasts unparalleled access to the vibrant city life while retaining the charm of a residential community. Its prime location is further enhanced by the convenience of nearby public transportation options, ensuring effortless connectivity for tenants seeking the perfect balance between urban amenities and a serene home environment. Each unit is designed to maximize comfort and functionality, making it a desirable choice for potential renters. Whether you're an investor looking to expand your portfolio or a homeowner interested in generating rental income, 765 Fulton Avenue presents an ideal opportunity. The property's proximity to key attractions and its accessibility make it a solid investment in a thriving community. Don't miss your chance to capitalize on this unique offering in Beacon Hill.
-
2026-02-26price $395,000 1118-char remark
Show marketing remark (1118 chars)
Welcome to 765 Fulton Avenue, a smart investment opportunity nestled in the heart of the sought-after Beacon Hill neighborhood in San Antonio, TX. This property offers an exceptional chance to own a four-plex that promises significant cash flow potential. Located just moments away from downtown, this property boasts unparalleled access to the vibrant city life while retaining the charm of a residential community. Its prime location is further enhanced by the convenience of nearby public transportation options, ensuring effortless connectivity for tenants seeking the perfect balance between urban amenities and a serene home environment. Each unit is designed to maximize comfort and functionality, making it a desirable choice for potential renters. Whether you're an investor looking to expand your portfolio or a homeowner interested in generating rental income, 765 Fulton Avenue presents an ideal opportunity. The property's proximity to key attractions and its accessibility make it a solid investment in a thriving community. Don't miss your chance to capitalize on this unique offering in Beacon Hill.
-
2025-05-10$425,000 New 1118-char remark
Show marketing remark (1118 chars)
Welcome to 765 Fulton Avenue, a smart investment opportunity nestled in the heart of the sought-after Beacon Hill neighborhood in San Antonio, TX. This property offers an exceptional chance to own a four-plex that promises significant cash flow potential. Located just moments away from downtown, this property boasts unparalleled access to the vibrant city life while retaining the charm of a residential community. Its prime location is further enhanced by the convenience of nearby public transportation options, ensuring effortless connectivity for tenants seeking the perfect balance between urban amenities and a serene home environment. Each unit is designed to maximize comfort and functionality, making it a desirable choice for potential renters. Whether you're an investor looking to expand your portfolio or a homeowner interested in generating rental income, 765 Fulton Avenue presents an ideal opportunity. The property's proximity to key attractions and its accessibility make it a solid investment in a thriving community. Don't miss your chance to capitalize on this unique offering in Beacon Hill.
-
2023-11-13soldstatus
-
2023-11-09soldstatus Sold 231-char remark
Show marketing remark (231 chars)
Centrally located Beacon Hill 4 Plex close to downtown. Corner lot and close to shopping centers and bus line. Stove and refrigerator in each unit. Wood floors and ceiling fans throughout. ......Please Do Not Disturb Tenants.......
-
2023-10-25status Pending 231-char remark
Show marketing remark (231 chars)
Centrally located Beacon Hill 4 Plex close to downtown. Corner lot and close to shopping centers and bus line. Stove and refrigerator in each unit. Wood floors and ceiling fans throughout. ......Please Do Not Disturb Tenants.......
-
2023-10-11historical Active Option 231-char remark
Show marketing remark (231 chars)
Centrally located Beacon Hill 4 Plex close to downtown. Corner lot and close to shopping centers and bus line. Stove and refrigerator in each unit. Wood floors and ceiling fans throughout. ......Please Do Not Disturb Tenants.......
-
2023-06-23price $431,000 231-char remark
Show marketing remark (231 chars)
Centrally located Beacon Hill 4 Plex close to downtown. Corner lot and close to shopping centers and bus line. Stove and refrigerator in each unit. Wood floors and ceiling fans throughout. ......Please Do Not Disturb Tenants.......
-
2023-04-26$462,000 New 231-char remark
Show marketing remark (231 chars)
Centrally located Beacon Hill 4 Plex close to downtown. Corner lot and close to shopping centers and bus line. Stove and refrigerator in each unit. Wood floors and ceiling fans throughout. ......Please Do Not Disturb Tenants.......
-
2008-02-04soldstatus
-
2008-01-26soldstatus
-
2007-09-25$195,000
-
2004-08-04soldstatus
-
2004-05-13soldstatus
ⓘ Source: listings_history table (triggers on properties + properties_extension) + one-shot
backfill from property_details.listing_events for pre-trigger history.
Tax reassessment forecast TX · Resets to sale price
- Current annual tax
- $8,148 · $679/mo
- Projected year-2 tax
- $8,148 · $679/mo
- Expected delta
- $0/yr ($0/mo · 0.0%)
ⓘ Screening estimate from a state-policy table — verify with the county assessor before closing.
Climate risk First Street
- Flood 1/10 Low FEMA zone X (unshaded) · 0% chance over 30 yrs
- Wildfire 1/10 Low
- Heat 8/10 Severe 7 d/yr ≥108°F today · 22 d/yr by 30 yrs out
- Wind 6/10 Major 77% chance of damaging wind over 30 yrs
- Air quality 2/10 Low 1 unhealthy d/yr today · 1 by 30 yrs out
Nearby sold comps map
Loading sold comps map…
Walkable amenities ~0.75 mi
Loading nearby amenities…
Taxation est. · year 1
- Rental income
- $38,358
- − Mortgage interest
- −$19,886
- − Property taxes
- −$8,148
- − Insurance
- −$1,775
- − Repairs & maintenance
- −$3,069
- − Management
- −$3,069
- − Depreciation
- −$10,327
- Taxable loss
- −$7,915
- Est. tax savings @ 24.0%
- +$1,900
- After-tax cash flow
- $-61/yr
For passive investors: Depreciation is non-cash, so a rental often shows a tax loss while cash-flowing — sheltering income. Rental losses are passive: they offset passive income freely, and up to $25,000/yr can offset ordinary (W-2) income if you actively participate and your MAGI is under $100k (phasing out to $0 by $150k); unused losses carry forward. On sale, claimed depreciation is recaptured at up to 25%, and gains may owe capital-gains tax (a 1031 exchange can defer both). Figures are a year-1 estimate at your 24.0% rate — not tax advice; consult a CPA.
Schools (NCES district)
- District
- San Antonio ISD
- NCES district ID
- 4838730
- Math proficiency
- 12% ▼ -21.00%
- Reading proficiency
- 22% ▼ -7.00%
- Median HH income
- $30,952
- Composite
- 13.57/100
- National rank
- #9512
- State rank
- #805 of 826 in TX
Livability — San Antonio
- Score
- 80/100
- State rank
- #31
- US rank
- #1616
Category grades
Schools grade is shown separately in the Schools card above.
Census & demographics
- Census place
- San Antonio, TX
- County
- Bexar County · 1,990,555 people
- City population
- 1,806,925
- Metro
- San Antonio-New Braunfels, TX
- Population (ZIP)
- 27,437
- Household income
- $62,801
- Rent vs Own
- Severe rent burden
- 1505.0
Population outlook (Bexar County) Hauer SSP2
- Today (2025)
- 2,336,851 people
- By 2030
- 2,560,728 · +9.6%
- By 2040
- 3,020,569 · +29.3%
- By 2050
- 3,493,522 · +49.5%
- By 2075
- 4,668,459 · +99.8%
- By 2100
- 5,533,242 · +136.8%
Race, ethnicity, and origin ACS 2023
- Neighborhood character
- Diverse neighborhood (Simpson 0.55)
- Race & ethnicity
- Hispanic / Latino 58% White 34% Two or more races 34% Black 3% Asian 2%
- Hispanic origin (detail)
- Mexican 50%
- Common ancestry
- Slovak 2% Lithuanian 2% Romanian 1%
- Foreign-born
- 13% · Canada, China
- Languages at home
- 62% English-only · Spanish 36% Chinese 1%
Political lean MEDSL · Bexar
- 2024 margin
- Lean D (+9.8) · D 54.3% · R 44.6% · Other 1.1%
- 2008→2024 swing
- +4.2pp toward D · 2008: 5.6pp · 2024: 9.8pp
- All cycles
- 2024: D+9.8 2020: D+18.2 2016: D+13.5 2012: D+4.6 2008: D+5.6
Not yet ingested
- Civics
- —
Market trends
- HPI YoY
- ▼ -94.24%
- Current HPI
- 280.1006
- Rent YoY
- ▲ 0.89%
- Metro
- San Antonio-New Braunfels, TX
- State GDP YoY
- ▲ 3.95%
- F500 in state
- 110
Industry mix (Fortune 500 HQ in TX)
| Industry | F500 HQs | Revenue |
|---|---|---|
| Energy | 16 | $1,198B |
|
||
| Technology | 5 | $198B |
|
||
| Engineering / Construction | 4 | $72B |
|
||
| Energy Services | 3 | $60B |
|
||
| Utilities | 3 | $41B |
|
||
| Healthcare | 2 | $330B |
|
||
Price history
+89.7% since first listed14 events — show timeline
- 2026-05-02 Price Changed $370,000 LERA
- 2026-02-26 Price Changed $395,000 LERA
- 2025-05-10 Listed $425,000 LERA
- 2023-11-13 Sold (Public Records) — Public Records
- 2023-11-09 Sold (MLS) — LERA
- 2023-10-25 Pending — LERA
- 2023-10-11 Contingent — LERA
- 2023-06-23 Price Changed $431,000 LERA
- 2023-04-26 Listed $462,000 LERA
- 2008-02-04 Sold (Public Records) — Public Records
- 2008-01-26 Sold (MLS) — LERA
- 2007-09-25 Listed $195,000 LERA
- 2004-08-04 Sold (Public Records) — Public Records
- 2004-05-13 Sold (Public Records) — Public Records
Property tax history
+5.7%/yrLatest (2025): $8,148 · +0.0% YoY. Source: county tax records.
Cash-flow waterfall
monthlySold comps — $/sqft
last 12 mo · ≤1 miLoading sold comps…