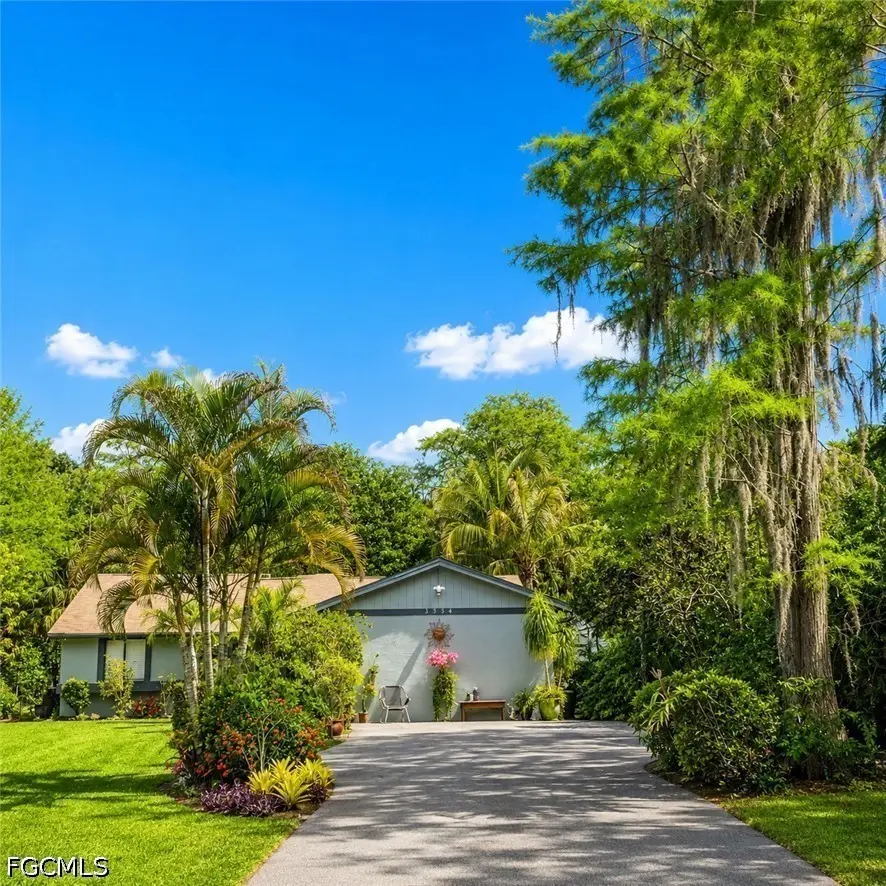
3534 White Blvd · Golden Gate, FL
Flood risk 1/10 · Minimal
- FEMA flood zone
- X (unshaded)
- Chance of flooding over 30 yrs
- 0.0%
- Est. flood insurance / yr
- $507 – $1,088
Fire risk 4/10 · Minor
- Est. fire insurance / yr
- $947 – $1,759
Heat risk 10/10 · Severe
- Hot days now (above 108°F)
- 7 days/yr
- Hot days in 30 yrs
- 28 days/yr
Wind risk 10/10 · Severe
- Chance of severe wind over 30 yrs
- 99.0%
Air-quality risk 2/10 · Minimal
- Unhealthy air days now
- 2 days/yr
- Unhealthy air days in 30 yrs
- 2 days/yr
Risk factors via First Street. Map © Google.
Why this score? — see what drove the F grade
The composite is a weighted blend of 9 inputs, each scored 0–100. Each bar is that input's sub-score; the figure is the points it added to the 100-point composite (weight × sub-score).
- ARV discount +7.5/15.0
- Cash flow +7.4/30.0
- Schools +5.0/10.0
- Livability +3.5/5.0
- Rent growth +2.5/5.0
- Condition / age +2.5/5.0
- DSCR +1.5/10.0
- 1% rule +1.0/10.0
- Appreciation +0.0/10.0
$510,000
🖨 Deal sheet 📄 Offer letter ✓ Due diligence
Listing remarks
Welcome to this beautiful, maintained tropical ranch-style estate offering 3 bedrooms, 2 bathrooms, a private office, and a sparkling pool, perfectly situated on a spacious lot in one of Naples most desirable growing areas. Surrounded by mature landscaping and lush greenery, this property offers the perfect blend of privacy, comfort, and the relaxed SWFL lifestyle. Inside, the home features a functional and inviting layout with abundant natural light, spacious living areas, and a dedicated office space ideal for working from home or additional flex space. Outdoors, enjoy your own private oasis with a pool, expansive yard, and plenty of room for entertainment, pets, or recreational vehicles.
Key facts
- Private office
- Expansive yard
- Private oasis
Tags
Property features AI
Finance
- Financial info: Pets allowed
- HOA & community: Non-gated community; No association fee listed
Exterior
- Parking: Driveway; Paved parking; RV access/parking
- Security: Smoke detector(s)
- Utilities: Well water; Septic tank; Cable available; High-speed internet available
- Home design: Single-story; Resale property; Home faces north
- Construction: Block, concrete and stucco construction; Shingle roof; Built on concrete foundation
- Exterior features: Oversized lot; Public maintained road; South exposure; Private in-ground concrete pool
Interior
- Kitchen: Dishwasher; Disposal; Microwave; Range; Refrigerator; Water purifier
- Bedrooms: Den (listed as an additional room type)
- Flooring: Tile
- Bathrooms: 2 full bathrooms
- Heating & cooling: Central heating (electric); Central air conditioning (electric)
- Interior features: Separate/formal dining room; Entrance foyer; Pantry; Tub with shower; Cable TV; Walk-in closet(s); Split bedroom layout; Single hung windows; Unfurnished
- Laundry & utility: Washer hookup; Dryer hookup
Neighborhood map
What this means for you Summary
Snapshot
- This is a 3-bed/2.0-bath single-family listed at $510k.
Deal economics
- At list price, monthly cash flow is $-667 ($-8k/yr) — negative.
- To cash-flow at today's rent, offer at most $392k (23.1% below list).
- To meet the 1% rule (rent ≥ 1% of price), the offer needs to be $304k (40.4% below list).
- Recommended offer: $304k (40.4% below list) — sets the bar for 1% rule.
Location & tenants
- Location reads 69/100 on livability (#455 in FL) — a middle-class / working-renter tenant base. Strengths: housing A+, health & safety A+, cost of living B; Watch: schools C-, employment D+, amenities F.
- Collier (suburban): math 60% / reading 56% proficiency, ranked #16 of 73 in FL (top 22%) — acceptable for families but not a draw, mixed tenant base, ~2y average lease.
- Market conditions: 368 active listings in the ZIP; 2 comparable units currently listed for rent nearby; high-income renter base; 3,520 units permitted in Collier County in 2024 (959 in 5+ unit buildings).
- This rent runs 33% of the median local income ($111k/yr) — at the standard rent-burdened threshold; future hikes will face affordability resistance.
Forward outlook
- Local home prices are declining (-3.0%/yr); year-one equity from $4k of loan paydown is wiped out by about $15k of value loss. Plan a longer hold.
- Collier County population projected at +30% by 2050 — long-run rental-demand tailwind backs the buy-and-hold thesis.
Negotiation context
- It's been on market 23 days — a 2% lower offer ($502k) is reasonable based on typical stale-listing flexibility.
- Current owner paid $106k; list at $510k implies a 383% gain — meaningful room to come down on a strong offer.
Risks & watch-outs
- Climate carrying-cost: severe wind risk, 99% chance of damaging wind over 30y; extreme-heat days projected 7→28/yr by 2055 (HVAC capex compounding) — expect insurance premiums to compound above CPI over the hold.
Questions for the listing agent
- What do current leases actually rent for vs. the listed asking? Can we see a recent rent roll and the last 12 months of T-12 income?
- Is there a deadline driving the sale (1031 exchange, divorce, estate, relocation)? That informs how much negotiation room exists.
- The area grade is low — what's the realistic commute time and amenity access for the typical tenant pool here? Any planned neighborhood developments (good or bad) we should know about?
- What's the average days-on-market for RENTAL listings here right now (not sales)? A rising rental-DOM trend means longer vacancies and softer asking-rent achievability than the comps imply.
- What's the recent tenant-quality profile in this submarket — average credit score on applications, eviction rate, late-payment / NSF rate, and stable-employment percentage? A property-management company in the area should have these aggregated.
- How much new for-sale + rental construction is in the pipeline within 1–3 miles? Heavy new supply typically softens prices + rents 12–24 months out; constrained supply supports both.
Investment metrics
- 1% rule
- 0.60% ✗
- Cap rate
- 4.72%
- Cash-on-cash
- -5.60%
- DSCR
- 0.75
- GRM
- 14.0
CMA / ARV
No comps found within radius.
Projected returns pro-forma
-3.0% appreciation · 3.0% rent growth · sell at horizon
- IRR
- -26.0%
- Equity multiple
- 0.12×
- Total profit
- $-125,331
- Equity at exit
- $76,043
- IRR
- -22.9%
- Equity multiple
- -0.15×
- Total profit
- $-164,755
- Equity at exit
- $44,095
Cash invested: $142,800 (down + closing). Projections, not guarantees.
Landlord ↔ Tenant lean methodology
- Overall (STATE)
- 87 Strongly Landlord-Friendly
- State Florida
- 87 Strongly Landlord-Friendly · R+3
- County
- — inherits STATE
- City
- — inherits STATE
ZIP-level market 34117
- Active inventory
- 368
- Price-to-rent
- 14.0×
Monthly cashflow live
- Estimated rent
- $3,041 medium interval (Pro) →
- Mortgage (P&I)
- −$2,674
- Tax from tax record
- −$182 /mo · $2,179/yr
- Insurance
- −$212
- HOA
- −$0
- Vacancy / Maint / Mgmt
- −$639
- Net cashflow
- $-667
Break-even live
UW: 25.0% down · 7.5% · 30yr · 1.5% tax · 5.0% vac · 8.0% maint · 8.0% mgmt
Financing live
Cash to close
- Down payment
- $127,500
- Closing costs
- $15,300
- Reserves months
- —
- Total cash needed
- —
Loan-product check · same deal, 3 products live
Conventional
25% down · 7.5% · 30yr
- Down + closing
- —
- Monthly P&I
- —
- Monthly cashflow
- —
- DSCR
- —
- Eligible?
- —
Personal DTI + credit; lowest rate.
DSCR
20% down · 8.5% · 30yr
- Down + closing
- —
- Monthly P&I
- —
- Monthly cashflow
- —
- DSCR
- —
- Eligible?
- —
No personal income docs; deal must DSCR.
Hard money
10% down · 12.0% · 12mo
- Down + closing
- —
- Monthly P&I
- —
- Monthly cashflow
- —
- DSCR
- —
- Eligible?
- —
Short-term bridge; refi at stabilization.
Rent comps 2 comps
| Address | Beds | Baths | Sqft | Rent | $/sqft | DOM | Units | Dist |
|---|---|---|---|---|---|---|---|---|
| 910 39th St SW Naples, FL | 3.0 | 2.0 | 1710 | $2,900 | $1.70 | 23d | 1 | 0.52mi |
| 4300 Atoll Ct Naples, FL | 1.0–2.0 | 1.0–2.0 | 910 | $2,020 | $2.22 | 14d | 15 | 1.33mi |
Listing history 14 events
-
2026-06-18days on market $510,000 Active 23 DOM
-
2026-06-17days on market $510,000 Active 22 DOM
-
2026-06-16days on market $510,000 Active 21 DOM
-
2026-06-15days on market $510,000 Active 20 DOM
-
2026-06-14days on market $510,000 Active 18 DOM
-
2026-06-10days on market $510,000 Active 15 DOM
-
2026-06-09days on market $510,000 Active 14 DOM
-
2026-06-08days on market $510,000 Active 13 DOM
-
2026-06-07days on market $510,000 Active 12 DOM
-
2026-06-03days on market $510,000 Active 8 DOM
-
2026-06-02statusdays on market $510,000 Active 7 DOM
-
2026-05-17$510,000 Active
-
1999-07-20soldstatus $105,500
-
1996-07-29soldstatus $88,000
ⓘ Source: listings_history table (triggers on properties + properties_extension) + one-shot
backfill from property_details.listing_events for pre-trigger history.
Tax reassessment forecast FL · Resets to sale price
- Current annual tax
- $2,179 · $182/mo
- Projected year-2 tax
- $4,233 · $353/mo
- Expected delta
- +$2,054/yr (+$171/mo · 94.3%)
ⓘ Screening estimate from a state-policy table — verify with the county assessor before closing.
Climate risk First Street
- Flood 1/10 Low FEMA zone X (unshaded) · 0% chance over 30 yrs
- Wildfire 4/10 Moderate
- Heat 10/10 Extreme 7 d/yr ≥108°F today · 28 d/yr by 30 yrs out
- Wind 10/10 Extreme 99% chance of damaging wind over 30 yrs
- Air quality 2/10 Low 2 unhealthy d/yr today · 2 by 30 yrs out
Nearby sold comps map
Loading sold comps map…
Walkable amenities ~0.75 mi
Loading nearby amenities…
Taxation est. · year 1
- Rental income
- $36,486
- − Mortgage interest
- −$28,568
- − Property taxes
- −$2,179
- − Insurance
- −$2,550
- − Repairs & maintenance
- −$2,919
- − Management
- −$2,919
- − Depreciation
- −$14,836
- Taxable loss
- −$17,485
- Est. tax savings @ 24.0%
- +$4,196
- After-tax cash flow
- $-3,803/yr
For passive investors: Depreciation is non-cash, so a rental often shows a tax loss while cash-flowing — sheltering income. Rental losses are passive: they offset passive income freely, and up to $25,000/yr can offset ordinary (W-2) income if you actively participate and your MAGI is under $100k (phasing out to $0 by $150k); unused losses carry forward. On sale, claimed depreciation is recaptured at up to 25%, and gains may owe capital-gains tax (a 1031 exchange can defer both). Figures are a year-1 estimate at your 24.0% rate — not tax advice; consult a CPA.
Schools (NCES district)
- District
- Collier
- NCES district ID
- 1200330
- Math proficiency
- 60% ▼ -4.00%
- Reading proficiency
- 56% ▼ -2.00%
- Median HH income
- $58,275
- Composite
- 50.23/100
- National rank
- #1892
- State rank
- #16 of 73 in FL
Livability — Golden Gate
- Score
- 69/100
- State rank
- #455
- US rank
- #8290
Category grades
Schools grade is shown separately in the Schools card above.
Census & demographics
- County
- Collier County · 396,295 people
- City population
- 34,872
- Metro
- Naples-Marco Island, FL
- Population (ZIP)
- 19,923
- Household income
- $110,614
- Rent vs Own
- Severe rent burden
- 103.0
Population outlook (Collier County) Hauer SSP2
- Today (2025)
- 420,858 people
- By 2030
- 450,054 · +6.9%
- By 2040
- 502,232 · +19.3%
- By 2050
- 544,932 · +29.5%
- By 2075
- 627,203 · +49.0%
- By 2100
- 659,015 · +56.6%
Race, ethnicity, and origin ACS 2023
- Neighborhood character
- Diverse neighborhood (Simpson 0.55)
- Race & ethnicity
- White 51% Hispanic / Latino 44% Two or more races 22% Black 3%
- Hispanic origin (detail)
- Mexican 13% Puerto Rican 3% Cuban 16% Dominican 1%
- Common ancestry
- Romanian 4% Lithuanian 2% Hispanic 1%
- Foreign-born
- 30% · Canada, Jamaica, China
- Languages at home
- 55% English-only · Spanish 39% French/Haitian/Cajun 2% Russian/Polish/Slavic 1%
Political lean MEDSL · Collier
- 2024 margin
- Solid R (+33.1) · D 33.1% · R 66.2%
- 2008→2024 swing
- -10.6pp toward R · 2008: -22.5pp · 2024: -33.1pp
- All cycles
- 2024: R+33.1 2020: R+24.7 2016: R+26.0 2012: R+30.1 2008: R+22.5
Not yet ingested
- Civics
- —
Market trends
- HPI YoY
- ▼ -205.53%
- Current HPI
- 378.5529
- Rent YoY
- —
- Metro
- Naples-Marco Island, FL
- State GDP YoY
- ▲ 3.28%
- F500 in state
- 36
Industry mix (Fortune 500 HQ in FL)
| Industry | F500 HQs | Revenue |
|---|---|---|
| Industrial Technology | 2 | $29B |
|
||
| Insurance | 2 | $17B |
|
||
| Retail | 1 | $60B |
|
||
| Technology Distribution | 1 | $58B |
|
||
| Homebuilding | 1 | $35B |
|
||
| Technology Manufacturing | 1 | $35B |
|
||
Price history
+479.5% since first listed3 events — show timeline
- 2026-05-17 Listed $510,000 FORTMLS
- 1999-07-20 Sold (Public Records) $105,500 Public Records
- 1996-07-29 Sold (Public Records) $88,000 Public Records
Property tax history
+10.5%/yrLatest (2025): $2,179 · +14.2% YoY. Source: county tax records.
Cash-flow waterfall
monthlySold comps — $/sqft
last 12 mo · ≤1 miLoading sold comps…