1655 Makaloa St #710 · Urban Honolulu, HI
Flood risk 8/10 · Major
- FEMA flood zone
- X (unshaded)
- Chance of flooding over 30 yrs
- 0.99%
- Est. flood insurance / yr
- $507 – $1,088
Fire risk No data
- Est. fire insurance / yr
- —
Heat risk No data
- Hot days now (above threshold)
- —
- Hot days in 30 yrs
- —
Wind risk No data
- Chance of severe wind over 30 yrs
- —
Air-quality risk 1/10 · Minimal
- Unhealthy air days now
- —
- Unhealthy air days in 30 yrs
- —
Risk factors via First Street. Map © Google.
Why this score? — see what drove the D grade
The composite is a weighted blend of 9 inputs, each scored 0–100. Each bar is that input's sub-score; the figure is the points it added to the 100-point composite (weight × sub-score).
- Cash flow +10.1/30.0
- ARV discount +7.5/15.0
- 1% rule +6.2/10.0
- Appreciation +6.0/10.0
- Schools +3.7/10.0
- Rent growth +3.3/5.0
- DSCR +2.9/10.0
- Livability +2.5/5.0
- Condition / age +2.5/5.0
$267,000
🖨 Deal sheet (PDF) 📄 Offer letter ✓ Due diligence
Listing remarks MLS
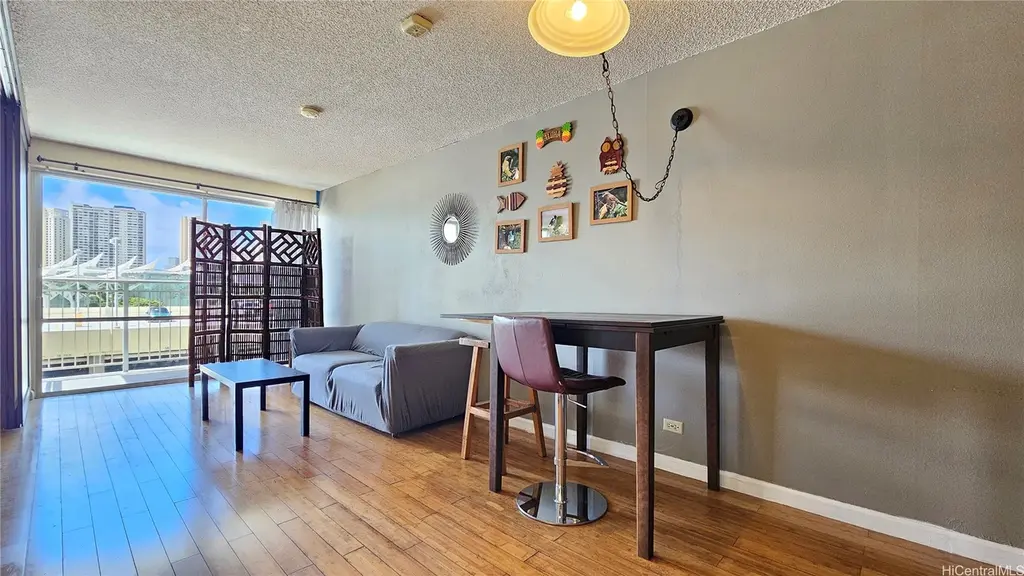
Immaculate - shows like a model. Great location - close to Don Quijote, WalMart, 24 Hr Fitness, Ala Moana, beach, etc. Secured elevator & parking. Storage locker. Maintenance fee includes electricity and basic cable.
Key facts
- Cabanas
- Storage locker
- Pool on 27th floor
Tags
Property features AI
Finance
- HOA & community: Monthly maintenance fee: $905; Association covers electricity, internet, water, sewer, grounds and structure maintenance; Association provides management; Community amenities include deck/porch, patio, storage, laundry facilities and trash chute
Exterior
- Parking: Assigned secured parking (one space); Open parking available
- Security: Closed-circuit cameras; Secured elevator
- Utilities: Water included in association; Sewer included in association; Electricity included in association; Internet included in association
- Home design: Condo in Kapiolani Manor; Entry on 7th level; Fee simple; BMX-3 Community Business M zoning
- Construction: Concrete construction; Built (effective) in 2026
- Exterior features: Has a view; Deck/Porch; Patio; Storage facilities; Trash chute; Closed-circuit cameras; Secured elevator
Interior
- Flooring: Vinyl
- Bathrooms: 1 full bathroom
- Interior features: Vinyl flooring; Good condition
- Laundry & utility: On-site laundry facilities
Neighborhood map
What this means for you Summary
Snapshot
- This is a 1-bed/1.0-bath condo listed at $267k.
Deal economics
- At list price, monthly cash flow is $-223 ($-3k/yr) — negative.
- To cash-flow at today's rent, offer at most $228k (14.8% below list).
- Meets the 1% rule at list price ($3k rent vs $267k).
- Recommended offer: $228k (14.8% below list) — sets the bar for cash-flow.
- Cap rate 5.6% vs local median 1.5% in Urban Honolulu — top-decile yield for the area; either an underpriced asset or a hidden risk that comps aren't pricing in. Stress-test before assuming the spread holds.
Location & tenants
- Location reads: area grade D — affects rentability + tenant quality, not the cash-flow math above.
- Hawaii Department Of Education (suburban): math 32% / reading 50% proficiency, ranked #1 of 1 in HI (top 100%) — families likely to look elsewhere, expect single-tenant / working-renter base with shorter leases.
- Zoned schools: Queen Kaahumanu Elementary School (math 27% / reading 43%, grade F, #107 of 183 statewide, top 58%, 430 students, 63% FRL); President George Washington Middle School (math 30% / reading 46%, grade F, #17 of 42 statewide, top 39%, 569 students, 61% FRL); President William Mckinley High School (math 28% / reading 69%, grade D, #13 of 43 statewide, top 33%, 1,502 students, 50% FRL) — zoned schools average 58% FRL vs 39% district-wide (19 pts higher); higher-poverty schools than district average — tighter screening recommended.
- Market conditions: Rents rising (+3.1%/yr); 561 active listings in the ZIP; 14 comparable units currently listed for rent nearby; rentals at typical pace (median 26d on market — plan ~3-4 weeks tenant-placement turnaround); solid renter incomes; 1,638 units permitted in Honolulu County in 2024 (793 in 5+ unit buildings).
- At $2,980/mo this rent would consume 46% of the median local household income ($78k/yr) (locally 1641% of renters already pay >50% of income on rent) — very limited rent-growth headroom before tenants either downsize or default.
Forward outlook
- In year one you build about $7k of equity ($2k loan paydown + $5k appreciation (2.0% local appreciation)).
- Honolulu County population projected at +17% by 2050 — long-run rental-demand tailwind backs the buy-and-hold thesis.
- By year 5, paydown + projected appreciation supports a ~$31k cash-out refi (75% LTV) — recoverable capital for the next deal without selling this one.
Negotiation context
- Only 13 days on market — expect competitive offers; lowballing is unlikely to land.
- 2 sale attempts since 13y ago with the ask held roughly flat each time — persistent listings suggest the price (not the market) is what's stuck; bring a comps-based counter.
Risks & watch-outs
- Watch-outs: flood insurance adds $66/mo; HOA is 30% of rent.
- Climate carrying-cost: severe flood risk — expect insurance premiums to compound above CPI over the hold.
Questions for the listing agent
- What do current leases actually rent for vs. the listed asking? Can we see a recent rent roll and the last 12 months of T-12 income?
- Built in 1970 — when were the roof, HVAC, electrical panel, plumbing, and water heater last replaced?
- What's the actual annual flood-insurance premium (NFIP or private), and is the property in a SFHA with mandatory coverage?
- What does the HOA fee cover, when was the last increase, and are there any pending special assessments or reserve-fund shortfalls?
- Any open or pending special assessments — roof, HVAC, plumbing, elevator, façade? What's the per-unit balance and payoff schedule, and is the seller paying it off at close or rolling it to the buyer?
- Is there a deadline driving the sale (1031 exchange, divorce, estate, relocation)? That informs how much negotiation room exists.
- The area grade is low — what's the realistic commute time and amenity access for the typical tenant pool here? Any planned neighborhood developments (good or bad) we should know about?
- What's the average days-on-market for RENTAL listings here right now (not sales)? A rising rental-DOM trend means longer vacancies and softer asking-rent achievability than the comps imply.
- What's the recent tenant-quality profile in this submarket — average credit score on applications, eviction rate, late-payment / NSF rate, and stable-employment percentage? A property-management company in the area should have these aggregated.
- How much new apartment / multifamily construction is in the pipeline within 1–3 miles? Heavy new supply (>2% of stock underway) typically softens rents 12–24 months out; light construction supports rent growth.
Investment metrics
- 1% rule
- 1.12% ✓
- Cap rate
- 5.59%
- Cash-on-cash
- -2.52%
- DSCR
- 0.89
- GRM
- 7.5
CMA / ARV
No comps found within radius.
Projected returns pro-forma
1.98% appreciation · 3.1% rent growth · sell at horizon
- IRR
- 1.1%
- Equity multiple
- 1.06×
- Total profit
- $4,567
- Equity at exit
- $104,972
- IRR
- 5.4%
- Equity multiple
- 1.75×
- Total profit
- $55,727
- Equity at exit
- $150,900
Cash invested: $74,760 (down + closing). Projections, not guarantees.
Landlord ↔ Tenant lean methodology
- Overall (STATE)
- 37 Tenant-Leaning
- State Hawaii
- 37 Tenant-Leaning · D+13
- County
- — inherits STATE
- City
- — inherits STATE
ZIP-level market 96814
- Home prices YoY
- 0.5%
- Rents YoY
- 3.1%
- Active inventory
- 561
- Price-to-rent
- 7.5×
Monthly cashflow live
- Estimated rent
- $2,980 high interval (Pro) →
- Mortgage (P&I)
- −$1,400
- Tax from tax record
- −$94 /mo · $1,132/yr
- Insurance
- −$111
- Flood insurance flood zone
- −$66 /mo · $798/yr
- HOA
- −$905
- Vacancy / Maint / Mgmt
- −$626
- Net cashflow
- $-223
Break-even live
Sensitivity live
| Price | -10% $-72 | -5% $-148 | +0% $-223 | +5% $-299 | +10% $-374 |
|---|---|---|---|---|---|
| Rent | -10% $-459 | -5% $-341 | +0% $-223 | +5% $-105 | +10% $12 |
| Rate | -1.0pp $-89 | -0.5pp $-155 | base $-223 | +0.5pp $-292 | +1.0pp $-363 |
UW: 25.0% down · 7.5% · 30yr · 1.5% tax · 5.0% vac · 8.0% maint · 8.0% mgmt
Financing live
Cash to close
- Down payment
- $66,750
- Closing costs
- $8,010
- Reserves months
- —
- Total cash needed
- —
Loan-product check · same deal, 3 products live
Conventional
25% down · 7.5% · 30yr
- Down + closing
- —
- Monthly P&I
- —
- Monthly cashflow
- —
- DSCR
- —
- Eligible?
- —
Personal DTI + credit; lowest rate.
DSCR
20% down · 8.5% · 30yr
- Down + closing
- —
- Monthly P&I
- —
- Monthly cashflow
- —
- DSCR
- —
- Eligible?
- —
No personal income docs; deal must DSCR.
Hard money
10% down · 12.0% · 12mo
- Down + closing
- —
- Monthly P&I
- —
- Monthly cashflow
- —
- DSCR
- —
- Eligible?
- —
Short-term bridge; refi at stabilization.
Rent comps 14 comps
| Address | Beds | Baths | Sqft | Rent | $/sqft | DOM | Units | Dist |
|---|---|---|---|---|---|---|---|---|
| 440 Olohana St Unit 1327703P Honolulu, HI | 1.0 | 1.0 | 355 | $4,055 | $11.42 | 13d | 1 | 0.72mi |
| 440 Olohana St Unit 1327711P Honolulu, HI | 1.0 | 1.0 | 355 | $3,741 | $10.54 | 3d | 1 | 0.72mi |
| 902 University Ave Unit C Honolulu, HI | 2.0 | 1.0 | 415 | $2,318 | $5.58 | 25d | 1 | 0.96mi |
| 987 Queen St Honolulu, HI | 2.0 | 1.0–2.0 | 554 | $3,925 | $7.08 | 19d | 9 | 1.03mi |
| 987 Queen St Honolulu, HI | 2.0 | 1.0–2.0 | 554 | $4,000 | $7.22 | 17d | 8 | 1.03mi |
| 987 Queen St Honolulu, HI | 1.0 | 1.0 | 453 | $3,800 | $8.39 | 12d | 9 | 1.03mi |
| 1568 Pensacola St Honolulu, HI | 1.0–2.0 | 1.0 | 523 | $2,280 | $4.36 | 25d | 1 | 1.06mi |
| 1000 Auahi St Honolulu, HI | 2.0 | 1.0–2.0 | 629 | $4,425 | $7.03 | 25d | 2 | 1.09mi |
| 242 Kaʻiulani Ave Unit 4 Honolulu, HI | — | 1.0 | 253 | $1,200 | $4.74 | 25d | 1 | 1.34mi |
| 242 Kaiulani Ave Honolulu, HI | — | 1.0 | 253 | $1,250 | $4.94 | 25d | 1 | 1.34mi |
| 232 Kaiulani Ave Honolulu, HI | 3.0 | 1.0 | 656 | $3,088 | $4.71 | 25d | 8 | 1.34mi |
| 2442 Tusitala St Apt 103 Honolulu, HI | — | 1.0 | 300 | $1,900 | $6.33 | 45d | 1 | 1.43mi |
| 249 Kapili St Unit 1 Honolulu, HI | — | 1.0 | 290 | $1,350 | $4.66 | 23d | 1 | 1.46mi |
| 249 Kapili St #101 Honolulu, HI | — | 1.0 | 225 | $1,500 | $6.67 | 25d | 1 | 1.46mi |
HOA detail condo
- Monthly dues
- $905 · $10,860/yr
- Likely covers
- electriccable
- Assessments
- None detected in remarks — confirm with the listing agent.
Listing history 10 events
-
2026-06-21days on market $267,000 Active 13 DOM
-
2026-06-18days on market $267,000 Active 10 DOM
-
2026-06-17days on market $267,000 Active 9 DOM
-
2026-06-16days on market $267,000 Active 8 DOM
-
2026-06-15days on market $267,000 Active 7 DOM
-
2026-06-13days on market $267,000 Active 5 DOM
-
2026-06-13days on market $267,000 Active 4 DOM
-
2026-06-10days on market $267,000 Active 2 DOM
-
2026-06-08remarks 536-char remark
-
2026-06-08$267,000 Active 1 DOM
ⓘ Source: listings_history table (triggers on properties + properties_extension) + one-shot
backfill from property_details.listing_events for pre-trigger history.
Tax reassessment forecast HI · Partial reset (capped growth)
- Current annual tax
- $1,132 · $94/mo
- Projected year-2 tax
- $1,132 · $94/mo
- Expected delta
- $0/yr ($0/mo · 0.0%)
ⓘ Screening estimate from a state-policy table — verify with the county assessor before closing.
Climate risk First Street
- Flood 8/10 Severe FEMA zone X (unshaded) · 99% chance over 30 yrs
- Air quality 1/10 Low
Nearby sold comps map
Loading sold comps map…
Walkable amenities ~0.75 mi
Loading nearby amenities…
Taxation est. · year 1
- Rental income
- $35,757
- − Mortgage interest
- −$14,956
- − Property taxes
- −$1,132
- − Insurance
- −$2,132
- − Repairs & maintenance
- −$2,861
- − Management
- −$2,861
- − HOA
- −$10,860
- − Depreciation
- −$7,767
- Taxable loss
- −$6,812
- Est. tax savings @ 24.0%
- +$1,635
- After-tax cash flow
- $-1,043/yr
For passive investors: Depreciation is non-cash, so a rental often shows a tax loss while cash-flowing — sheltering income. Rental losses are passive: they offset passive income freely, and up to $25,000/yr can offset ordinary (W-2) income if you actively participate and your MAGI is under $100k (phasing out to $0 by $150k); unused losses carry forward. On sale, claimed depreciation is recaptured at up to 25%, and gains may owe capital-gains tax (a 1031 exchange can defer both). Figures are a year-1 estimate at your 24.0% rate — not tax advice; consult a CPA.
Schools (NCES district)
- District
- Hawaii Department Of Education
- NCES district ID
- 1500030
- Math proficiency
- 32% ▼ -10.00%
- Reading proficiency
- 50% ▼ -3.00%
- Median HH income
- $69,005
- Composite
- 37.07/100
- National rank
- #4504
- State rank
- #1 of 1 in HI
Livability — Urban Honolulu
No livability data for this city. (Only ~50 U.S. cities are tracked.)
Census & demographics
- Census place
- Urban Honolulu, HI
- County
- Honolulu County · 963,448 people
- City population
- 309,956
- Metro
- Urban Honolulu, HI
- Population (ZIP)
- 24,689
- Household income
- $77,768
- Rent vs Own
- Severe rent burden
- 1641.0
Population outlook (Honolulu County) Hauer SSP2
- Today (2025)
- 1,072,641 people
- By 2030
- 1,110,460 · +3.5%
- By 2040
- 1,181,593 · +10.2%
- By 2050
- 1,257,584 · +17.2%
- By 2075
- 1,501,120 · +39.9%
- By 2100
- 1,764,430 · +64.5%
Race, ethnicity, and origin ACS 2023
- Neighborhood character
- Diverse neighborhood (Simpson 0.58)
- Race & ethnicity
- Asian 64% Two or more races 14% White 13% Pacific Islander 6% Hispanic / Latino 5% Black 1%
- Hispanic origin (detail)
- Mexican 2% Puerto Rican 2%
- Common ancestry
- Russian 1% Lithuanian 1% Italian 1%
- Foreign-born
- 35% · China, South Korea, Vietnam
- Languages at home
- 58% English-only · Other Asian/Pacific 15% Chinese 10% Korean 9%
Political lean MEDSL · Honolulu
- 2024 margin
- Strong D (+21.6) · D 59.9% · R 38.3% · Other 1.8%
- 2008→2024 swing
- -19.4pp toward R · 2008: 41.1pp · 2024: 21.6pp
- All cycles
- 2024: D+21.6 2020: D+26.9 2016: D+29.9 2012: D+39.1 2008: D+41.1
Not yet ingested
- Civics
- —
Market trends
- HPI YoY
- ▲ 1.98%
- Current HPI
- 376.4197
- Rent YoY
- ▲ 3.10%
- Metro
- Urban Honolulu, HI
- State GDP YoY
- —
- F500 in state
- 0
Price history
+981.0% since first listed5 events — show timeline
- 2026-06-08 Listed $267,000 HiCentral MLS
- 2013-08-12 Sold (MLS) $267,000 HiCentral MLS
- 2013-08-09 Sold (Public Records) $267,000 Public Records
- 2013-04-23 Listed $269,900 HiCentral MLS
- 1970-08-01 Sold (Public Records) $24,700 Public Records
Property tax history
+10.3%/yrLatest (2022): $1,132 · +8.2% YoY. Source: county tax records.
Cash-flow waterfall
monthlySold comps — $/sqft
last 12 mo · ≤1 miLoading sold comps…