 🏗️ New Construction
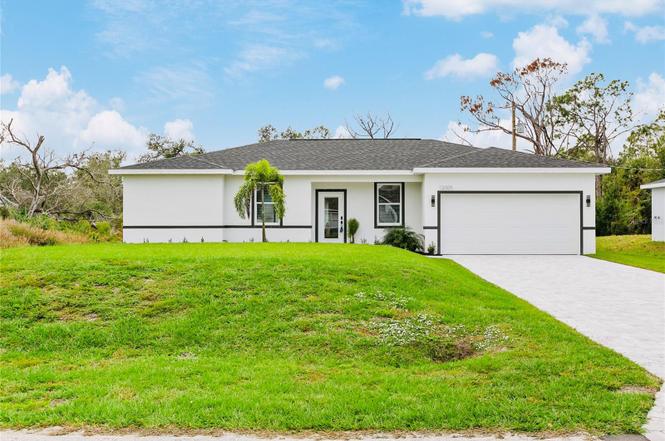
19233 Wilton Ave · Port Charlotte, FL
Flood risk 4/10 · Minor
- FEMA flood zone
- X (unshaded)
- Chance of flooding over 30 yrs
- 0.21%
- Est. flood insurance / yr
- $507 – $1,088
Fire risk 2/10 · Minimal
- Est. fire insurance / yr
- $947 – $1,759
Heat risk 10/10 · Severe
- Hot days now (above 107°F)
- 7 days/yr
- Hot days in 30 yrs
- 28 days/yr
Wind risk 10/10 · Severe
- Chance of severe wind over 30 yrs
- 99.0%
Air-quality risk 3/10 · Minor
- Unhealthy air days now
- 2 days/yr
- Unhealthy air days in 30 yrs
- 2 days/yr
Risk factors via First Street. Map © Google.
Why this score? — see what drove the D+ grade
The composite is a weighted blend of 9 inputs, each scored 0–100. Each bar is that input's sub-score; the figure is the points it added to the 100-point composite (weight × sub-score).
- Cash flow +19.1/30.0
- ARV discount +7.5/15.0
- DSCR +6.0/10.0
- Schools +4.6/10.0
- 1% rule +3.7/10.0
- Livability +3.2/5.0
- Condition / age +2.5/5.0
- Rent growth +1.6/5.0
- Appreciation +0.0/10.0
$250,500
🖨 Deal sheet 📄 Offer letter ✓ Due diligence
Listing remarks MLS
Great opportunity to build your own home! There are existing homes on the street nearby. Come take a look!
Key facts
- Open-concept kitchen
- Stylish backsplash
- Granite countertops
Tags
Property features AI
Finance
- Other: Lot approximately 0.27 acres (95 x 125); Living area about 1,636 (public records); Total building area about 2,079; Zoning: RSF3.5
Exterior
- Parking: Attached 2-car garage
- Utilities: Public water; Other sewer; Other utilities
- Home design: Single-family residence; Under construction (projected completion: March 31, 2026); One story; North-facing
- Construction: Block construction; Shingle roof; Slab foundation; New construction
- Exterior features: Other exterior features; Paved road access
Interior
- Kitchen: No appliances listed
- Bedrooms: 4 bedrooms
- Flooring: Other flooring
- Bathrooms: 2 full bathrooms
- Heating & cooling: Other heating; Other cooling
- Interior features: Other interior features
- Laundry & utility: Dedicated laundry room
Neighborhood map
What this means for you Summary
Snapshot
- This is a 4-bed/2.0-bath land listed at $250k.
Deal economics
- At list price, monthly cash flow is $265 ($3k/yr) — positive.
- The deal already cash-flows at list — no discount required.
- To meet the 1% rule (rent ≥ 1% of price), the offer needs to be $218k (12.8% below list).
- Recommended offer: $218k (12.8% below list) — sets the bar for 1% rule.
- Cap rate 7.6% vs local median 4.4% in Port Charlotte — top-decile yield for the area; either an underpriced asset or a hidden risk that comps aren't pricing in. Stress-test before assuming the spread holds.
Location & tenants
- Location reads 65/100 on livability (#655 in FL) — a middle-class / working-renter tenant base. Strengths: cost of living A+, housing A+; Watch: schools D+, employment D, amenities F.
- Charlotte (suburban): math 54% / reading 54% proficiency, ranked #22 of 73 in FL (top 30%) — acceptable for families but not a draw, mixed tenant base, ~2y average lease.
- Market conditions: Rents falling (-3.5%/yr); 689 active listings in the ZIP; 11 comparable units currently listed for rent nearby; rentals at typical pace (median 21d on market — plan ~3-4 weeks tenant-placement turnaround); solid renter incomes; 4,585 units permitted in Charlotte County in 2024 (703 in 5+ unit buildings).
- This rent runs 33% of the median local income ($78k/yr) — at the standard rent-burdened threshold; future hikes will face affordability resistance.
Forward outlook
- Local home prices are declining (-3.0%/yr); year-one equity from $2k of loan paydown is wiped out by about $8k of value loss. Plan a longer hold.
- Charlotte County population projected at +24% by 2050 — long-run rental-demand tailwind backs the buy-and-hold thesis.
Negotiation context
- It's been on market 385 days — a 12% lower offer ($220k) is reasonable based on typical stale-listing flexibility.
- 2 sale attempts since 4y ago with the ask held roughly flat each time — persistent listings suggest the price (not the market) is what's stuck; bring a comps-based counter.
- Current owner paid $53k; list at $250k implies a 373% gain — meaningful room to come down on a strong offer.
Risks & watch-outs
- Climate carrying-cost: severe wind risk, 99% chance of damaging wind over 30y; extreme-heat days projected 7→28/yr by 2055 (HVAC capex compounding) — expect insurance premiums to compound above CPI over the hold.
Questions for the listing agent
- It's been on market 385 days. Have you received any prior offers? Is the seller open to a 13% concession, seller financing, or rate buy-down credit?
- Why hasn't it sold? Are there any deal-killer items the seller is aware of (foundation, flood, title, zoning, code violations)?
- Is there a deadline driving the sale (1031 exchange, divorce, estate, relocation)? That informs how much negotiation room exists.
- Schools are D-rated, which usually means shorter tenancies and higher turnover. Who's the typical renter profile here, and what's been the actual vacancy rate?
- The area grade is low — what's the realistic commute time and amenity access for the typical tenant pool here? Any planned neighborhood developments (good or bad) we should know about?
- What's the average days-on-market for RENTAL listings here right now (not sales)? A rising rental-DOM trend means longer vacancies and softer asking-rent achievability than the comps imply.
- What's the recent tenant-quality profile in this submarket — average credit score on applications, eviction rate, late-payment / NSF rate, and stable-employment percentage? A property-management company in the area should have these aggregated.
- How much new for-sale + rental construction is in the pipeline within 1–3 miles? Heavy new supply typically softens prices + rents 12–24 months out; constrained supply supports both.
Investment metrics
- 1% rule
- 0.87% ✗
- Cap rate
- 7.56%
- Cash-on-cash
- 4.53%
- DSCR
- 1.20
- GRM
- 9.6
CMA / ARV
No comps found within radius.
Projected returns pro-forma
-3.0% appreciation · 0.0% rent growth · sell at horizon
- IRR
- -12.3%
- Equity multiple
- 0.57×
- Total profit
- $-30,265
- Equity at exit
- $37,350
- IRR
- -7.7%
- Equity multiple
- 0.57×
- Total profit
- $-29,917
- Equity at exit
- $21,659
Cash invested: $70,140 (down + closing). Projections, not guarantees.
Landlord ↔ Tenant lean methodology
- Overall (STATE)
- 87 Strongly Landlord-Friendly
- State Florida
- 87 Strongly Landlord-Friendly · R+3
- County
- — inherits STATE
- City
- — inherits STATE
ZIP-level market 33954
- Home prices YoY
- -13.3%
- Rents YoY
- -3.5%
- Active inventory
- 689
- Price-to-rent
- 9.6×
Monthly cashflow live
- Estimated rent
- $2,184 high interval (Pro) →
- Mortgage (P&I)
- −$1,314
- Tax from tax record
- −$42 /mo · $508/yr
- Insurance
- −$104
- HOA
- −$0
- Vacancy / Maint / Mgmt
- −$459
- Net cashflow
- $265
Break-even live
UW: 25.0% down · 7.5% · 30yr · 1.5% tax · 5.0% vac · 8.0% maint · 8.0% mgmt
Financing live
Cash to close
- Down payment
- $62,625
- Closing costs
- $7,515
- Reserves months
- —
- Total cash needed
- —
Loan-product check · same deal, 3 products live
Conventional
25% down · 7.5% · 30yr
- Down + closing
- —
- Monthly P&I
- —
- Monthly cashflow
- —
- DSCR
- —
- Eligible?
- —
Personal DTI + credit; lowest rate.
DSCR
20% down · 8.5% · 30yr
- Down + closing
- —
- Monthly P&I
- —
- Monthly cashflow
- —
- DSCR
- —
- Eligible?
- —
No personal income docs; deal must DSCR.
Hard money
10% down · 12.0% · 12mo
- Down + closing
- —
- Monthly P&I
- —
- Monthly cashflow
- —
- DSCR
- —
- Eligible?
- —
Short-term bridge; refi at stabilization.
Rent comps 11 comps
| Address | Beds | Baths | Sqft | Rent | $/sqft | DOM | Units | Dist |
|---|---|---|---|---|---|---|---|---|
| 678 Rutland Cir Port Charlotte, FL | 4.0 | 2.0 | 1833 | $1,925 | $1.05 | 13d | 1 | 0.31mi |
| 375 Denver Dr Port Charlotte, FL | 3.0 | 2.0 | 1534 | $2,199 | $1.43 | 21d | 1 | 0.31mi |
| 19335 Water Oak Dr #108 Port Charlotte, FL | 3.0 | 2.0 | 1207 | $1,950 | $1.62 | 21d | 1 | 0.62mi |
| 18412 Moonshadow Ave Port Charlotte, FL | 4.0 | 2.0 | 1833 | $1,895 | $1.03 | 21d | 1 | 0.69mi |
| 18404 Moonshadow Ave Port Charlotte, FL | 4.0 | 2.0 | 1833 | $1,995 | $1.09 | 21d | 1 | 0.71mi |
| 18400 Tulane Ave Port Charlotte, FL | 4.0 | 2.0 | 1636 | $2,600 | $1.59 | 13d | 1 | 0.75mi |
| 225 Overbrook St Unit NA Port Charlotte, FL | 3.0 | 2.0 | 1698 | $2,400 | $1.41 | 13d | 1 | 0.99mi |
| 20217 Renwick Ave Port Charlotte, FL | 4.0 | 2.0 | 1556 | $2,050 | $1.32 | 21d | 1 | 1.05mi |
| 504 Vannell St Port Charlotte, FL | 3.0 | 2.0 | 1698 | $1,700 | $1.00 | 21d | 1 | 1.09mi |
| 18118 Sullivan Ave Port Charlotte, FL | 4.0 | 2.0 | 1481 | $1,860 | $1.26 | 21d | 1 | 1.25mi |
| 1275 Price Cir NW Port Charlotte, FL | 3.0 | 2.0 | 1810 | $1,700 | $0.94 | 21d | 1 | 1.48mi |
Listing history 24 events
-
2026-06-18days on market $250,500 Active 385 DOM
-
2026-06-17days on market $250,500 Active 384 DOM
-
2026-06-16days on market $250,500 Active 383 DOM
-
2026-06-15days on market $250,500 Active 382 DOM
-
2026-06-14days on market $250,500 Active 380 DOM
-
2026-06-13days on market $250,500 Active 379 DOM
-
2026-06-10days on market $250,500 Active 377 DOM
-
2026-06-09days on market $250,500 Active 376 DOM
-
2026-06-08days on market $250,500 Active 375 DOM
-
2026-06-05days on market $250,500 Active 371 DOM
-
2026-06-02days on market $250,500 Active 369 DOM
-
2026-06-01days on market $250,500 Active 368 DOM
-
2026-05-31days on market $250,500 Active 367 DOM
-
2026-05-30days on market $250,500 Active 366 DOM
-
2026-03-01price $250,500
-
2025-09-17price $260,500
-
2025-05-29$262,500 Active
-
2023-02-03soldstatus $53,000
-
2022-06-17soldstatus $17,500 Closed 106-char remark
Show marketing remark (106 chars)
Great opportunity to build your own home! There are existing homes on the street nearby. Come take a look!
-
2022-06-14soldstatus $17,500
-
2022-04-08status Pending 106-char remark
Show marketing remark (106 chars)
Great opportunity to build your own home! There are existing homes on the street nearby. Come take a look!
-
2022-04-04$21,000 Active 106-char remark
Show marketing remark (106 chars)
Great opportunity to build your own home! There are existing homes on the street nearby. Come take a look!
-
2004-09-08soldstatus $25,000
-
2001-01-19soldstatus $941,100
ⓘ Source: listings_history table (triggers on properties + properties_extension) + one-shot
backfill from property_details.listing_events for pre-trigger history.
Tax reassessment forecast FL · Resets to sale price
- Current annual tax
- $508 · $42/mo
- Projected year-2 tax
- $2,079 · $173/mo
- Expected delta
- +$1,571/yr (+$131/mo · 309.3%)
ⓘ Screening estimate from a state-policy table — verify with the county assessor before closing.
Climate risk First Street
- Flood 4/10 Moderate FEMA zone X (unshaded) · 21% chance over 30 yrs
- Wildfire 2/10 Low
- Heat 10/10 Extreme 7 d/yr ≥107°F today · 28 d/yr by 30 yrs out
- Wind 10/10 Extreme 99% chance of damaging wind over 30 yrs
- Air quality 3/10 Moderate 2 unhealthy d/yr today · 2 by 30 yrs out
Nearby sold comps map
Loading sold comps map…
Walkable amenities ~0.75 mi
Loading nearby amenities…
Taxation est. · year 1
- Rental income
- $26,204
- − Mortgage interest
- −$14,032
- − Property taxes
- −$508
- − Insurance
- −$1,252
- − Repairs & maintenance
- −$2,096
- − Management
- −$2,096
- − Depreciation
- −$7,287
- Taxable loss
- −$1,069
- Est. tax savings @ 24.0%
- +$256
- After-tax cash flow
- $3,433/yr
For passive investors: Depreciation is non-cash, so a rental often shows a tax loss while cash-flowing — sheltering income. Rental losses are passive: they offset passive income freely, and up to $25,000/yr can offset ordinary (W-2) income if you actively participate and your MAGI is under $100k (phasing out to $0 by $150k); unused losses carry forward. On sale, claimed depreciation is recaptured at up to 25%, and gains may owe capital-gains tax (a 1031 exchange can defer both). Figures are a year-1 estimate at your 24.0% rate — not tax advice; consult a CPA.
Schools (NCES district)
- District
- Charlotte
- NCES district ID
- 1200240
- Math proficiency
- 54% ▼ -6.00%
- Reading proficiency
- 54% ▼ -1.00%
- Median HH income
- $44,864
- Composite
- 45.62/100
- National rank
- #2586
- State rank
- #22 of 73 in FL
Livability — Port Charlotte
- Score
- 65/100
- State rank
- #655
- US rank
- #13081
Category grades
Schools grade is shown separately in the Schools card above.
Census & demographics
- County
- Charlotte County · 196,994 people
- City population
- 102,180
- Metro
- Punta Gorda, FL
- Population (ZIP)
- 11,193
- Household income
- $78,288
- Rent vs Own
- Severe rent burden
- 263.0
Population outlook (Charlotte County) Hauer SSP2
- Today (2025)
- 198,646 people
- By 2030
- 210,507 · +6.0%
- By 2040
- 230,857 · +16.2%
- By 2050
- 247,148 · +24.4%
- By 2075
- 281,777 · +41.8%
- By 2100
- 293,609 · +47.8%
Race, ethnicity, and origin ACS 2023
- Neighborhood character
- Predominantly White (75%)
- Race & ethnicity
- White 75% Hispanic / Latino 12% Two or more races 10% Black 9%
- Hispanic origin (detail)
- Puerto Rican 4% Dominican 1%
- Common ancestry
- Lithuanian 5% Romanian 3% Subsaharan African 2%
- Foreign-born
- 14% · Canada
- Languages at home
- 86% English-only · Spanish 7% Russian/Polish/Slavic 3% French/Haitian/Cajun 2%
Political lean MEDSL · Charlotte
- 2024 margin
- Solid R (+34.0) · D 32.7% · R 66.7%
- 2008→2024 swing
- -26.7pp toward R · 2008: -7.2pp · 2024: -34.0pp
- All cycles
- 2024: R+34.0 2020: R+26.6 2016: R+27.8 2012: R+14.3 2008: R+7.2
Not yet ingested
- Civics
- —
Market trends
- HPI YoY
- ▼ -51.25%
- Current HPI
- 335.3128
- Rent YoY
- ▼ -3.48%
- Metro
- Punta Gorda, FL
- State GDP YoY
- ▲ 3.28%
- F500 in state
- 36
Industry mix (Fortune 500 HQ in FL)
| Industry | F500 HQs | Revenue |
|---|---|---|
| Industrial Technology | 2 | $29B |
|
||
| Insurance | 2 | $17B |
|
||
| Retail | 1 | $60B |
|
||
| Technology Distribution | 1 | $58B |
|
||
| Homebuilding | 1 | $35B |
|
||
| Technology Manufacturing | 1 | $35B |
|
||
Price history
-73.4% since first listed10 events — show timeline
- 2026-03-01 Price Changed $250,500 Stellar MLS as Distributed by MLS Grid
- 2025-09-17 Price Changed $260,500 Stellar MLS as Distributed by MLS Grid
- 2025-05-29 Listed $262,500 Stellar MLS as Distributed by MLS Grid
- 2023-02-03 Sold (Public Records) $53,000 Public Records
- 2022-06-17 Sold (MLS) $17,500 Stellar MLS as Distributed by MLS Grid
- 2022-06-14 Sold (Public Records) $17,500 Public Records
- 2022-04-08 Pending — Stellar MLS as Distributed by MLS Grid
- 2022-04-04 Listed $21,000 Stellar MLS as Distributed by MLS Grid
- 2004-09-08 Sold (Public Records) $25,000 Public Records
- 2001-01-19 Sold (Public Records) $941,100 Public Records
Property tax history
+3.7%/yrLatest (2025): $508 · -2.9% YoY. Source: county tax records.
Cash-flow waterfall
monthlySold comps — $/sqft
last 12 mo · ≤1 miLoading sold comps…