 🌊 Lakefront
2936 Oleander St Unit A2 · St. James City, FL
Flood risk 9/10 · Severe
- FEMA flood zone
- AE
- Chance of flooding over 30 yrs
- 0.99%
- Est. flood insurance / yr
- $1,737 – $8,500
Fire risk 3/10 · Minor
- Est. fire insurance / yr
- $947 – $1,759
Heat risk 10/10 · Severe
- Hot days now (above 107°F)
- 7 days/yr
- Hot days in 30 yrs
- 28 days/yr
Wind risk 10/10 · Severe
- Chance of severe wind over 30 yrs
- 99.0%
Air-quality risk 2/10 · Minimal
- Unhealthy air days now
- 1 days/yr
- Unhealthy air days in 30 yrs
- 2 days/yr
Risk factors via First Street. Map © Google.
Why this score? — see what drove the B- grade
The composite is a weighted blend of 9 inputs, each scored 0–100. Each bar is that input's sub-score; the figure is the points it added to the 100-point composite (weight × sub-score).
- Cash flow +29.6/30.0
- 1% rule +10.0/10.0
- DSCR +10.0/10.0
- ARV discount +7.5/15.0
- Schools +4.1/10.0
- Rent growth +2.5/5.0
- Livability +2.5/5.0
- Condition / age +2.5/5.0
- Appreciation +0.0/10.0
$299,900
🖨 Deal sheet (PDF) 📄 Offer letter ✓ Due diligence
Listing remarks MLS
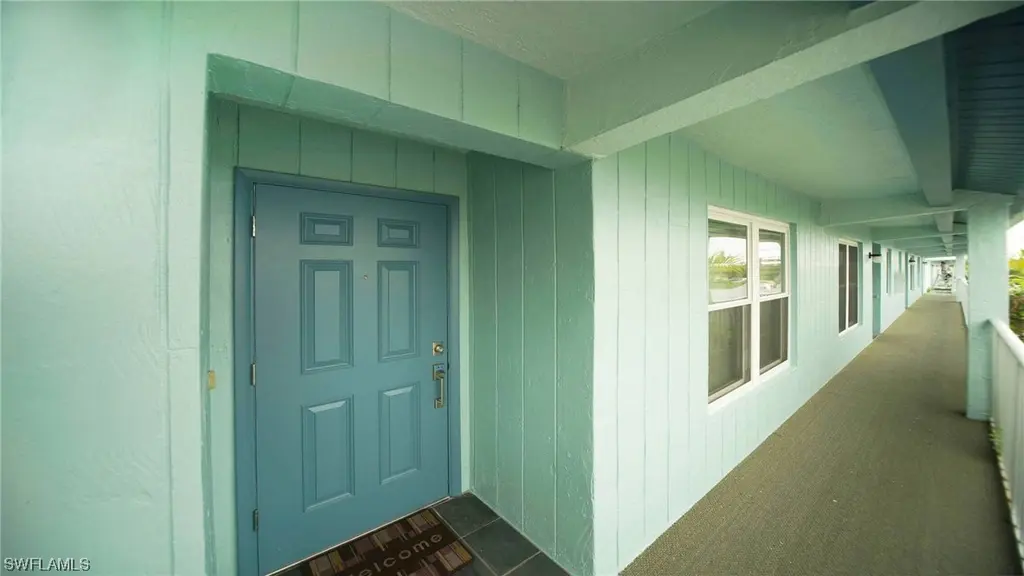
This should be your new home or vacation home! Beautiful 2nd floor condo - everything has been done. All new kitchen- appliances, cabinets, 2- new tile bathrooms, + tile floors! Pine Island has some of the best restaurants, entertainment, boating and fishing, biking and hiking trails. Just think you could be sitting on your screened lanai-looking at your boat all while enjoying some of the most beautiful subtropical landscape.
Key facts
- $750 HOA
- Parking
- Community pool
Property features AI
Finance
- Other: Community features include boat facilities and proximity to hotel/motel; condo-hotel community
- Financial info: Community of 32 units; Pet policy: pets allowed with conditions (maximum 1 pet, up to 30 lbs)
- HOA & community: Monthly association fee ($750) that includes insurance, irrigation water, grounds maintenance, pest control, recreation facilities and trash; Association amenities: pool, bike storage, RV/boat storage, shuffleboard court, storage, trails, management
Exterior
- Parking: Assigned parking; Covered parking (1 covered space); Detached carport (1 space); Driveway; Guest parking; Paved and unpaved surfaces
- Security: Smoke detector(s)
- Utilities: Public water; Private sewer; Cable available; High-speed internet available
- Home design: 2-story property; Entry level: 2; Resale property; Faces West; East exposure; Waterfront with canal access, intersecting canal, mangrove and seawall
- Construction: Block, concrete and stucco construction; Shingle roof; Zero lot line
- Exterior features: Security/high-impact doors; Sprinkler/irrigation system (automatic); Storage; Lanai; Porch; Screened porch/lanai; Smoke detectors
Interior
- Kitchen: Electric cooktop; Self-cleaning oven; Microwave; Refrigerator; Freezer; Dishwasher
- Bedrooms: Guest quarters
- Flooring: Tile
- Bathrooms: 2 full bathrooms
- Heating & cooling: Central heating (electric); Central air conditioning (electric); Ceiling fans
- Interior features: Impact glass windows; Cathedral and vaulted ceilings; High ceilings; Living/dining room; Pantry; Split bedroom layout; Separate shower (shower only); Cable TV; Furnished
- Laundry & utility: Washer and dryer inside
Neighborhood map
What this means for you Summary
Snapshot
- This is a 2-bed/2.0-bath condo listed at $300k.
Deal economics
- At list price, monthly cash flow is $657 ($8k/yr) — positive.
- The deal already cash-flows at list — no discount required.
- Meets the 1% rule at list price ($5k rent vs $300k).
- Recommended offer: $264k (12.0% below list) — sets the bar for market timing.
- Cap rate 10.6% vs local median 4.9% in St. James City — top-decile yield for the area; either an underpriced asset or a hidden risk that comps aren't pricing in. Stress-test before assuming the spread holds.
Location & tenants
- Location reads: area grade B — affects rentability + tenant quality, not the cash-flow math above.
- Lee (suburban): math 47% / reading 50% proficiency, ranked #42 of 73 in FL (top 58%) — families likely to look elsewhere, expect single-tenant / working-renter base with shorter leases.
- Market conditions: 287 active listings in the ZIP; 5 comparable units currently listed for rent nearby; rentals at typical pace (median 24d on market — plan ~3-4 weeks tenant-placement turnaround); 15,411 units permitted in Lee County in 2024 (4,686 in 5+ unit buildings).
Forward outlook
- Local home prices are declining (-3.0%/yr); year-one equity from $2k of loan paydown is wiped out by about $9k of value loss. Plan a longer hold.
- Lee County population projected at +44% by 2050 — long-run rental-demand tailwind backs the buy-and-hold thesis.
Negotiation context
- It's been on market 878 days — a 12% lower offer ($264k) is reasonable based on typical stale-listing flexibility.
- 2 sale attempts since 26y ago; this cycle's ask has dropped $100k (25%) from the opening price — seller is motivated, your offer sets the floor, not the list.
Risks & watch-outs
- Watch-outs: flood insurance adds $427/mo.
- Climate carrying-cost: in FEMA flood zone AE (mandatory federal flood insurance); severe wind risk, 99% chance of damaging wind over 30y; extreme-heat days projected 7→28/yr by 2055 (HVAC capex compounding) — expect insurance premiums to compound above CPI over the hold.
Questions for the listing agent
- It's been on market 878 days. Have you received any prior offers? Is the seller open to a 12% concession, seller financing, or rate buy-down credit?
- What's the actual annual flood-insurance premium (NFIP or private), and is the property in a SFHA with mandatory coverage?
- What does the HOA fee cover, when was the last increase, and are there any pending special assessments or reserve-fund shortfalls?
- Any open or pending special assessments — roof, HVAC, plumbing, elevator, façade? What's the per-unit balance and payoff schedule, and is the seller paying it off at close or rolling it to the buyer?
- Why hasn't it sold? Are there any deal-killer items the seller is aware of (foundation, flood, title, zoning, code violations)?
- Is there a deadline driving the sale (1031 exchange, divorce, estate, relocation)? That informs how much negotiation room exists.
- This sits on a lake — are riparian / water-frontage rights deeded with the parcel? Any dock permits, shoreline easements, or HOA water-use restrictions?
- What's the documented flood / surge / shoreline-erosion history here (FEMA AND non-FEMA — e.g., storm surge, creek backup, septic-field saturation)?
- Any water-quality or seasonal algae-bloom issues that affect tenant satisfaction or short-term-rental demand?
- What's the average days-on-market for RENTAL listings here right now (not sales)? A rising rental-DOM trend means longer vacancies and softer asking-rent achievability than the comps imply.
- What's the recent tenant-quality profile in this submarket — average credit score on applications, eviction rate, late-payment / NSF rate, and stable-employment percentage? A property-management company in the area should have these aggregated.
- How much new apartment / multifamily construction is in the pipeline within 1–3 miles? Heavy new supply (>2% of stock underway) typically softens rents 12–24 months out; light construction supports rent growth.
Investment metrics
- 1% rule
- 1.63% ✓
- Cap rate
- 10.63%
- Cash-on-cash
- 15.49%
- DSCR
- 1.69
- GRM
- 5.1
CMA / ARV
No comps found within radius.
Projected returns pro-forma
-3.0% appreciation · 3.0% rent growth · sell at horizon
- IRR
- -1.9%
- Equity multiple
- 0.93×
- Total profit
- $-5,965
- Equity at exit
- $44,716
- IRR
- 8.0%
- Equity multiple
- 1.62×
- Total profit
- $51,829
- Equity at exit
- $25,930
Cash invested: $83,972 (down + closing). Projections, not guarantees.
Landlord ↔ Tenant lean methodology
- Overall (STATE)
- 87 Strongly Landlord-Friendly
- State Florida
- 87 Strongly Landlord-Friendly · R+3
- County
- — inherits STATE
- City
- — inherits STATE
ZIP-level market 33956
- Home prices YoY
- -16.3%
- Active inventory
- 287
- Price-to-rent
- 5.1×
Monthly cashflow live
- Estimated rent
- $4,884 medium interval (Pro) →
- Mortgage (P&I)
- −$1,573
- Tax from tax record
- −$326 /mo · $3,917/yr
- Insurance
- −$125
- Flood insurance flood zone
- −$427 /mo · $5,118/yr
- HOA
- −$750
- Vacancy / Maint / Mgmt
- −$1,026
- Net cashflow
- $657
Break-even live
Sensitivity live
| Price | -10% $827 | -5% $742 | +0% $657 | +5% $572 | +10% $488 |
|---|---|---|---|---|---|
| Rent | -10% $272 | -5% $464 | +0% $657 | +5% $850 | +10% $1,043 |
| Rate | -1.0pp $808 | -0.5pp $734 | base $657 | +0.5pp $580 | +1.0pp $501 |
UW: 25.0% down · 7.5% · 30yr · 1.5% tax · 5.0% vac · 8.0% maint · 8.0% mgmt
Financing live
Cash to close
- Down payment
- $74,975
- Closing costs
- $8,997
- Reserves months
- —
- Total cash needed
- —
Loan-product check · same deal, 3 products live
Conventional
25% down · 7.5% · 30yr
- Down + closing
- —
- Monthly P&I
- —
- Monthly cashflow
- —
- DSCR
- —
- Eligible?
- —
Personal DTI + credit; lowest rate.
DSCR
20% down · 8.5% · 30yr
- Down + closing
- —
- Monthly P&I
- —
- Monthly cashflow
- —
- DSCR
- —
- Eligible?
- —
No personal income docs; deal must DSCR.
Hard money
10% down · 12.0% · 12mo
- Down + closing
- —
- Monthly P&I
- —
- Monthly cashflow
- —
- DSCR
- —
- Eligible?
- —
Short-term bridge; refi at stabilization.
Rent comps 5 comps
| Address | Beds | Baths | Sqft | Rent | $/sqft | DOM | Units | Dist |
|---|---|---|---|---|---|---|---|---|
| 2951 York Rd Saint James City, FL | 2.0 | 2.0 | 1444 | $5,500 | $3.81 | 24d | 1 | 0.13mi |
| 3103 Harpoon Ln Saint James City, FL | 2.0 | 2.0 | 1094 | $3,000 | $2.74 | 24d | 1 | 0.38mi |
| 2744 Sanderling Ct Saint James City, FL | 2.0 | 1.0 | 841 | $5,300 | $6.30 | 24d | 1 | 0.41mi |
| 3864 Royal Palm Dr Saint James City, FL | 2.0 | 1.0 | 960 | $1,650 | $1.72 | 24d | 1 | 0.46mi |
| 3811 Emerald Ave Saint James City, FL | 3.0 | 2.5 | 1500 | $5,500 | $3.67 | 24d | 1 | 0.72mi |
HOA detail condo
- Monthly dues
- $750 · $9,000/yr
- Assessments
- None detected in remarks — confirm with the listing agent.
Listing history 20 events
-
2026-06-17days on market $299,900 Active 878 DOM
-
2026-06-16days on market $299,900 Active 877 DOM
-
2026-06-16days on market $299,900 Active 876 DOM
-
2026-06-13days on market $299,900 Active 874 DOM
-
2026-06-09days on market $299,900 Active 870 DOM
-
2026-06-07days on market $299,900 Active 868 DOM
-
2026-06-01days on market $299,900 Active 862 DOM
-
2026-06-01days on market $299,900 Active 861 DOM
-
2025-04-24price $299,900
-
2025-01-17price $329,900
-
2024-07-12price $399,900
-
2024-03-13price $360,900
-
2024-01-21$399,900 Active
-
2007-05-03soldstatus $290,000
-
2007-04-30soldstatus $290,000 430-char remark
Show marketing remark (430 chars)
This should be your new home or vacation home! Beautiful 2nd floor condo - everything has been done. All new kitchen- appliances, cabinets, 2- new tile bathrooms, + tile floors! Pine Island has some of the best restaurants, entertainment, boating and fishing, biking and hiking trails. Just think you could be sitting on your screened lanai-looking at your boat all while enjoying some of the most beautiful subtropical landscape.
-
2007-03-07price $305,000 430-char remark
Show marketing remark (430 chars)
This should be your new home or vacation home! Beautiful 2nd floor condo - everything has been done. All new kitchen- appliances, cabinets, 2- new tile bathrooms, + tile floors! Pine Island has some of the best restaurants, entertainment, boating and fishing, biking and hiking trails. Just think you could be sitting on your screened lanai-looking at your boat all while enjoying some of the most beautiful subtropical landscape.
-
2001-03-29soldstatus $102,000
-
2000-05-19historical
-
2000-01-09$106,900
-
1984-10-01soldstatus $53,000
ⓘ Source: listings_history table (triggers on properties + properties_extension) + one-shot
backfill from property_details.listing_events for pre-trigger history.
Tax reassessment forecast FL · Resets to sale price
- Current annual tax
- $3,917 · $326/mo
- Projected year-2 tax
- $3,917 · $326/mo
- Expected delta
- $0/yr ($0/mo · 0.0%)
ⓘ Screening estimate from a state-policy table — verify with the county assessor before closing.
Climate risk First Street
- Flood 9/10 Extreme FEMA zone AE · 99% chance over 30 yrs
- Wildfire 3/10 Moderate
- Heat 10/10 Extreme 7 d/yr ≥107°F today · 28 d/yr by 30 yrs out
- Wind 10/10 Extreme 99% chance of damaging wind over 30 yrs
- Air quality 2/10 Low 1 unhealthy d/yr today · 2 by 30 yrs out
Nearby sold comps map
Loading sold comps map…
Walkable amenities ~0.75 mi
Loading nearby amenities…
Taxation est. · year 1
- Rental income
- $58,602
- − Mortgage interest
- −$16,799
- − Property taxes
- −$3,917
- − Insurance
- −$6,618
- − Repairs & maintenance
- −$4,688
- − Management
- −$4,688
- − HOA
- −$9,000
- − Depreciation
- −$8,724
- Taxable income
- $4,167
- Est. tax owed @ 24.0%
- −$1,000
- After-tax cash flow
- $6,888/yr
For passive investors: Depreciation is non-cash, so a rental often shows a tax loss while cash-flowing — sheltering income. Rental losses are passive: they offset passive income freely, and up to $25,000/yr can offset ordinary (W-2) income if you actively participate and your MAGI is under $100k (phasing out to $0 by $150k); unused losses carry forward. On sale, claimed depreciation is recaptured at up to 25%, and gains may owe capital-gains tax (a 1031 exchange can defer both). Figures are a year-1 estimate at your 24.0% rate — not tax advice; consult a CPA.
Schools (NCES district)
- District
- Lee
- NCES district ID
- 1201080
- Math proficiency
- 47% ▼ -11.00%
- Reading proficiency
- 50% ▼ -4.00%
- Median HH income
- $49,518
- Composite
- 41.49/100
- National rank
- #3458
- State rank
- #42 of 73 in FL
Livability — St. James City
No livability data for this city. (Only ~50 U.S. cities are tracked.)
Census & demographics
- Census place
- St. James City, FL
- Population (ZIP)
- 3,846
Population outlook (Lee County) Hauer SSP2
- Today (2025)
- 871,946 people
- By 2030
- 955,468 · +9.6%
- By 2040
- 1,113,587 · +27.7%
- By 2050
- 1,256,891 · +44.1%
- By 2075
- 1,560,270 · +78.9%
- By 2100
- 1,726,848 · +98.0%
Race, ethnicity, and origin ACS 2023
- Neighborhood character
- Predominantly White (94%)
- Race & ethnicity
- White 94% Two or more races 3% Pacific Islander 2% Hispanic / Latino 1%
- Common ancestry
- Romanian 6% Slovak 4% Iranian 3%
- Foreign-born
- 5% · Canada
- Languages at home
- 95% English-only · French/Haitian/Cajun 2% German/W. Germanic 2% Russian/Polish/Slavic 1%
Political lean MEDSL · Lee
- 2024 margin
- Strong R (+28.4) · D 35.5% · R 63.9%
- 2008→2024 swing
- -18.0pp toward R · 2008: -10.4pp · 2024: -28.4pp
- All cycles
- 2024: R+28.4 2020: R+19.2 2016: R+20.4 2012: R+16.6 2008: R+10.4
Not yet ingested
- Civics
- —
Market trends
- HPI YoY
- ▼ -58.47%
- Current HPI
- 300.1416
- Rent YoY
- —
- Metro
- —
- State GDP YoY
- ▲ 3.28%
- F500 in state
- 36
Industry mix (Fortune 500 HQ in FL)
| Industry | F500 HQs | Revenue |
|---|---|---|
| Industrial Technology | 2 | $29B |
|
||
| Insurance | 2 | $17B |
|
||
| Retail | 1 | $60B |
|
||
| Technology Distribution | 1 | $58B |
|
||
| Homebuilding | 1 | $35B |
|
||
| Technology Manufacturing | 1 | $35B |
|
||
Price history
+465.8% since first listed12 events — show timeline
- 2025-04-24 Price Changed $299,900 FORTMLS
- 2025-01-17 Price Changed $329,900 FORTMLS
- 2024-07-12 Price Changed $399,900 FORTMLS
- 2024-03-13 Price Changed $360,900 FORTMLS
- 2024-01-21 Listed $399,900 FORTMLS
- 2007-05-03 Sold (Public Records) $290,000 Public Records
- 2007-04-30 Sold (MLS) $290,000 FORTMLS
- 2007-03-07 Price Changed $305,000 FORTMLS
- 2001-03-29 Sold (Public Records) $102,000 Public Records
- 2000-05-19 Listing Removed — FORTMLS
- 2000-01-09 Listed $106,900 FORTMLS
- 1984-10-01 Sold (Public Records) $53,000 Public Records
Property tax history
+6.6%/yrLatest (2025): $3,917 · +13.0% YoY. Source: county tax records.
Cash-flow waterfall
monthlySold comps — $/sqft
last 12 mo · ≤1 miLoading sold comps…