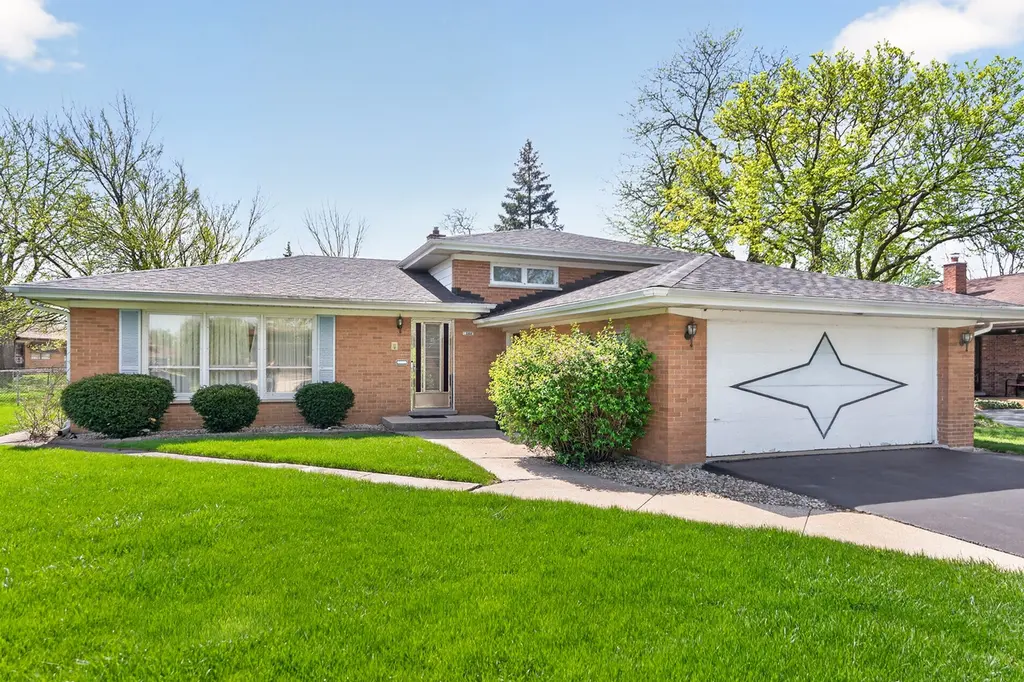
549 E 168th St · South Holland, IL
Flood risk 1/10 · Minimal
- FEMA flood zone
- X (unshaded)
- Chance of flooding over 30 yrs
- 0.0%
- Est. flood insurance / yr
- $507 – $1,088
Fire risk 3/10 · Minor
- Est. fire insurance / yr
- $804 – $1,492
Heat risk 3/10 · Minor
- Hot days now (above 102°F)
- 7 days/yr
- Hot days in 30 yrs
- 15 days/yr
Wind risk 2/10 · Minimal
- Chance of severe wind over 30 yrs
- —
Air-quality risk 4/10 · Minor
- Unhealthy air days now
- 4 days/yr
- Unhealthy air days in 30 yrs
- 5 days/yr
Risk factors via First Street. Map © Google.
Why this score? — see what drove the C+ grade
The composite is a weighted blend of 9 inputs, each scored 0–100. Each bar is that input's sub-score; the figure is the points it added to the 100-point composite (weight × sub-score).
- Cash flow +26.0/30.0
- DSCR +8.8/10.0
- 1% rule +8.4/10.0
- ARV discount +7.4/15.0
- Livability +3.9/5.0
- Rent growth +2.5/5.0
- Condition / age +2.5/5.0
- Schools +0.7/10.0
- Appreciation +0.0/10.0
$225,000
🖨 Deal sheet 📄 Offer letter ✓ Due diligence
Listing remarks
THIS IS AN ESTATE SALE! Great starter home needs a little TLC! This split-level offers a spacious open floor plan, 3 bedrooms, 1.1 bathrooms, large kitchen with an eat-in table space and a full basement partially finished w/ an additional separate standing shower stall perfect for adding a 2nd full bathroom. All this plus expansive backyard with a chain link fence surrounding perimeter, concrete patio, roof 5 years old & 2 car garage! Great location, minutes from the South Holland Public Library, close to interstate highway, close to shopping, restaurants, parks and schools! Come see it today!
Key facts
- Large kitchen
- Full basement
- Concrete patio
Tags
Property features AI
Finance
- Other: Directions: South on Cottage Grove Ave, east on to 166th, south to School St., east to 168th St. to property.
- HOA & community: No master association fee required
Exterior
- Parking: Attached garage on concrete surface with space for 2 vehicles (2 total parking spaces)
- Utilities: Public water; Public sewer; Electric with circuit breakers
- Home design: Detached single-family, split-level home; Built 61–70 years ago; Fee simple ownership; Asphalt roof; Brick construction; Built before 1978
- Construction: Brick exterior; Asphalt roof
- Exterior features: Lot approximately 50 x 125 (less than 0.25 acre)
Interior
- Kitchen: Kitchen on main level with tile flooring (approx. 12 x 11)
- Bedrooms: Three bedrooms (Master and one bedroom on second level; one bedroom on main level); Bedroom sizes include 13 x 11 (master), 13 x 10, and 11 x 10
- Flooring: Hardwood in bedrooms; Carpet in living and dining rooms; Tile in kitchen and basement laundry
- Bathrooms: One full bath; One half bath
- Heating & cooling: Natural gas heating; Central air conditioning
- Interior features: Six total rooms; Partially finished full basement; School bus service
- Laundry & utility: Basement laundry area (approx. 16 x 13) with gas dryer hookup
Neighborhood map
What this means for you Summary
Snapshot
- This is a 3-bed/1.5-bath single-family listed at $225k.
Deal economics
- At list price, monthly cash flow is $562 ($7k/yr) — positive.
- The deal already cash-flows at list — no discount required.
- Meets the 1% rule at list price ($3k rent vs $225k).
- Recommended offer: $218k (3.0% below list) — sets the bar for market timing.
Location & tenants
- Location reads 77/100 on livability (#167 in IL, #3,071 nationally) — a middle-class / working-renter tenant base. Strengths: commute A+, housing A+, cost of living A; Watch: crime C-, amenities C-, schools D+.
- Thornton Twp Hsd 205 (suburban): math 7% / reading 8% proficiency, ranked #594 of 620 in IL (top 96%) — low school quality limits family demand, transient renter base, plan for 1-2y turnover.
- Market conditions: 135 active listings in the ZIP; 3 comparable units currently listed for rent nearby; rentals leasing fast (median 2d on market — plan ~1-2 weeks tenant-placement turnaround); 6,272 units permitted in Cook County in 2024 (4,658 in 5+ unit buildings).
Forward outlook
- Local home prices are declining (-3.0%/yr); year-one equity from $2k of loan paydown is wiped out by about $7k of value loss. Plan a longer hold.
- At projected returns (-3.0% appreciation + 3.0% rent growth), your $63k cash investment doubles in ~10 years — after that, you're playing with house money.
Negotiation context
- It's been on market 49 days — a 3% lower offer ($218k) is reasonable based on typical stale-listing flexibility.
- Current owner paid $100k; list at $225k implies a 125% gain — meaningful room to come down on a strong offer.
Risks & watch-outs
- Watch-outs: property tax is 2.9% of price.
Questions for the listing agent
- It's been on market 49 days. Have you received any prior offers? Is the seller open to a 3% concession, seller financing, or rate buy-down credit?
- Built in 1963 — when were the roof, HVAC, electrical panel, plumbing, and water heater last replaced?
- Property tax is high relative to price — has the assessment been appealed recently, and will the sale trigger a re-assessment?
- Is there a deadline driving the sale (1031 exchange, divorce, estate, relocation)? That informs how much negotiation room exists.
- Schools are D-rated, which usually means shorter tenancies and higher turnover. Who's the typical renter profile here, and what's been the actual vacancy rate?
- What's the average days-on-market for RENTAL listings here right now (not sales)? A rising rental-DOM trend means longer vacancies and softer asking-rent achievability than the comps imply.
- What's the recent tenant-quality profile in this submarket — average credit score on applications, eviction rate, late-payment / NSF rate, and stable-employment percentage? A property-management company in the area should have these aggregated.
- How much new for-sale + rental construction is in the pipeline within 1–3 miles? Heavy new supply typically softens prices + rents 12–24 months out; constrained supply supports both.
Investment metrics
- 1% rule
- 1.34% ✓
- Cap rate
- 9.29%
- Cash-on-cash
- 10.71%
- DSCR
- 1.48
- GRM
- 6.2
CMA / ARV
- ARV (on-the-fly)
- $224,448
- Comps found
- 12
Show comp detail 12 sales within ~0.75 mi
| Address | Dist | Beds/Ba | Sqft | Sold | Price | $/sf | Match |
|---|---|---|---|---|---|---|---|
| 16927 Langley Ave | 0.21mi | 3/1.5 | 1,288 (-4%) | 1mo | $179,900 | $140 | 82 |
| 459 E 166th St | 0.25mi | 4/2.0 (+1) | 1,300 (-3%) | 1mo | $235,000 | $181 | 75 |
| 16712 Elm St | 0.21mi | 3/2.0 | 1,446 (+8%) | 2mo | $191,000 | $132 | 74 |
| 16728 School St | 0.08mi | 3/1.5 | 1,170 (-13%) | 2mo | $196,000 | $168 | 73 |
| 16549 Cottage Grove Ave | 0.39mi | 3/2.0 | 1,426 (+6%) | 2mo | $219,500 | $154 | 68 |
| 702 E 162nd Pl | 0.70mi | 3/2.0 | 1,400 (+4%) | 1mo | $230,000 | $164 | 57 |
| 16417 Claire Ln | 0.44mi | 3/2.5 | 1,209 (-10%) | 2mo | $254,995 | $211 | 57 |
| 17140 Evans Dr | 0.54mi | 3/2.0 | 1,206 (-10%) | 2mo | $245,000 | $203 | 54 |
| 17121 Ingleside Ave | 0.61mi | 3/2.0 | 1,215 (-10%) | 0mo | $225,000 | $185 | 54 |
| 16535 S Elm Ct | 0.33mi | 4/2.0 (+1) | 1,540 (+15%) | 1mo | $235,000 | $153 | 52 |
| 823 E 163rd St | 0.68mi | 3/1.0 | 1,184 (-12%) | 1mo | $197,500 | $167 | 45 |
| 17032 University Ave | 0.75mi | 3/2.0 | 1,500 (+12%) | 2mo | $242,000 | $161 | 42 |
Match score weights: distance 35% · size 25% · config 20% · recency 20%. Top-matched comps best support the ARV.
Projected returns pro-forma
-3.0% appreciation · 3.0% rent growth · sell at horizon
- IRR
- -0.2%
- Equity multiple
- 0.99×
- Total profit
- $-454
- Equity at exit
- $33,548
- IRR
- 9.5%
- Equity multiple
- 1.74×
- Total profit
- $46,530
- Equity at exit
- $19,454
Cash invested: $63,000 (down + closing). Projections, not guarantees.
Landlord ↔ Tenant lean methodology
- Overall (STATE)
- 43 Moderately Tenant-Leaning
- State Illinois
- 43 Moderately Tenant-Leaning · D+7
- County
- — inherits STATE
- City
- — inherits STATE
ZIP-level market 60473
- Active inventory
- 135
- Price-to-rent
- 6.2×
Monthly cashflow live
- Estimated rent
- $3,004 medium interval (Pro) →
- Mortgage (P&I)
- −$1,180
- Tax from tax record
- −$538 /mo · $6,452/yr
- Insurance
- −$94
- HOA
- −$0
- Vacancy / Maint / Mgmt
- −$631
- Net cashflow
- $562
Break-even live
UW: 25.0% down · 7.5% · 30yr · 1.5% tax · 5.0% vac · 8.0% maint · 8.0% mgmt
Financing live
Cash to close
- Down payment
- $56,250
- Closing costs
- $6,750
- Reserves months
- —
- Total cash needed
- —
Loan-product check · same deal, 3 products live
Conventional
25% down · 7.5% · 30yr
- Down + closing
- —
- Monthly P&I
- —
- Monthly cashflow
- —
- DSCR
- —
- Eligible?
- —
Personal DTI + credit; lowest rate.
DSCR
20% down · 8.5% · 30yr
- Down + closing
- —
- Monthly P&I
- —
- Monthly cashflow
- —
- DSCR
- —
- Eligible?
- —
No personal income docs; deal must DSCR.
Hard money
10% down · 12.0% · 12mo
- Down + closing
- —
- Monthly P&I
- —
- Monthly cashflow
- —
- DSCR
- —
- Eligible?
- —
Short-term bridge; refi at stabilization.
Rent comps 3 comps
| Address | Beds | Baths | Sqft | Rent | $/sqft | DOM | Units | Dist |
|---|---|---|---|---|---|---|---|---|
| 16246 Dobson Ave South Holland, IL | 3.0 | 2.0 | 1250 | $3,170 | $2.54 | 1d | 1 | 0.86mi |
| 16001 Avalon Ave South Holland, IL | 3.0 | 2.0 | 1136 | $3,330 | $2.93 | 6d | 1 | 1.30mi |
| 208 Blackstone St Thornton, IL | 2.0 | 1.5 | 923 | $2,200 | $2.38 | 1d | 1 | 1.41mi |
Listing history 17 events
-
2026-06-18days on market $225,000 Active 49 DOM
-
2026-06-17days on market $225,000 Active 48 DOM
-
2026-06-16days on market $225,000 Active 47 DOM
-
2026-06-15days on market $225,000 Active 46 DOM
-
2026-06-13days on market $225,000 Active 44 DOM
-
2026-06-13statusdays on market $225,000 Active 43 DOM
-
2026-06-09days on market $225,000 Contingent - Continue to Show 40 DOM
-
2026-06-08days on market $225,000 Contingent - Continue to Show 39 DOM
-
2026-06-07days on market $225,000 Contingent - Continue to Show 38 DOM
-
2026-06-04days on market $225,000 Contingent - Continue to Show 35 DOM
-
2026-06-03days on market $225,000 Contingent - Continue to Show 34 DOM
-
2026-06-02days on market $225,000 Contingent - Continue to Show 33 DOM
-
2026-06-01days on market $225,000 Contingent - Continue to Show 32 DOM
-
2026-05-31days on market $225,000 Contingent - Continue to Show 31 DOM
-
2026-05-07historical Contingent - Continue to Show
-
2026-04-29$225,000 Active
-
1991-08-16soldstatus $100,000
ⓘ Source: listings_history table (triggers on properties + properties_extension) + one-shot
backfill from property_details.listing_events for pre-trigger history.
Tax reassessment forecast IL · Partial reset (capped growth)
- Current annual tax
- $6,452 · $538/mo
- Projected year-2 tax
- $6,452 · $538/mo
- Expected delta
- $0/yr ($0/mo · 0.0%)
ⓘ Screening estimate from a state-policy table — verify with the county assessor before closing.
Climate risk First Street
- Flood 1/10 Low FEMA zone X (unshaded) · 0% chance over 30 yrs
- Wildfire 3/10 Moderate
- Heat 3/10 Moderate 7 d/yr ≥102°F today · 15 d/yr by 30 yrs out
- Wind 2/10 Low
- Air quality 4/10 Moderate 4 unhealthy d/yr today · 5 by 30 yrs out
Nearby sold comps map
Loading sold comps map…
Walkable amenities ~0.75 mi
Loading nearby amenities…
Taxation est. · year 1
- Rental income
- $36,052
- − Mortgage interest
- −$12,603
- − Property taxes
- −$6,452
- − Insurance
- −$1,125
- − Repairs & maintenance
- −$2,884
- − Management
- −$2,884
- − Depreciation
- −$6,545
- Taxable income
- $3,558
- Est. tax owed @ 24.0%
- −$854
- After-tax cash flow
- $5,892/yr
For passive investors: Depreciation is non-cash, so a rental often shows a tax loss while cash-flowing — sheltering income. Rental losses are passive: they offset passive income freely, and up to $25,000/yr can offset ordinary (W-2) income if you actively participate and your MAGI is under $100k (phasing out to $0 by $150k); unused losses carry forward. On sale, claimed depreciation is recaptured at up to 25%, and gains may owe capital-gains tax (a 1031 exchange can defer both). Figures are a year-1 estimate at your 24.0% rate — not tax advice; consult a CPA.
Schools (NCES district)
- District
- Thornton Twp Hsd 205
- NCES district ID
- 1738970
- Math proficiency
- 7% ▬ 0.00%
- Reading proficiency
- 8% ▼ -2.00%
- Median HH income
- $43,392
- Composite
- 6.92/100
- National rank
- #9976
- State rank
- #594 of 620 in IL
Livability — South Holland
- Score
- 77/100
- State rank
- #167
- US rank
- #3071
Category grades
Schools grade is shown separately in the Schools card above.
Census & demographics
- Census place
- South Holland, IL
- City population
- 21,407
- Population (ZIP)
- 21,407
Population outlook (Cook County) Hauer SSP2
- Today (2025)
- 5,347,519 people
- By 2030
- 5,357,703 · +0.2%
- By 2040
- 5,324,924 · -0.4%
- By 2050
- 5,230,762 · -2.2%
- By 2075
- 4,785,735 · -10.5%
- By 2100
- 4,188,836 · -21.7%
Race, ethnicity, and origin ACS 2023
- Neighborhood character
- Predominantly Black (75%)
- Race & ethnicity
- Black 75% White 10% Hispanic / Latino 10% Two or more races 3% Asian 1%
- Hispanic origin (detail)
- Mexican 9% Puerto Rican 1%
- Common ancestry
- Iranian 3% Romanian 2%
- Foreign-born
- 6% · Canada, China
- Languages at home
- 87% English-only · Spanish 8% Other Asian/Pacific 1% Russian/Polish/Slavic 1%
Political lean MEDSL · Cook
- 2024 margin
- Solid D (+42.0) · D 70.4% · R 28.4% · Other 1.2%
- 2008→2024 swing
- -11.4pp toward R · 2008: 53.4pp · 2024: 42.0pp
- All cycles
- 2024: D+42.0 2020: D+50.3 2016: D+53.0 2012: D+49.4 2008: D+53.4
Not yet ingested
- Civics
- —
Market trends
- HPI YoY
- ▼ -114.36%
- Current HPI
- 201.2479
- Rent YoY
- —
- Metro
- —
- State GDP YoY
- ▲ 1.59%
- F500 in state
- 60
Industry mix (Fortune 500 HQ in IL)
| Industry | F500 HQs | Revenue |
|---|---|---|
| Insurance | 4 | $201B |
|
||
| Consumer Goods | 4 | $87B |
|
||
| Industrial Machinery | 3 | $64B |
|
||
| Healthcare | 2 | $55B |
|
||
| Retail / Pharmacy | 1 | $148B |
|
||
| Agriculture / Food | 1 | $86B |
|
||
Price history
+125.0% since first listed3 events — show timeline
- 2026-05-07 Contingent — MRED as Distributed by MLS Grid
- 2026-04-29 Listed $225,000 MRED as Distributed by MLS Grid
- 1991-08-16 Sold (Public Records) $100,000 Public Records
Property tax history
+5.2%/yrLatest (2023): $6,452 · +27.0% YoY. Source: county tax records.
Cash-flow waterfall
monthlySold comps — $/sqft
last 12 mo · ≤1 miLoading sold comps…