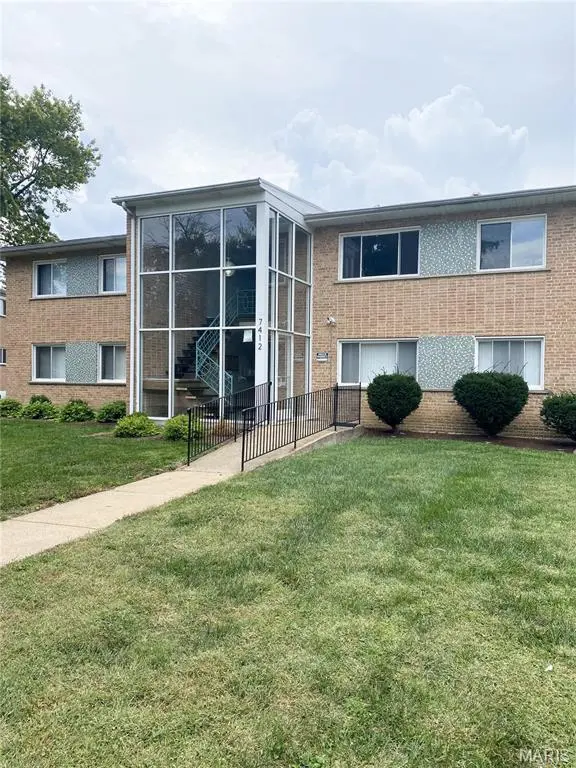
 20-Plex
7412-7418 Olian Dr · Hazelwood, MO
Flood risk 1/10 · Minimal
- FEMA flood zone
- X (unshaded)
- Chance of flooding over 30 yrs
- 0.0%
- Est. flood insurance / yr
- $507 – $1,088
Fire risk 1/10 · Minimal
- Est. fire insurance / yr
- $1,054 – $1,958
Heat risk 5/10 · Moderate
- Hot days now (above 106°F)
- 7 days/yr
- Hot days in 30 yrs
- 21 days/yr
Wind risk 2/10 · Minimal
- Chance of severe wind over 30 yrs
- 1.0%
Air-quality risk 2/10 · Minimal
- Unhealthy air days now
- 2 days/yr
- Unhealthy air days in 30 yrs
- 2 days/yr
Risk factors via First Street. Map © Google.
Why this score? — see what drove the B- grade
The composite is a weighted blend of 9 inputs, each scored 0–100. Each bar is that input's sub-score; the figure is the points it added to the 100-point composite (weight × sub-score).
- Cash flow +30.0/30.0
- 1% rule +10.0/10.0
- DSCR +10.0/10.0
- ARV discount +7.5/15.0
- Rent growth +3.6/5.0
- Livability +3.1/5.0
- Condition / age +2.5/5.0
- Schools +1.7/10.0
- Appreciation +0.0/10.0
$1,900,000
🖨 Deal sheet (PDF) 📄 Offer letter ✓ Due diligence
Multi-family units
County records classify this as Multi-Family (5+ Unit). Listing-text estimate: 20 units. confirmed
5+ unit building — per-unit beds/baths from public records are typically unavailable; the breakdown below (if shown) is an estimate from the listing text.
Listing remarks MLS
Stabilized Turn Key 20-Unit Multifamily Investment in Sought-After Hazelwood! Exceptional opportunity to own a stabilized 20-unit apartment building in the highly desirable Hazelwood School District. This well-performing property features a strong mix of 8 one-bedroom units and 12 two-bedroom units, offering both diversity and consistent tenant demand. Units are spacious and updated, with many featuring remodeled kitchens some with granite countertops, updated baths, hardwood or vinyl plank flooring, and stainless steel appliances in select units, mostly updated HVAC systems, water heaters and sewer line replacement. Tenants enjoy the convenience of ample off-street parking, plus access to coin-operated and tenant-owned laundry facilities located in the basements of the buildings. Positioned in a solid rental market with great access to highways, shopping, and major employment hubs, this property is ideal for investors looking for immediate cash flow with long-term growth potential. Tenants pay rent plus utility reimbursements monthly. Well-maintained & professionally managed. Don't miss this chance to add a strong, income-producing asset to your portfolio in one of the most desirable rental markets. PLEASE do not disturb tenants.
Key facts
- 5,662 sq ft lot
- Built 1959
- Listed 116 days
Neighborhood map
What this means for you Summary
Snapshot
- This is a 20 × 32-bed/20.0-bath units multifamily listed at $1.90M.
Deal economics
- At list price, monthly cash flow is $13k ($156k/yr) — positive. Per door: $649/mo.
- The deal already cash-flows at list — no discount required.
- Meets the 1% rule at list price ($33k rent vs $1.90M).
- Recommended offer: $1.73M (9.0% below list) — sets the bar for market timing.
- Cap rate 14.5% vs local median 7.3% in Hazelwood — top-decile yield for the area; either an underpriced asset or a hidden risk that comps aren't pricing in. Stress-test before assuming the spread holds.
Location & tenants
- Location reads 62/100 on livability (#395 in MO) — a middle-class / working-renter tenant base. Strengths: cost of living A+, housing A+; Watch: crime F, amenities F, commute F.
- Hazelwood (suburban): math 11% / reading 26% proficiency, ranked #306 of 324 in MO (top 94%) — low school quality limits family demand, transient renter base, plan for 1-2y turnover.
- Zoned schools: Mcnair Elem. (math 8% / reading 27%, grade F, #964 of 1,115 statewide, top 87%, 401 students, 66% FRL); Northwest Middle (math 18% / reading 26%, grade F, #332 of 391 statewide, top 86%, 767 students, 62% FRL); Hazelwood West High (math 16% / reading 42%, grade F, #407 of 521 statewide, top 78%, 2,042 students, 54% FRL).
- Market conditions: Rents rising fast (+4.5%/yr); 68 active listings in the ZIP; 920 units permitted in St. Louis County in 2024 (250 in 5+ unit buildings).
- At $33,051/mo this rent would consume 802% of the median local household income ($49k/yr) (locally 766% of renters already pay >50% of income on rent) — very limited rent-growth headroom before tenants either downsize or default.
Forward outlook
- Local home prices are declining (-3.0%/yr); year-one equity from $13k of loan paydown is wiped out by about $57k of value loss. Plan a longer hold.
- At projected returns (-3.0% appreciation + 4.5% rent growth), your $532k cash investment doubles in ~4 years — after that, you're playing with house money.
Negotiation context
- It's been on market 117 days — a 9% lower offer ($1.73M) is reasonable based on typical stale-listing flexibility.
- 4 sale attempts since 3y ago with the ask held roughly flat each time — persistent listings suggest the price (not the market) is what's stuck; bring a comps-based counter.
- Current owner paid $1.60M; 19% above their basis — modest negotiation headroom, anchor on the comps not their cost.
Risks & watch-outs
- Watch-outs: built in 1959 — expect roof / HVAC / electrical / plumbing capex.
- Climate carrying-cost: extreme-heat days projected 7→21/yr by 2055 (HVAC capex compounding) — expect insurance premiums to compound above CPI over the hold.
Questions for the listing agent
- It's been on market 117 days. Have you received any prior offers? Is the seller open to a 9% concession, seller financing, or rate buy-down credit?
- Can we see the unit-by-unit rent roll, current vacancy, and any below-market leases? What's the average tenancy length?
- What capital expenditures (roof, boiler, parking lot, exteriors) have been made in the last 5 years, and what's planned in the next 2?
- Built in 1959 — when were the roof, HVAC, electrical panel, plumbing, and water heater last replaced?
- Why hasn't it sold? Are there any deal-killer items the seller is aware of (foundation, flood, title, zoning, code violations)?
- Is there a deadline driving the sale (1031 exchange, divorce, estate, relocation)? That informs how much negotiation room exists.
- Schools are D-rated, which usually means shorter tenancies and higher turnover. Who's the typical renter profile here, and what's been the actual vacancy rate?
- Crime grade is F in this area — have there been break-ins, vandalism, or insurance claims at this property in the last 3 years? What carrier currently insures it and at what premium?
- What's the average days-on-market for RENTAL listings here right now (not sales)? A rising rental-DOM trend means longer vacancies and softer asking-rent achievability than the comps imply.
- What's the recent tenant-quality profile in this submarket — average credit score on applications, eviction rate, late-payment / NSF rate, and stable-employment percentage? A property-management company in the area should have these aggregated.
- How much new apartment / multifamily construction is in the pipeline within 1–3 miles? Heavy new supply (>2% of stock underway) typically softens rents 12–24 months out; light construction supports rent growth.
Investment metrics
- 1% rule
- 1.74% ✓
- Cap rate
- 14.49%
- Cash-on-cash
- 29.28%
- DSCR
- 2.30
- GRM
- 4.8
CMA / ARV
No comps found within radius.
Projected returns pro-forma
-3.0% appreciation · 4.45% rent growth · sell at horizon
- IRR
- 25.4%
- Equity multiple
- 2.07×
- Total profit
- $568,222
- Equity at exit
- $283,296
- IRR
- 34.0%
- Equity multiple
- 4.32×
- Total profit
- $1,768,065
- Equity at exit
- $164,277
Cash invested: $532,000 (down + closing). Projections, not guarantees.
Landlord ↔ Tenant lean methodology
- Overall (STATE)
- 81 Strongly Landlord-Friendly
- State Missouri
- 81 Strongly Landlord-Friendly · R+10
- County
- — inherits STATE
- City
- — inherits STATE
ZIP-level market 63042
- Rents YoY
- 4.5%
- Active inventory
- 68
- Price-to-rent
- 95.8×
Monthly cashflow live
- Estimated rent
- $33,051 medium interval (Pro) →
- Mortgage (P&I)
- −$9,964
- Tax est. 1.5%
- −$2,375 /mo · $28,500/yr
- Insurance
- −$792
- HOA
- −$0
- Vacancy / Maint / Mgmt
- −$6,941
- Net cashflow
- $12,980
Break-even live
Sensitivity live
| Price | -10% $14,293 | -5% $13,636 | +0% $12,980 | +5% $12,323 | +10% $11,667 |
|---|---|---|---|---|---|
| Rent | -10% $10,369 | -5% $11,674 | +0% $12,980 | +5% $14,285 | +10% $15,591 |
| Rate | -1.0pp $13,937 | -0.5pp $13,463 | base $12,980 | +0.5pp $12,487 | +1.0pp $11,987 |
20-unit breakdown (identical units grouped — click to expand)
| Units | Beds | Baths | Est. rent |
|---|---|---|---|
| 20× units | 32 | 20 | $33,060 |
| #1 | 32 | 20 | $1,653 |
| #2 | 32 | 20 | $1,653 |
| #3 | 32 | 20 | $1,653 |
| #4 | 32 | 20 | $1,653 |
| #5 | 32 | 20 | $1,653 |
| #6 | 32 | 20 | $1,653 |
| #7 | 32 | 20 | $1,653 |
| #8 | 32 | 20 | $1,653 |
| #9 | 32 | 20 | $1,653 |
| #10 | 32 | 20 | $1,653 |
| #11 | 32 | 20 | $1,653 |
| #12 | 32 | 20 | $1,653 |
| #13 | 32 | 20 | $1,653 |
| #14 | 32 | 20 | $1,653 |
| #15 | 32 | 20 | $1,653 |
| #16 | 32 | 20 | $1,653 |
| #17 | 32 | 20 | $1,653 |
| #18 | 32 | 20 | $1,653 |
| #19 | 32 | 20 | $1,653 |
| #20 | 32 | 20 | $1,653 |
| Total (20 units) | $33,051 | ||
UW: 25.0% down · 7.5% · 30yr · 1.5% tax · 5.0% vac · 8.0% maint · 8.0% mgmt
Financing live
Cash to close
- Down payment
- $475,000
- Closing costs
- $57,000
- Reserves months
- —
- Total cash needed
- —
Loan-product check · same deal, 3 products live
Conventional
25% down · 7.5% · 30yr
- Down + closing
- —
- Monthly P&I
- —
- Monthly cashflow
- —
- DSCR
- —
- Eligible?
- —
Personal DTI + credit; lowest rate.
DSCR
20% down · 8.5% · 30yr
- Down + closing
- —
- Monthly P&I
- —
- Monthly cashflow
- —
- DSCR
- —
- Eligible?
- —
No personal income docs; deal must DSCR.
Hard money
10% down · 12.0% · 12mo
- Down + closing
- —
- Monthly P&I
- —
- Monthly cashflow
- —
- DSCR
- —
- Eligible?
- —
Short-term bridge; refi at stabilization.
Listing history 31 events
-
2026-06-21days on market $1,900,000 Active 117 DOM
-
2026-06-18days on market $1,900,000 Active 114 DOM
-
2026-06-17days on market $1,900,000 Active 113 DOM
-
2026-06-16days on market $1,900,000 Active 112 DOM
-
2026-06-15days on market $1,900,000 Active 111 DOM
-
2026-06-13days on market $1,900,000 Active 109 DOM
-
2026-06-13days on market $1,900,000 Active 108 DOM
-
2026-06-09days on market $1,900,000 Active 105 DOM
-
2026-06-08days on market $1,900,000 Active 104 DOM
-
2026-06-07days on market $1,900,000 Active 103 DOM
-
2026-06-05days on market $1,900,000 Active 100 DOM
-
2026-06-03days on market $1,900,000 Active 99 DOM
-
2026-06-02days on market $1,900,000 Active 98 DOM
-
2026-06-01days on market $1,900,000 Active 97 DOM
-
2026-05-31days on market $1,900,000 Active 96 DOM
-
2026-02-25$1,900,000 Active 1255-char remark
Show marketing remark (1255 chars)
Stabilized Turn Key 20-Unit Multifamily Investment in Sought-After Hazelwood! Exceptional opportunity to own a stabilized 20-unit apartment building in the highly desirable Hazelwood School District. This well-performing property features a strong mix of 8 one-bedroom units and 12 two-bedroom units, offering both diversity and consistent tenant demand. Units are spacious and updated, with many featuring remodeled kitchens some with granite countertops, updated baths, hardwood or vinyl plank flooring, and stainless steel appliances in select units, mostly updated HVAC systems, water heaters and sewer line replacement. Tenants enjoy the convenience of ample off-street parking, plus access to coin-operated and tenant-owned laundry facilities located in the basements of the buildings. Positioned in a solid rental market with great access to highways, shopping, and major employment hubs, this property is ideal for investors looking for immediate cash flow with long-term growth potential. Tenants pay rent plus utility reimbursements monthly. Well-maintained & professionally managed. Don't miss this chance to add a strong, income-producing asset to your portfolio in one of the most desirable rental markets. PLEASE do not disturb tenants.
-
2026-02-24historical $1,900,000 1255-char remark
Show marketing remark (1255 chars)
Stabilized Turn Key 20-Unit Multifamily Investment in Sought-After Hazelwood! Exceptional opportunity to own a stabilized 20-unit apartment building in the highly desirable Hazelwood School District. This well-performing property features a strong mix of 8 one-bedroom units and 12 two-bedroom units, offering both diversity and consistent tenant demand. Units are spacious and updated, with many featuring remodeled kitchens some with granite countertops, updated baths, hardwood or vinyl plank flooring, and stainless steel appliances in select units, mostly updated HVAC systems, water heaters and sewer line replacement. Tenants enjoy the convenience of ample off-street parking, plus access to coin-operated and tenant-owned laundry facilities located in the basements of the buildings. Positioned in a solid rental market with great access to highways, shopping, and major employment hubs, this property is ideal for investors looking for immediate cash flow with long-term growth potential. Tenants pay rent plus utility reimbursements monthly. Well-maintained & professionally managed. Don't miss this chance to add a strong, income-producing asset to your portfolio in one of the most desirable rental markets. PLEASE do not disturb tenants.
-
2025-06-17$1,950,000 Active
-
2024-05-10historical $950
-
2024-05-07$950
-
2023-10-08historical $900
-
2023-09-03$900
-
2022-06-18price $900
-
2021-10-12soldstatus $1,600,000
-
2021-04-21soldstatus $1,172,000
-
2013-10-21soldstatus $855,000
-
2012-06-01soldstatus $525,000
-
2010-06-11soldstatus $550,000
-
2010-02-19soldstatus $485,000
-
2004-10-01soldstatus $1,075,000
-
2003-05-22soldstatus $975,000
ⓘ Source: listings_history table (triggers on properties + properties_extension) + one-shot
backfill from property_details.listing_events for pre-trigger history.
Climate risk First Street
- Flood 1/10 Low FEMA zone X (unshaded) · 0% chance over 30 yrs
- Wildfire 1/10 Low
- Heat 5/10 Major 7 d/yr ≥106°F today · 21 d/yr by 30 yrs out
- Wind 2/10 Low 100% chance of damaging wind over 30 yrs
- Air quality 2/10 Low 2 unhealthy d/yr today · 2 by 30 yrs out
Nearby sold comps map
Loading sold comps map…
Walkable amenities ~0.75 mi
Loading nearby amenities…
Taxation est. · year 1
- Rental income
- $396,612
- − Mortgage interest
- −$106,430
- − Property taxes
- −$28,500
- − Insurance
- −$9,500
- − Repairs & maintenance
- −$31,729
- − Management
- −$31,729
- − Depreciation
- −$55,273
- Taxable income
- $133,452
- Est. tax owed @ 24.0%
- −$32,028
- After-tax cash flow
- $123,729/yr
For passive investors: Depreciation is non-cash, so a rental often shows a tax loss while cash-flowing — sheltering income. Rental losses are passive: they offset passive income freely, and up to $25,000/yr can offset ordinary (W-2) income if you actively participate and your MAGI is under $100k (phasing out to $0 by $150k); unused losses carry forward. On sale, claimed depreciation is recaptured at up to 25%, and gains may owe capital-gains tax (a 1031 exchange can defer both). Figures are a year-1 estimate at your 24.0% rate — not tax advice; consult a CPA.
Schools (NCES district)
- District
- Hazelwood
- NCES district ID
- 2913830
- Math proficiency
- 11% ▼ -13.00%
- Reading proficiency
- 26% ▼ -6.00%
- Median HH income
- $51,621
- Composite
- 16.77/100
- National rank
- #9156
- State rank
- #306 of 324 in MO
Livability — Hazelwood
- Score
- 62/100
- State rank
- #395
- US rank
- #16956
Category grades
Schools grade is shown separately in the Schools card above.
Census & demographics
- Census place
- Hazelwood, MO
- County
- Saint Louis County · 888,823 people
- City population
- 17,813
- Metro
- St. Louis, MO-IL
- Population (ZIP)
- 17,813
- Household income
- $49,453
- Rent vs Own
- Severe rent burden
- 766.0
Population outlook (St. Louis County) Hauer SSP2
- Today (2025)
- 1,025,227 people
- By 2030
- 1,028,023 · +0.3%
- By 2040
- 1,020,940 · -0.4%
- By 2050
- 1,007,280 · -1.8%
- By 2075
- 987,277 · -3.7%
- By 2100
- 921,984 · -10.1%
Race, ethnicity, and origin ACS 2023
- Neighborhood character
- Diverse neighborhood (Simpson 0.64)
- Race & ethnicity
- White 46% Black 38% Two or more races 10% Hispanic / Latino 4% Asian 2%
- Common ancestry
- Lithuanian 3% Romanian 1% Italian 1%
- Foreign-born
- 5% · Canada, Vietnam
- Languages at home
- 94% English-only · Spanish 3% Vietnamese 1% Tagalog/Filipino 1%
Political lean MEDSL · St. Louis
- 2024 margin
- Strong D (+23.4) · D 60.8% · R 37.4% · Other 1.7%
- 2008→2024 swing
- +3.5pp toward D · 2008: 19.9pp · 2024: 23.4pp
- All cycles
- 2024: D+23.4 2020: D+24.0 2016: D+16.2 2012: D+13.7 2008: D+19.9
Not yet ingested
- Civics
- —
Market trends
- HPI YoY
- ▼ -204.48%
- Current HPI
- 234.7353
- Rent YoY
- ▲ 4.45%
- Metro
- St. Louis, MO-IL
- State GDP YoY
- ▲ 1.84%
- F500 in state
- 20
Industry mix (Fortune 500 HQ in MO)
| Industry | F500 HQs | Revenue |
|---|---|---|
| Healthcare | 1 | $163B |
|
||
| Insurance | 1 | $21B |
|
||
| Industrial Technology | 1 | $17B |
|
||
| Retail | 1 | $16B |
|
||
| Industrial Distribution | 1 | $10B |
|
||
| Utilities | 1 | $9B |
|
||
Price history
+94.9% since first listed16 events — show timeline
- 2026-02-25 Listed $1,900,000 MARIS as Distributed by MLS Grid
- 2026-02-24 Coming Soon $1,900,000 MARIS as Distributed by MLS Grid
- 2025-06-17 Listed $1,950,000 MARIS as Distributed by MLS Grid
- 2024-05-10 Rental Removed $950 APPFOLIO
- 2024-05-07 Listed for Rent $950 APPFOLIO
- 2023-10-08 Rental Removed $900 APPFOLIO
- 2023-09-03 Listed for Rent $900 APPFOLIO
- 2022-06-18 Price Changed $900 APPFOLIO
- 2021-10-12 Sold (Public Records) $1,600,000 Public Records
- 2021-04-21 Sold (Public Records) $1,172,000 Public Records
- 2013-10-21 Sold (Public Records) $855,000 Public Records
- 2012-06-01 Sold (Public Records) $525,000 Public Records
- 2010-06-11 Sold (Public Records) $550,000 Public Records
- 2010-02-19 Sold (Public Records) $485,000 Public Records
- 2004-10-01 Sold (Public Records) $1,075,000 Public Records
- 2003-05-22 Sold (Public Records) $975,000 Public Records
Property tax history
+2.0%/yrLatest (2022): $3,352 · +1.7% YoY. Source: county tax records.
Cash-flow waterfall
monthlySold comps — $/sqft
last 12 mo · ≤1 miLoading sold comps…