1724 Minnewawa Ave #109 · Clovis, CA
Flood risk 3/10 · Minor
- FEMA flood zone
- X (unshaded)
- Chance of flooding over 30 yrs
- 0.2%
- Est. flood insurance / yr
- $507 – $1,088
Fire risk 1/10 · Minimal
- Est. fire insurance / yr
- $659 – $1,223
Heat risk 8/10 · Major
- Hot days now (above 105°F)
- 7 days/yr
- Hot days in 30 yrs
- 16 days/yr
Wind risk 1/10 · Minimal
- Chance of severe wind over 30 yrs
- —
Air-quality risk 10/10 · Severe
- Unhealthy air days now
- 57 days/yr
- Unhealthy air days in 30 yrs
- 60 days/yr
Risk factors via First Street. Map © Google.
Why this score? — see what drove the B grade
The composite is a weighted blend of 9 inputs, each scored 0–100. Each bar is that input's sub-score; the figure is the points it added to the 100-point composite (weight × sub-score).
- Cash flow +30.0/30.0
- 1% rule +10.0/10.0
- DSCR +10.0/10.0
- ARV discount +6.1/15.0
- Schools +5.9/10.0
- Livability +3.8/5.0
- Rent growth +3.2/5.0
- Condition / age +2.5/5.0
- Appreciation +0.0/10.0
$78,950
🖨 Deal sheet (PDF) 📄 Offer letter ✓ Due diligence
Listing remarks MLS
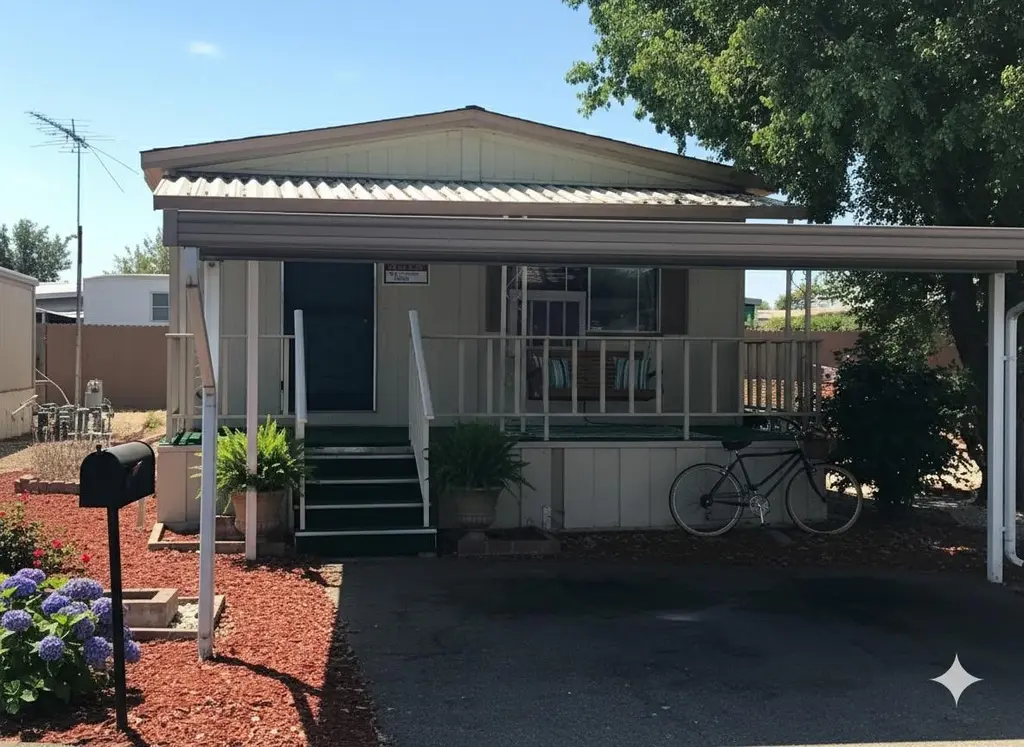
Take a look at this spacious manufactured home located in Desired Clovis , Bonaventure Senior Mobile home Park. The updated wood flooring throughout and popular gas stove makes this home cozy a and inviting. This home is move in ready. It's peaceful surroundings and nicely landscaped yard makes for a nice place to come home to. Community amenities include a pool, spa, picnic area,RV Storage and clubhouse. The location is walking distance to shopping, banking, grocery stores and restaurants and minutes from old town Clovis where you'll find antique shops and fine dining. This charming town has much to offer.
Key facts
- Rv storage
- Gas stove
- Built 1978
Tags
Neighborhood map
What this means for you Summary
Snapshot
- This is a 2-bed/2.0-bath manufactured listed at $79k.
Deal economics
- At list price, monthly cash flow is $730 ($9k/yr) — positive.
- The deal already cash-flows at list — no discount required.
- Meets the 1% rule at list price ($2k rent vs $79k).
- Recommended offer: $74k (6.0% below list) — sets the bar for market timing.
- Cap rate 17.4% vs local median 3.0% in Clovis — top-decile yield for the area; either an underpriced asset or a hidden risk that comps aren't pricing in. Stress-test before assuming the spread holds.
Location & tenants
- Location reads 76/100 on livability (#92 in CA, #3,307 nationally) — a middle-class / working-renter tenant base. Strengths: commute A+, housing A+, employment A; Watch: amenities C-, health & safety D, cost of living F.
- Clovis Unified (suburban): math 58% / reading 72% proficiency, ranked #152 of 1,400 in CA (top 11%) — acceptable for families but not a draw, mixed tenant base, ~2y average lease.
- Market conditions: Rents rising (+2.6%/yr); 85 active listings in the ZIP; 40 comparable units currently listed for rent nearby; rentals at typical pace (median 24d on market — plan ~3-4 weeks tenant-placement turnaround); 2,426 units permitted in Fresno County in 2024 (296 in 5+ unit buildings).
Forward outlook
- Local home prices are declining (-3.0%/yr); year-one equity from $546 of loan paydown is wiped out by about $2k of value loss. Plan a longer hold.
- Fresno County population projected at +11% by 2050 — modest demand growth; plan on rents tracking national, not racing it.
- At projected returns (-3.0% appreciation + 2.6% rent growth), your $22k cash investment doubles in ~3 years — after that, you're playing with house money.
Negotiation context
- It's been on market 71 days — a 6% lower offer ($74k) is reasonable based on typical stale-listing flexibility.
Risks & watch-outs
- Climate carrying-cost: extreme-heat days projected 7→16/yr by 2055 (HVAC capex compounding) — expect insurance premiums to compound above CPI over the hold.
Questions for the listing agent
- It's been on market 71 days. Have you received any prior offers? Is the seller open to a 6% concession, seller financing, or rate buy-down credit?
- Built in 1978 — when were the roof, HVAC, electrical panel, plumbing, and water heater last replaced?
- Why hasn't it sold? Are there any deal-killer items the seller is aware of (foundation, flood, title, zoning, code violations)?
- Is there a deadline driving the sale (1031 exchange, divorce, estate, relocation)? That informs how much negotiation room exists.
- Schools are B-rated — typically a magnet for longer-tenancy family renters. What's the average tenant stay here, and is there a school-zone premium baked into asking?
- What's the average days-on-market for RENTAL listings here right now (not sales)? A rising rental-DOM trend means longer vacancies and softer asking-rent achievability than the comps imply.
- What's the recent tenant-quality profile in this submarket — average credit score on applications, eviction rate, late-payment / NSF rate, and stable-employment percentage? A property-management company in the area should have these aggregated.
- How much new for-sale + rental construction is in the pipeline within 1–3 miles? Heavy new supply typically softens prices + rents 12–24 months out; constrained supply supports both.
Investment metrics
- 1% rule
- 2.04% ✓
- Cap rate
- 17.38%
- Cash-on-cash
- 39.60%
- DSCR
- 2.76
- GRM
- 4.1
CMA / ARV
- ARV (median comp)
- $76,600
- List price
- $78,950
- Delta
- 3.07%
- Verdict
- FAIR
- Comps
- 20 within 1.0 mi
Show comp detail 10 sales within ~0.75 mi
| Address | Dist | Beds/Ba | Sqft | Sold | Price | $/sf | Match |
|---|---|---|---|---|---|---|---|
| 1724 Minnewawa Ave #166 | 0.00mi | 2/1.0 | 900 (-6%) | 4mo | $53,900 | $60 | 82 |
| 1650 Villa Ave #9 | 0.30mi | 2/2.0 | 1,040 (+8%) | 3mo | $120,000 | $115 | 70 |
| 1272 Villa Ave #66 | 0.48mi | 2/2.0 | 1,000 (+4%) | 4mo | $70,000 | $70 | 68 |
| 1724 Minnewawa #184 | 0.00mi | 2/2.0 | 1,100 (+15%) | 10mo | $65,000 | $59 | 67 |
| 1650 Villa Ave #7 | 0.30mi | 2/2.0 | 1,040 (+8%) | 9mo | $120,000 | $115 | 65 |
| 1724 Minnewawa Ave | 0.15mi | 2/2.0 | 1,100 (+15%) | 10mo | $65,000 | $59 | 60 |
| 1724 Minnewawa Ave #199 | 0.16mi | 2/2.0 | 1,040 (+8%) | 23mo | $60,000 | $58 | 59 |
| 1500 E Villa Avenue Ave N #19 | 0.22mi | 2/2.0 | 1,050 (+9%) | 23mo | $100,000 | $95 | 55 |
| 1500 Villa #45 | 0.41mi | 2/2.0 | 1,080 (+12%) | 16mo | $65,000 | $60 | 46 |
| 1500 Villa Ave #33 | 0.41mi | 1/1.8 (-1) | 1,100 (+15%) | 21mo | $116,000 | $105 | 34 |
Match score weights: distance 35% · size 25% · config 20% · recency 20%. Top-matched comps best support the ARV.
Projected returns pro-forma
-3.0% appreciation · 2.65% rent growth · sell at horizon
- IRR
- 35.5%
- Equity multiple
- 2.50×
- Total profit
- $33,130
- Equity at exit
- $11,772
- IRR
- 42.1%
- Equity multiple
- 4.91×
- Total profit
- $86,471
- Equity at exit
- $6,826
Cash invested: $22,106 (down + closing). Projections, not guarantees.
Landlord ↔ Tenant lean methodology
- Overall (STATE)
- 18 Strongly Tenant-Friendly
- State California
- 18 Strongly Tenant-Friendly · D+13
- County
- — inherits STATE
- City
- — inherits STATE
ZIP-level market 93612
- Rents YoY
- 2.6%
- Active inventory
- 85
- Price-to-rent
- 4.1×
Monthly cashflow live
- Estimated rent
- $1,614 high interval (Pro) →
- Mortgage (P&I)
- −$414
- Tax est. 1.5%
- −$99 /mo · $1,184/yr
- Insurance
- −$33
- HOA
- −$0
- Vacancy / Maint / Mgmt
- −$339
- Net cashflow
- $730
Break-even live
Sensitivity live
| Price | -10% $784 | -5% $757 | +0% $730 | +5% $702 | +10% $675 |
|---|---|---|---|---|---|
| Rent | -10% $602 | -5% $666 | +0% $730 | +5% $793 | +10% $857 |
| Rate | -1.0pp $769 | -0.5pp $750 | base $730 | +0.5pp $709 | +1.0pp $688 |
UW: 25.0% down · 7.5% · 30yr · 1.5% tax · 5.0% vac · 8.0% maint · 8.0% mgmt
Financing live
Cash to close
- Down payment
- $19,738
- Closing costs
- $2,368
- Reserves months
- —
- Total cash needed
- —
Loan-product check · same deal, 3 products live
Conventional
25% down · 7.5% · 30yr
- Down + closing
- —
- Monthly P&I
- —
- Monthly cashflow
- —
- DSCR
- —
- Eligible?
- —
Personal DTI + credit; lowest rate.
DSCR
20% down · 8.5% · 30yr
- Down + closing
- —
- Monthly P&I
- —
- Monthly cashflow
- —
- DSCR
- —
- Eligible?
- —
No personal income docs; deal must DSCR.
Hard money
10% down · 12.0% · 12mo
- Down + closing
- —
- Monthly P&I
- —
- Monthly cashflow
- —
- DSCR
- —
- Eligible?
- —
Short-term bridge; refi at stabilization.
Rent comps 40 comps
| Address | Beds | Baths | Sqft | Rent | $/sqft | DOM | Units | Dist |
|---|---|---|---|---|---|---|---|---|
| 33 W Santa Ana Ave Apt A Clovis, CA | 2.0 | 1.5 | 900 | $1,450 | $1.61 | 3d | 1 | 0.26mi |
| 69 W Beverly Ave Unit Advertising Unit Clovis, CA | 2.0 | 1.0 | 850 | $1,650 | $1.94 | 44d | 1 | 0.29mi |
| 139 Santa Ana Ave Clovis, CA | 1.0 | 1.0 | 620 | $1,365 | $2.20 | 11d | 3 | 0.32mi |
| 189 W Santa Ana Ave Apt F Clovis, CA | 2.0 | 1.0 | 800 | $1,450 | $1.81 | 3d | 1 | 0.32mi |
| 361 W Santa Ana Ave Clovis, CA | 1.0 | 1.0 | 735 | $1,150 | $1.56 | 44d | 1 | 0.48mi |
| 322 W Barstow Ave Unit 101 Clovis, CA | 2.0 | 2.0 | 1100 | $2,150 | $1.95 | 44d | 1 | 0.54mi |
| 1108 Villa Ave Clovis, CA | 2.0 | 1.5 | 900 | $1,500 | $1.67 | 44d | 1 | 0.56mi |
| 1108 Villa Ave Clovis, CA | 1.0 | 1.0 | 651 | $1,300 | $2.00 | 24d | 1 | 0.56mi |
| 139 W Portals Ave Clovis, CA | 2.0 | 1.0 | 1014 | $1,600 | $1.58 | 44d | 1 | 0.56mi |
| 50 W 9th St Clovis, CA | 2.0 | 2.0 | 1100 | $1,500 | $1.36 | 24d | 1 | 0.65mi |
| 563 W Alamos Ave Unit D Clovis, CA | 1.0 | 1.0 | 700 | $1,195 | $1.71 | 3d | 1 | 0.67mi |
| 2243 Helm Ave Unit 102 Clovis, CA | 2.0 | 2.0 | 1100 | $1,925 | $1.75 | 21d | 1 | 0.72mi |
| 400 W Gettysburg Ave Unit 215B Clovis, CA | 2.0 | 2.0 | 994 | $1,780 | $1.79 | 44d | 1 | 0.75mi |
| 400 W Gettysburg Ave Unit 116B Clovis, CA | 2.0 | 2.0 | 994 | $1,795 | $1.81 | 44d | 1 | 0.75mi |
| 400 W Gettysburg Ave Unit 145A Clovis, CA | 1.0 | 1.0 | 714 | $1,500 | $2.10 | 24d | 1 | 0.75mi |
| 400 W Gettysburg Ave Unit 101A Clovis, CA | 2.0 | 1.0 | 904 | $1,580 | $1.75 | 24d | 1 | 0.75mi |
| 400 W Gettysburg Ave Unit 206B Clovis, CA | 2.0 | 1.0 | 904 | $1,500 | $1.66 | 24d | 1 | 0.75mi |
| 400 W Gettysburg Ave Unit 243A Clovis, CA | 2.0 | 1.0 | 904 | $1,500 | $1.66 | 3d | 1 | 0.75mi |
| 400 W Gettysburg Ave Unit 143A Clovis, CA | 2.0 | 1.0 | 904 | $1,650 | $1.83 | 21d | 1 | 0.75mi |
| 400 W Gettysburg Ave Apt 204A Clovis, CA | 2.0 | 1.0 | 904 | $1,600 | $1.77 | 44d | 1 | 0.75mi |
| 400 W Gettysburg Ave Apt 223A Clovis, CA | 2.0 | 2.0 | 994 | $1,700 | $1.71 | 44d | 1 | 0.75mi |
| 400 W Gettysburg Ave Apt 220A Clovis, CA | 1.0 | 1.0 | 714 | $1,350 | $1.89 | 44d | 1 | 0.75mi |
| 400 W Gettysburg Ave Apt 208A Clovis, CA | 2.0 | 1.0 | 904 | $1,500 | $1.66 | 44d | 1 | 0.75mi |
| 1099 Sylmar Ave Clovis, CA | 2.0 | 1.0 | 965 | $1,750 | $1.81 | 24d | 3 | 0.77mi |
| 2967 Terry Ave Clovis, CA | 3.0 | 1.5 | 1099 | $2,095 | $1.91 | 24d | 1 | 0.89mi |
| 740 Villa Ave Clovis, CA | 2.0 | 2.0 | 922 | $1,950 | $2.11 | 21d | 1 | 0.90mi |
| 1201 Scott Ave Clovis, CA | 2.0 | 1.0 | 932 | $1,568 | $1.68 | 3d | 4 | 0.90mi |
| 707 Bush Ave Clovis, CA | 2.0 | 1.0 | 950 | $1,575 | $1.66 | 44d | 1 | 0.93mi |
| 1008 Jefferson Ave Unit D Clovis, CA | 2.0 | 1.0 | 700 | $1,375 | $1.96 | 24d | 1 | 0.94mi |
| 1038 Tollhouse Rd Unit 1038 Clovis, CA | 2.0 | 1.5 | 1100 | $1,800 | $1.64 | 3d | 1 | 1.01mi |
| 2777 Willow Ave Clovis, CA | 1.0–2.0 | 1.0 | 812 | $1,769 | $2.18 | 2d | 8 | 1.01mi |
| 55 W Bullard Ave Clovis, CA | 1.0–2.0 | 1.0 | 800 | $1,771 | $2.21 | 2d | 13 | 1.03mi |
| 835 W Pico Ave Clovis, CA | 1.0–2.0 | 1.0 | 761 | $1,595 | $2.10 | 2d | 3 | 1.08mi |
| 2800 Willow Ave Clovis, CA | 1.0–2.0 | 1.0–2.0 | 774 | $1,633 | $2.11 | 2d | 7 | 1.13mi |
| 2810 Willow Ave Clovis, CA | 1.0 | 1.0 | 621 | $1,389 | $2.24 | 3d | 1 | 1.14mi |
| 2810 Willow Ave Clovis, CA | 2.0 | 2.0 | 890 | $1,572 | $1.77 | 11d | 1 | 1.14mi |
| 2810 Willow Ave Clovis, CA | 2.0 | 2.0 | 928 | $1,623 | $1.75 | 24d | 1 | 1.14mi |
| 4442 N Manila Ave Fresno, CA | 3.0 | 1.5 | 1033 | $2,150 | $2.08 | 20d | 1 | 1.15mi |
| 434 W Stuart Ave Unit 2 Clovis, CA | 2.0 | 1.0 | 860 | $1,575 | $1.83 | 3d | 1 | 1.17mi |
| 551 W Ashlan Ave Unit 101 858 Clovis, CA | 2.0 | 2.0 | 1000 | $1,450 | $1.45 | 44d | 1 | 1.19mi |
Listing history 17 events
-
2026-06-18days on market $78,950 Active 71 DOM
-
2026-06-17days on market $78,950 Active 70 DOM
-
2026-06-16days on market $78,950 Active 69 DOM
-
2026-06-15days on market $78,950 Active 68 DOM
-
2026-06-13days on market $78,950 Active 66 DOM
-
2026-06-13days on market $78,950 Active 65 DOM
-
2026-06-10days on market $78,950 Active 63 DOM
-
2026-06-09pricedays on market $78,950 Active 62 DOM
-
2026-06-08days on market $82,950 Active 61 DOM
-
2026-06-07days on market $82,950 Active 60 DOM
-
2026-06-05days on market $82,950 Active 57 DOM
-
2026-06-03days on market $82,950 Active 56 DOM
-
2026-06-02days on market $82,950 Active 55 DOM
-
2026-06-01days on market $82,950 Active 54 DOM
-
2026-05-31days on market $82,950 Active 53 DOM
-
2026-05-06price $82,950 614-char remark
Show marketing remark (614 chars)
Take a look at this spacious manufactured home located in Desired Clovis , Bonaventure Senior Mobile home Park. The updated wood flooring throughout and popular gas stove makes this home cozy a and inviting. This home is move in ready. It's peaceful surroundings and nicely landscaped yard makes for a nice place to come home to. Community amenities include a pool, spa, picnic area,RV Storage and clubhouse. The location is walking distance to shopping, banking, grocery stores and restaurants and minutes from old town Clovis where you'll find antique shops and fine dining. This charming town has much to offer.
-
2026-04-07$85,950 Active 614-char remark
Show marketing remark (614 chars)
Take a look at this spacious manufactured home located in Desired Clovis , Bonaventure Senior Mobile home Park. The updated wood flooring throughout and popular gas stove makes this home cozy a and inviting. This home is move in ready. It's peaceful surroundings and nicely landscaped yard makes for a nice place to come home to. Community amenities include a pool, spa, picnic area,RV Storage and clubhouse. The location is walking distance to shopping, banking, grocery stores and restaurants and minutes from old town Clovis where you'll find antique shops and fine dining. This charming town has much to offer.
ⓘ Source: listings_history table (triggers on properties + properties_extension) + one-shot
backfill from property_details.listing_events for pre-trigger history.
Climate risk First Street
- Flood 3/10 Moderate FEMA zone X (unshaded) · 20% chance over 30 yrs
- Wildfire 1/10 Low
- Heat 8/10 Severe 7 d/yr ≥105°F today · 16 d/yr by 30 yrs out
- Wind 1/10 Low
- Air quality 10/10 Extreme 57 unhealthy d/yr today · 60 by 30 yrs out
Nearby sold comps map
Loading sold comps map…
Walkable amenities ~0.75 mi
Loading nearby amenities…
Taxation est. · year 1
- Rental income
- $19,369
- − Mortgage interest
- −$4,422
- − Property taxes
- −$1,184
- − Insurance
- −$395
- − Repairs & maintenance
- −$1,550
- − Management
- −$1,550
- − Depreciation
- −$2,297
- Taxable income
- $7,972
- Est. tax owed @ 24.0%
- −$1,913
- After-tax cash flow
- $6,841/yr
For passive investors: Depreciation is non-cash, so a rental often shows a tax loss while cash-flowing — sheltering income. Rental losses are passive: they offset passive income freely, and up to $25,000/yr can offset ordinary (W-2) income if you actively participate and your MAGI is under $100k (phasing out to $0 by $150k); unused losses carry forward. On sale, claimed depreciation is recaptured at up to 25%, and gains may owe capital-gains tax (a 1031 exchange can defer both). Figures are a year-1 estimate at your 24.0% rate — not tax advice; consult a CPA.
Schools (NCES district)
- District
- Clovis Unified
- NCES district ID
- 0609030
- Math proficiency
- 58% ▲ 1.00%
- Reading proficiency
- 72% ▲ 2.00%
- Median HH income
- $71,950
- Composite
- 58.7/100
- National rank
- #2003
- State rank
- #152 of 1400 in CA
Livability — Clovis
- Score
- 76/100
- State rank
- #92
- US rank
- #3307
Category grades
Schools grade is shown separately in the Schools card above.
Census & demographics
- Census place
- Clovis, CA
- County
- Fresno County · 834,801 people
- City population
- 139,989
- Metro
- Fresno, CA
- Population (ZIP)
- 37,755
- Household income
- $66,683
- Rent vs Own
- Severe rent burden
- 2487.0
Population outlook (Fresno County) Hauer SSP2
- Today (2025)
- 1,042,971 people
- By 2030
- 1,072,198 · +2.8%
- By 2040
- 1,122,408 · +7.6%
- By 2050
- 1,157,251 · +11.0%
- By 2075
- 1,182,575 · +13.4%
- By 2100
- 1,105,899 · +6.0%
Race, ethnicity, and origin ACS 2023
- Neighborhood character
- Diverse neighborhood (Simpson 0.65)
- Race & ethnicity
- Hispanic / Latino 41% White 41% Two or more races 18% Asian 12% Black 2% Native American 2%
- Hispanic origin (detail)
- Mexican 37%
- Common ancestry
- Slovak 2% Lithuanian 1% Italian 1%
- Foreign-born
- 12% · Canada, China, Vietnam
- Languages at home
- 73% English-only · Spanish 18% Other Asian/Pacific 4% Tagalog/Filipino 2%
Political lean MEDSL · Fresno
- 2024 margin
- Toss-up / Even · D 46.5% · R 50.9% · Other 2.6%
- 2008→2024 swing
- -6.5pp toward R · 2008: 2.1pp · 2024: -4.4pp
- All cycles
- 2024: R+4.4 2020: D+7.8 2016: D+3.9 2012: R+2.9 2008: D+2.1
Not yet ingested
- Civics
- —
Market trends
- HPI YoY
- ▼ -352.97%
- Current HPI
- 357.6089
- Rent YoY
- ▲ 2.65%
- Metro
- Fresno, CA
- State GDP YoY
- ▲ 3.21%
- F500 in state
- 116
Industry mix (Fortune 500 HQ in CA)
| Industry | F500 HQs | Revenue |
|---|---|---|
| Technology | 27 | $1,492B |
|
||
| Financial Services | 3 | $174B |
|
||
| Retail | 3 | $44B |
|
||
| Insurance | 3 | $26B |
|
||
| Media / Entertainment | 2 | $115B |
|
||
| Pharmaceuticals / Biotech | 2 | $62B |
|
||
Price history
-3.5% since first listed2 events — show timeline
- 2026-05-06 Price Changed $82,950 FRESNOMLS
- 2026-04-07 Listed $85,950 FRESNOMLS
Cash-flow waterfall
monthlySold comps — $/sqft
last 12 mo · ≤1 miLoading sold comps…