 🏷️ Likely Rental
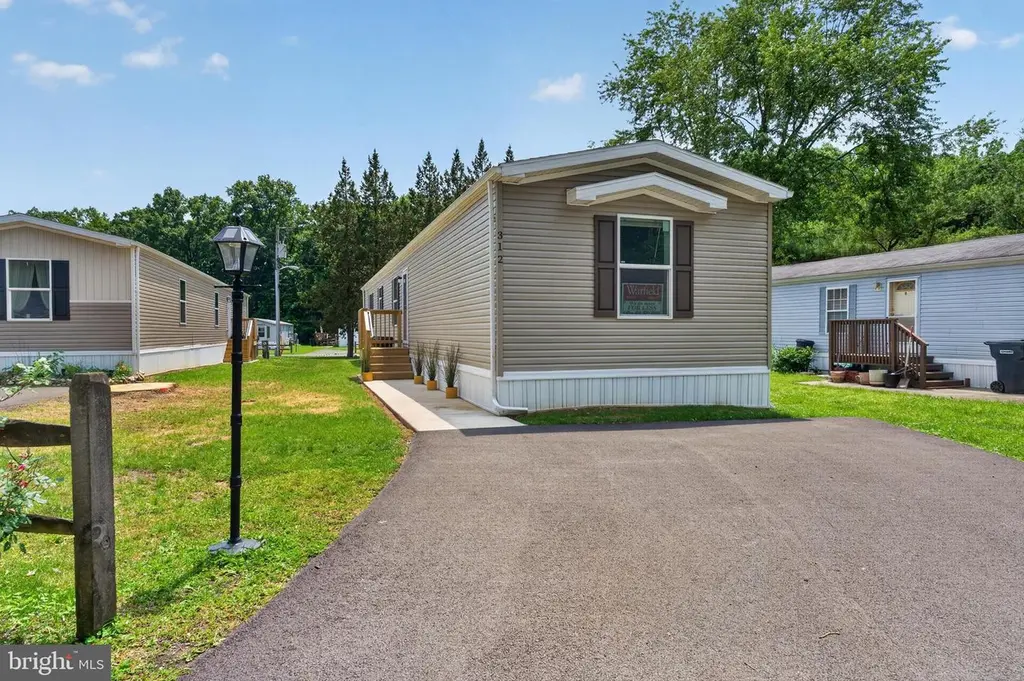
312 Bauers Dr · Edgewood, MD
Flood risk No data
- FEMA flood zone
- —
- Chance of flooding over 30 yrs
- —
- Est. flood insurance / yr
- —
Fire risk No data
- Est. fire insurance / yr
- —
Heat risk No data
- Hot days now (above threshold)
- —
- Hot days in 30 yrs
- —
Wind risk No data
- Chance of severe wind over 30 yrs
- —
Air-quality risk No data
- Unhealthy air days now
- —
- Unhealthy air days in 30 yrs
- —
Risk factors via First Street. Map © Google.
Why this score? — see what drove the B grade
The composite is a weighted blend of 9 inputs, each scored 0–100. Each bar is that input's sub-score; the figure is the points it added to the 100-point composite (weight × sub-score).
- Cash flow +30.0/30.0
- 1% rule +10.0/10.0
- DSCR +10.0/10.0
- ARV discount +7.5/15.0
- Condition / age +4.8/5.0
- Rent growth +3.7/5.0
- Livability +3.7/5.0
- Schools +2.9/10.0
- Appreciation +0.0/10.0
$79,500
🖨 Deal sheet (PDF) 📄 Offer letter ✓ Due diligence
Listing remarks
MORE PHOTOS COMING. HIGH END 2025 CLAYTON HOME THAT LOOKS NEW. 16 X 80 3 BD X 2 BA WITH LARGE BEDROOMS AND OPEN FLOOR PLAN. HIGH END UPGRADES INCLUDE LOW E ARGON WINDOWS. RHEEM WATER HEATER WITH MULPILE SETTING SUCH AS VACATION, ENERGY SAVER. HIGH END HEAT PUMP WITH PROGRAMMABLE THERMOSTAT. 2 X 6 WALLS WITH UPGRADED INSULATION. NEW FULL VIEW UPGRADED FRONT DOOR AND SO MUCH MORE. NICE SMALL COMMUNITY WITH THE LOWEST GROUND RENT AROUND AT $870 PER MONTH. LIKE TO BOAT OR FISH WELL FLYING POINT PARK IS RIGHT AROUND THE CORNER. THIS HOME IS PRICED TO SELL AND IS A MUST SEE!!! COMPARE THIS HOME TO OTHERS AS YOU WON'T BE DISSAPOINTED!!!
Key facts
- 2 parking spots
- Built 2025
- Listed 8 days
Property features AI
Finance
- Financial info: Ground rent $875 per month (ownership: ground rent)
Exterior
- Parking: Attached carport with space for 2 vehicles (2 total garage/parking spaces)
- Utilities: Public water; Public sewer
- Home design: Manufactured single-wide home; Estimated year built
- Construction: Vinyl siding
- Exterior features: Above-grade structure
Interior
- Bedrooms: 3 bedrooms on the main level
- Bathrooms: 2 full bathrooms on the main level
- Heating & cooling: Central heating (electric); Central air conditioning (electric); Electric hot water
- Interior features: Estimated living area; No basement
Neighborhood map
What this means for you Summary
Snapshot
- This is a 3-bed/2.0-bath single-family listed at $80k. Condition is rated excellent.
Deal economics
- At list price, monthly cash flow is $1k ($15k/yr) — positive.
- The deal already cash-flows at list — no discount required.
- Meets the 1% rule at list price ($2k rent vs $80k).
- Cap rate 25.5% vs local median 5.5% in Edgewood — top-decile yield for the area; either an underpriced asset or a hidden risk that comps aren't pricing in. Stress-test before assuming the spread holds.
Location & tenants
- Location reads 73/100 on livability (#118 in MD, #4,991 nationally) — a middle-class / working-renter tenant base. Strengths: commute A+, housing A+, health & safety A+; Watch: amenities D, crime F.
- Harford County Public Schools (suburban): math 22% / reading 39% proficiency, ranked #9 of 24 in MD (top 38%) — families likely to look elsewhere, expect single-tenant / working-renter base with shorter leases.
- Zoned schools: Deerfield Elementary (math 7% / reading 17%, grade F, #550 of 860 statewide, top 66%, 728 students, 78% FRL); Edgewood Middle (math 7% / reading 31%, grade F, #155 of 225 statewide, top 70%, 999 students, 72% FRL); Edgewood High (math 43% / reading 54%, grade D, #111 of 222 statewide, top 50%, 1,415 students, 62% FRL) — zoned schools average 71% FRL vs 24% district-wide (46 pts higher); higher-poverty schools than district average — tighter screening recommended.
- Market conditions: Rents rising fast (+4.9%/yr); 95 active listings in the ZIP; 12 comparable units currently listed for rent nearby; rentals lingering (median 46d on market — plan ~5-8 weeks vacancy on turnover, expect pricing pressure); 50% of comp listings sitting > 30 days — soft ceiling on asking rent; solid renter incomes; 803 units permitted in Harford County in 2024 (26 in 5+ unit buildings).
- This rent runs 34% of the median local income ($82k/yr) — at the standard rent-burdened threshold; future hikes will face affordability resistance.
Forward outlook
- Local home prices are declining (-3.0%/yr); year-one equity from $550 of loan paydown is wiped out by about $2k of value loss. Plan a longer hold.
- At projected returns (-3.0% appreciation + 4.9% rent growth), your $22k cash investment doubles in ~2 years — after that, you're playing with house money.
Negotiation context
- Only 8 days on market — expect competitive offers; lowballing is unlikely to land.
Questions for the listing agent
- Is there a deadline driving the sale (1031 exchange, divorce, estate, relocation)? That informs how much negotiation room exists.
- Schools are D-rated, which usually means shorter tenancies and higher turnover. Who's the typical renter profile here, and what's been the actual vacancy rate?
- Crime grade is F in this area — have there been break-ins, vandalism, or insurance claims at this property in the last 3 years? What carrier currently insures it and at what premium?
- What's the average days-on-market for RENTAL listings here right now (not sales)? A rising rental-DOM trend means longer vacancies and softer asking-rent achievability than the comps imply.
- What's the recent tenant-quality profile in this submarket — average credit score on applications, eviction rate, late-payment / NSF rate, and stable-employment percentage? A property-management company in the area should have these aggregated.
- How much new for-sale + rental construction is in the pipeline within 1–3 miles? Heavy new supply typically softens prices + rents 12–24 months out; constrained supply supports both.
Investment metrics
- 1% rule
- 2.90% ✓
- Cap rate
- 25.49%
- Cash-on-cash
- 68.57%
- DSCR
- 4.05
- GRM
- 2.9
CMA / ARV
- ARV (on-the-fly)
- $289,280
- Comps found
- 12
Show comp detail 12 sales within ~0.75 mi
| Address | Dist | Beds/Ba | Sqft | Sold | Price | $/sf | Match |
|---|---|---|---|---|---|---|---|
| 2414A Willoughby Beach Rd | 0.41mi | 3/2.0 | 1,352 (+6%) | 11mo | $267,000 | $197 | 62 |
| 126 Laburnum Rd | 0.62mi | 3/1.5 | 1,304 (+2%) | 5mo | $285,000 | $219 | 62 |
| 341 Winterberry Dr | 0.55mi | 3/1.5 | 1,304 (+2%) | 10mo | $295,000 | $226 | 61 |
| 501 Arbor Ct | 0.30mi | 4/1.5 (+1) | 1,144 (-11%) | 3mo | $315,000 | $275 | 59 |
| 3040 Ebbtide Dr | 0.50mi | 3/2.0 | 1,326 (+4%) | 17mo | $331,000 | $250 | 57 |
| 630 Sequoia Dr | 0.50mi | 3/1.5 | 1,144 (-11%) | 1mo | $307,000 | $268 | 57 |
| 604 Pier Dr | 0.61mi | 3/2.0 | 1,354 (+6%) | 16mo | $315,000 | $233 | 49 |
| 607 Haven Pl | 0.66mi | 3/1.5 | 1,326 (+4%) | 18mo | $280,000 | $211 | 46 |
| 107 Oak St | 0.74mi | 3/1.5 | 1,200 (-6%) | 14mo | $215,000 | $179 | 42 |
| 2401 Sycamore Ln | 0.50mi | 4/2.0 (+1) | 1,404 (+10%) | 19mo | $284,900 | $203 | 40 |
| 609 Harbour Oak Dr | 0.60mi | 3/2.0 | 1,448 (+13%) | 15mo | $349,900 | $242 | 38 |
| 601 Mulberry Ln | 0.67mi | 4/2.0 (+1) | 1,449 (+13%) | 21mo | $315,000 | $217 | 25 |
Match score weights: distance 35% · size 25% · config 20% · recency 20%. Top-matched comps best support the ARV.
Projected returns pro-forma
-3.0% appreciation · 4.92% rent growth · sell at horizon
- IRR
- 70.2%
- Equity multiple
- 4.27×
- Total profit
- $72,703
- Equity at exit
- $11,854
- IRR
- 74.8%
- Equity multiple
- 9.41×
- Total profit
- $187,136
- Equity at exit
- $6,874
Cash invested: $22,260 (down + closing). Projections, not guarantees.
Landlord ↔ Tenant lean methodology
- Overall (STATE)
- 27 Tenant-Leaning
- State Maryland
- 27 Tenant-Leaning · D+14
- County
- — inherits STATE
- City
- — inherits STATE
ZIP-level market 21040
- Home prices YoY
- -29.4%
- Rents YoY
- 4.9%
- Active inventory
- 95
- Price-to-rent
- 2.9×
Monthly cashflow live
- Estimated rent
- $2,306 high interval (Pro) →
- Mortgage (P&I)
- −$417
- Tax est. 1.5%
- −$99 /mo · $1,192/yr
- Insurance
- −$33
- HOA
- −$0
- Vacancy / Maint / Mgmt
- −$484
- Net cashflow
- $1,272
Break-even live
Sensitivity live
| Price | -10% $1,327 | -5% $1,299 | +0% $1,272 | +5% $1,244 | +10% $1,217 |
|---|---|---|---|---|---|
| Rent | -10% $1,090 | -5% $1,181 | +0% $1,272 | +5% $1,363 | +10% $1,454 |
| Rate | -1.0pp $1,312 | -0.5pp $1,292 | base $1,272 | +0.5pp $1,251 | +1.0pp $1,230 |
UW: 25.0% down · 7.5% · 30yr · 1.5% tax · 5.0% vac · 8.0% maint · 8.0% mgmt
Financing live
Cash to close
- Down payment
- $19,875
- Closing costs
- $2,385
- Reserves months
- —
- Total cash needed
- —
Loan-product check · same deal, 3 products live
Conventional
25% down · 7.5% · 30yr
- Down + closing
- —
- Monthly P&I
- —
- Monthly cashflow
- —
- DSCR
- —
- Eligible?
- —
Personal DTI + credit; lowest rate.
DSCR
20% down · 8.5% · 30yr
- Down + closing
- —
- Monthly P&I
- —
- Monthly cashflow
- —
- DSCR
- —
- Eligible?
- —
No personal income docs; deal must DSCR.
Hard money
10% down · 12.0% · 12mo
- Down + closing
- —
- Monthly P&I
- —
- Monthly cashflow
- —
- DSCR
- —
- Eligible?
- —
Short-term bridge; refi at stabilization.
Rent comps 12 comps
| Address | Beds | Baths | Sqft | Rent | $/sqft | DOM | Units | Dist |
|---|---|---|---|---|---|---|---|---|
| 2816 Profitt Path Edgewood, MD | 4.0 | 3.0 | 1660 | $2,900 | $1.75 | 45d | 1 | 0.26mi |
| 619 Hartwood Ln Edgewood, MD | 4.0 | 1.5 | 1716 | $2,300 | $1.34 | 45d | 1 | 0.41mi |
| 313 Winterberry Dr Edgewood, MD | 3.0 | 2.5 | 1798 | $2,095 | $1.17 | 22d | 1 | 0.53mi |
| 2120 Cedar Dr Apt F Edgewood, MD | 3.0 | 1.5 | 1000 | $1,295 | $1.29 | 45d | 1 | 0.82mi |
| 3184 Ebbtide Dr Edgewood, MD | 3.0 | 3.0 | 1224 | $2,600 | $2.12 | 22d | 1 | 0.91mi |
| 3184 Ebbtide Dr Edgewood, MD | 3.0 | 3.0 | 1224 | $2,600 | $2.12 | 45d | 1 | 0.91mi |
| 8 Lasonia Ct Edgewood, MD | 3.0 | 3.0 | 1468 | $2,224 | $1.51 | 17d | 1 | 0.93mi |
| 2033 Armstrong St Edgewood, MD | 1.0–4.0 | 1.0–2.0 | 1000 | $1,766 | $1.77 | 0d | 8 | 1.10mi |
| 1046 Agate Dr Unit 1 Edgewood, MD | 4.0 | 2.5 | 1440 | $2,150 | $1.49 | 19d | 1 | 1.13mi |
| 2828 Beckon Dr Edgewood, MD | 3.0 | 2.5 | 1764 | $2,300 | $1.30 | 45d | 1 | 1.21mi |
| 2842 Beckon Dr Unit 1 Edgewood, MD | 4.0 | 1.5 | 1296 | $2,100 | $1.62 | 45d | 1 | 1.23mi |
| 705 Bayberry Rd Edgewood, MD | 3.0 | 1.5 | 1657 | $2,600 | $1.57 | 19d | 1 | 1.40mi |
Listing history 7 events
-
2026-06-21days on market $79,500 Active 8 DOM
-
2026-06-18days on market $79,500 Active 5 DOM
-
2026-06-17days on market $79,500 Active 4 DOM
-
2026-06-16days on market $79,500 Active 3 DOM
-
2026-06-15days on market $79,500 Active 2 DOM
-
2026-06-13remarks 640-char remark
-
2026-06-13$79,500 Active 1 DOM
ⓘ Source: listings_history table (triggers on properties + properties_extension) + one-shot
backfill from property_details.listing_events for pre-trigger history.
Nearby sold comps map
Loading sold comps map…
Walkable amenities ~0.75 mi
Loading nearby amenities…
Taxation est. · year 1
- Rental income
- $27,666
- − Mortgage interest
- −$4,453
- − Property taxes
- −$1,192
- − Insurance
- −$398
- − Repairs & maintenance
- −$2,213
- − Management
- −$2,213
- − Depreciation
- −$2,313
- Taxable income
- $14,884
- Est. tax owed @ 24.0%
- −$3,572
- After-tax cash flow
- $11,691/yr
For passive investors: Depreciation is non-cash, so a rental often shows a tax loss while cash-flowing — sheltering income. Rental losses are passive: they offset passive income freely, and up to $25,000/yr can offset ordinary (W-2) income if you actively participate and your MAGI is under $100k (phasing out to $0 by $150k); unused losses carry forward. On sale, claimed depreciation is recaptured at up to 25%, and gains may owe capital-gains tax (a 1031 exchange can defer both). Figures are a year-1 estimate at your 24.0% rate — not tax advice; consult a CPA.
Condition & rehab AI · 13 photos
This home is in excellent condition with no visible repairs or maintenance needed. It is move-in ready and has high-end upgrades, making it a great investment.
Value-add opportunities
- Both Painting the exterior siding — A fresh coat of paint can enhance the curb appeal and increase the home's value.
- Both Landscaping improvements — Enhancing the landscaping can improve the home's curb appeal and increase its value.
Renovation cost estimate screening
Value-add ROI direction
- Both Painting the exterior siding — A fresh coat of paint can enhance the curb appeal and increase the home's value. ↑
- Both Landscaping improvements — Enhancing the landscaping can improve the home's curb appeal and increase its value. ↑
ⓘ Cost ranges are severity-bucket heuristics (US national rule-of-thumb). Get contractor quotes + a written scope before underwriting a rehab budget.
Schools (NCES district)
- District
- Harford County Public Schools
- NCES district ID
- 2400390
- Math proficiency
- 22% ▼ -23.00%
- Reading proficiency
- 39% ▼ -12.00%
- Median HH income
- $79,569
- Composite
- 29.38/100
- National rank
- #6527
- State rank
- #9 of 24 in MD
Livability — Edgewood
- Score
- 73/100
- State rank
- #118
- US rank
- #4991
Category grades
Schools grade is shown separately in the Schools card above.
Census & demographics
- Census place
- Edgewood, MD
- County
- Harford County · 198,512 people
- City population
- 24,960
- Metro
- Baltimore-Columbia-Towson, MD
- Population (ZIP)
- 24,960
- Household income
- $81,704
- Rent vs Own
- Severe rent burden
- 859.0
Population outlook (Harford County) Hauer SSP2
- Today (2025)
- 262,292 people
- By 2030
- 266,437 · +1.6%
- By 2040
- 269,954 · +2.9%
- By 2050
- 265,659 · +1.3%
- By 2075
- 252,886 · -3.6%
- By 2100
- 224,014 · -14.6%
Race, ethnicity, and origin ACS 2023
- Neighborhood character
- Diverse neighborhood (Simpson 0.66)
- Race & ethnicity
- Black 45% White 36% Two or more races 11% Hispanic / Latino 10% Asian 2%
- Hispanic origin (detail)
- Mexican 1% Puerto Rican 2%
- Common ancestry
- Romanian 4% Slovak 1% Italian 1%
- Foreign-born
- 8% · Canada, South Korea
- Languages at home
- 89% English-only · Spanish 5% Russian/Polish/Slavic 2% German/W. Germanic 1%
Political lean MEDSL · Harford
- 2024 margin
- R (+13.8) · D 41.9% · R 55.7% · Other 2.4%
- 2008→2024 swing
- +5.0pp toward D · 2008: -18.8pp · 2024: -13.8pp
- All cycles
- 2024: R+13.8 2020: R+12.0 2016: R+24.5 2012: R+19.5 2008: R+18.8
Not yet ingested
- Civics
- —
Market trends
- HPI YoY
- ▼ -106.14%
- Current HPI
- 254.2305
- Rent YoY
- ▲ 4.92%
- Metro
- Baltimore-Columbia-Towson, MD
- State GDP YoY
- ▲ 2.97%
- F500 in state
- 12
Industry mix (Fortune 500 HQ in MD)
| Industry | F500 HQs | Revenue |
|---|---|---|
| Aerospace / Defense | 1 | $71B |
|
||
| Utilities | 1 | $25B |
|
||
| Hotels | 1 | $24B |
|
||
| Consumer Goods | 1 | $7B |
|
||
| Real Estate | 1 | $6B |
|
||
| Chemicals | 1 | $2B |
|
||
Price history
+0.0% since first listed2 events — show timeline
- 2026-06-13 Listed $79,500 BRIGHT MLS
- 2026-06-10 Coming Soon $79,500 BRIGHT MLS
Cash-flow waterfall
monthlySold comps — $/sqft
last 12 mo · ≤1 miLoading sold comps…