837 Denmark St · Louisville, KY
Flood risk No data
- FEMA flood zone
- —
- Chance of flooding over 30 yrs
- —
- Est. flood insurance / yr
- —
Fire risk No data
- Est. fire insurance / yr
- —
Heat risk No data
- Hot days now (above threshold)
- —
- Hot days in 30 yrs
- —
Wind risk No data
- Chance of severe wind over 30 yrs
- —
Air-quality risk No data
- Unhealthy air days now
- —
- Unhealthy air days in 30 yrs
- —
Risk factors via First Street. Map © Google.
Why this score? — see what drove the C+ grade
The composite is a weighted blend of 9 inputs, each scored 0–100. Each bar is that input's sub-score; the figure is the points it added to the 100-point composite (weight × sub-score).
- Cash flow +21.8/30.0
- ARV discount +15.0/15.0
- DSCR +7.0/10.0
- 1% rule +5.7/10.0
- Rent growth +3.8/5.0
- Livability +3.2/5.0
- Condition / age +2.5/5.0
- Schools +2.3/10.0
- Appreciation +0.0/10.0
$150,000
🖨 Deal sheet 📄 Offer letter ✓ Due diligence
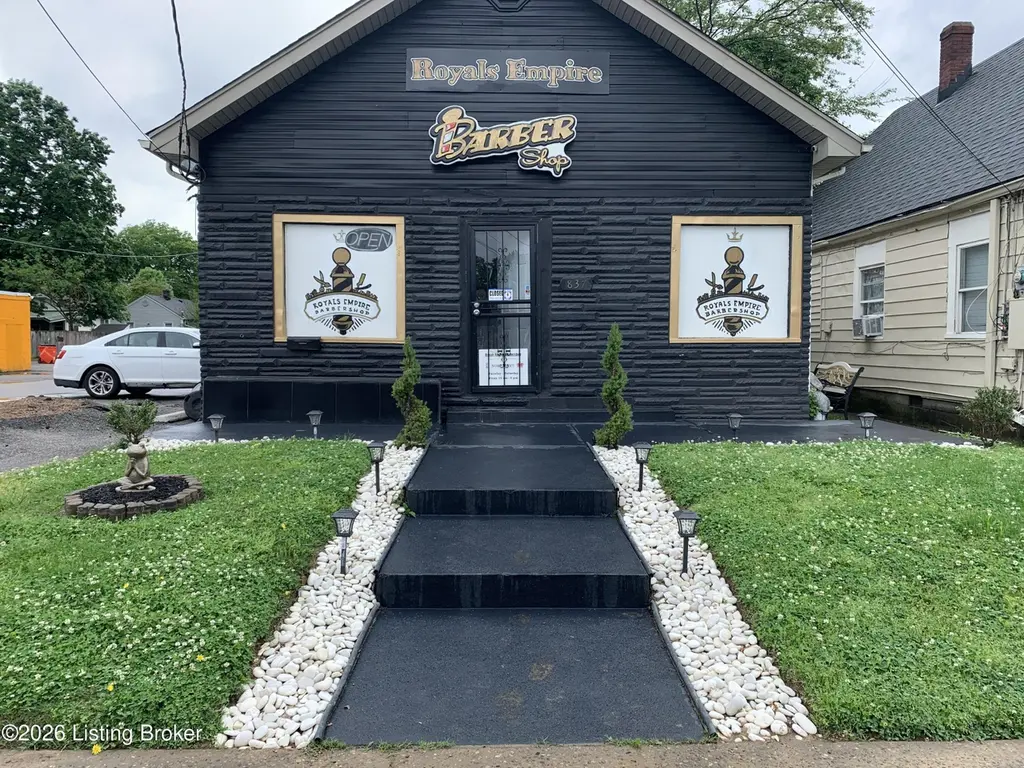
Listing remarks
Investment Opportunity centrally located in South Louisville! Corner Lot Duplex-, Barber Shop currently on one side, 2 bedroom apt on the other. Privacy Fenced yard in the rear.
Key facts
- Corner lot duplex
- Privacy fenced yard
- 4 parking spots
Tags
Property features AI
Finance
- Other: Project facilities marked 'See Remarks' (additional multi-unit details noted)
- Financial info: First-level unit rent listed as $2,400 (unit-level rent indicated); Separate meters not present
- HOA & community: No association fee
Exterior
- Parking: 4 parking spaces (not covered)
- Utilities: Electricity connected; Natural gas available; Owner pays electric, gas, water, and sewer for leased units; Tenant responsible for cable
- Home design: Duplex property; Shotgun architectural style; 2 total units (one unit referenced on 1st level); 1 story for the described unit / main living on 1st level; Built in 1925
- Construction: Wood frame construction; Shingle roof; Living/building area reported as 1,272 total
- Exterior features: No notable exterior features listed
Interior
- Kitchen: Kitchen on the 1st level; Range present; Refrigerator present
- Bedrooms: 2 bedrooms (both on the 1st level)
- Bathrooms: 1 full bath and 1 partial bath (1st level)
- Heating & cooling: Natural gas heating; Central air conditioning
- Interior features: Shotgun-style layout; Basement present
- Laundry & utility: Laundry area on the 1st level; 1 furnace
Neighborhood map
What this means for you Summary
Snapshot
- This is a 4-bed/3.0-bath single-family listed at $150k.
Deal economics
- At list price, monthly cash flow is $233 ($3k/yr) — positive.
- The deal already cash-flows at list — no discount required.
- Meets the 1% rule at list price ($2k rent vs $150k).
- Recommended offer: $146k (3.0% below list) — sets the bar for market timing.
- Cap rate 8.2% vs local median 5.0% in Louisville — top-decile yield for the area; either an underpriced asset or a hidden risk that comps aren't pricing in. Stress-test before assuming the spread holds.
Location & tenants
- Location reads 63/100 on livability (#333 in KY) — a middle-class / working-renter tenant base. Strengths: cost of living A+, housing A+; Watch: employment C-, health & safety D+, schools D-.
- Jefferson County (urban): math 19% / reading 35% proficiency, ranked #121 of 165 in KY (top 73%) — low school quality limits family demand, transient renter base, plan for 1-2y turnover.
- Market conditions: Rents rising fast (+5.2%/yr); 121 active listings in the ZIP; 29 comparable units currently listed for rent nearby; rentals at typical pace (median 16d on market — plan ~3-4 weeks tenant-placement turnaround); lower-income renter base — watch delinquency; 2,836 units permitted in Jefferson County in 2024 (1,558 in 5+ unit buildings).
- This rent runs 44% of the median local income ($44k/yr) — at the standard rent-burdened threshold; future hikes will face affordability resistance.
Forward outlook
- Local home prices are declining (-3.0%/yr); year-one equity from $1k of loan paydown is wiped out by about $4k of value loss. Plan a longer hold.
- Jefferson County population projected at +13% by 2050 — modest demand growth; plan on rents tracking national, not racing it.
Negotiation context
- It's been on market 33 days — a 3% lower offer ($146k) is reasonable based on typical stale-listing flexibility.
- 2 sale attempts since 25y ago; this cycle's ask has dropped $30k (17%) from the opening price — seller is motivated, your offer sets the floor, not the list.
Risks & watch-outs
- Watch-outs: built in 1925 — expect roof / HVAC / electrical / plumbing capex.
Questions for the listing agent
- It's been on market 33 days. Have you received any prior offers? Is the seller open to a 3% concession, seller financing, or rate buy-down credit?
- Built in 1925 — when were the roof, HVAC, electrical panel, plumbing, and water heater last replaced?
- Is there a deadline driving the sale (1031 exchange, divorce, estate, relocation)? That informs how much negotiation room exists.
- Schools are D-rated, which usually means shorter tenancies and higher turnover. Who's the typical renter profile here, and what's been the actual vacancy rate?
- Crime grade is F in this area — have there been break-ins, vandalism, or insurance claims at this property in the last 3 years? What carrier currently insures it and at what premium?
- What's the average days-on-market for RENTAL listings here right now (not sales)? A rising rental-DOM trend means longer vacancies and softer asking-rent achievability than the comps imply.
- What's the recent tenant-quality profile in this submarket — average credit score on applications, eviction rate, late-payment / NSF rate, and stable-employment percentage? A property-management company in the area should have these aggregated.
- How much new for-sale + rental construction is in the pipeline within 1–3 miles? Heavy new supply typically softens prices + rents 12–24 months out; constrained supply supports both.
Investment metrics
- 1% rule
- 1.07% ✓
- Cap rate
- 8.16%
- Cash-on-cash
- 6.65%
- DSCR
- 1.30
- GRM
- 7.8
CMA / ARV
- ARV (on-the-fly)
- $184,440
- Comps found
- 12
Show comp detail 12 sales within ~0.75 mi
| Address | Dist | Beds/Ba | Sqft | Sold | Price | $/sf | Match |
|---|---|---|---|---|---|---|---|
| 824 Dresden Ave | 0.11mi | 4/2.0 | 1,225 (-4%) | 2mo | $173,000 | $141 | 84 |
| 4519 S 6th St | 0.65mi | 5/2.5 (+1) | 1,274 (+0%) | 1mo | $185,000 | $145 | 62 |
| 576 Longfield Ave | 0.22mi | 3/1.0 (-1) | 1,414 (+11%) | 1mo | $179,300 | $127 | 57 |
| 550 Longfield Ave | 0.28mi | 3/1.0 (-1) | 1,096 (-14%) | 2mo | $130,000 | $119 | 49 |
| 548 Camden Ave | 0.30mi | 3/1.0 (-1) | 1,100 (-14%) | 2mo | $180,000 | $164 | 48 |
| 3668 Woodruff Ave | 0.62mi | 3/3.0 (-1) | 1,158 (-9%) | 6mo | $212,500 | $184 | 46 |
| 1125 Homeview Dr | 0.74mi | 3/1.0 (-1) | 1,230 (-3%) | 2mo | $125,000 | $102 | 45 |
| 1310 Southgate Ave | 0.61mi | 3/1.0 (-1) | 1,163 (-9%) | 1mo | $159,900 | $137 | 44 |
| 1317 Arcade Ave | 0.73mi | 4/1.0 | 1,170 (-8%) | 2mo | $125,000 | $107 | 43 |
| 3535 Kahlert Ave | 0.66mi | 4/1.0 | 1,150 (-10%) | 4mo | $175,000 | $152 | 41 |
| 3611 Woodruff Ave | 0.54mi | 3/1.0 (-1) | 1,125 (-12%) | 1mo | $175,000 | $156 | 41 |
| 3670 Woodruff Ave | 0.63mi | 3/1.0 (-1) | 1,102 (-13%) | 4mo | $159,500 | $145 | 32 |
Match score weights: distance 35% · size 25% · config 20% · recency 20%. Top-matched comps best support the ARV.
Projected returns pro-forma
-3.0% appreciation · 5.16% rent growth · sell at horizon
- IRR
- -3.7%
- Equity multiple
- 0.86×
- Total profit
- $-5,884
- Equity at exit
- $22,365
- IRR
- 8.4%
- Equity multiple
- 1.70×
- Total profit
- $29,372
- Equity at exit
- $12,969
Cash invested: $42,000 (down + closing). Projections, not guarantees.
Landlord ↔ Tenant lean methodology
- Overall (STATE)
- 83 Strongly Landlord-Friendly
- State Kentucky
- 83 Strongly Landlord-Friendly · R+16
- County
- — inherits STATE
- City
- — inherits STATE
ZIP-level market 40215
- Home prices YoY
- -34.4%
- Rents YoY
- 5.2%
- Active inventory
- 121
- Price-to-rent
- 7.8×
Monthly cashflow live
- Estimated rent
- $1,607 high interval (Pro) →
- Mortgage (P&I)
- −$787
- Tax est. 1.5%
- −$188 /mo · $2,250/yr
- Insurance
- −$62
- HOA
- −$0
- Vacancy / Maint / Mgmt
- −$337
- Net cashflow
- $233
Break-even live
UW: 25.0% down · 7.5% · 30yr · 1.5% tax · 5.0% vac · 8.0% maint · 8.0% mgmt
Financing live
Cash to close
- Down payment
- $37,500
- Closing costs
- $4,500
- Reserves months
- —
- Total cash needed
- —
Loan-product check · same deal, 3 products live
Conventional
25% down · 7.5% · 30yr
- Down + closing
- —
- Monthly P&I
- —
- Monthly cashflow
- —
- DSCR
- —
- Eligible?
- —
Personal DTI + credit; lowest rate.
DSCR
20% down · 8.5% · 30yr
- Down + closing
- —
- Monthly P&I
- —
- Monthly cashflow
- —
- DSCR
- —
- Eligible?
- —
No personal income docs; deal must DSCR.
Hard money
10% down · 12.0% · 12mo
- Down + closing
- —
- Monthly P&I
- —
- Monthly cashflow
- —
- DSCR
- —
- Eligible?
- —
Short-term bridge; refi at stabilization.
Rent comps 29 comps
| Address | Beds | Baths | Sqft | Rent | $/sqft | DOM | Units | Dist |
|---|---|---|---|---|---|---|---|---|
| 925 W Evelyn Ave Louisville, KY | 3.0 | 1.5 | 1520 | $1,650 | $1.09 | 24d | 1 | 0.09mi |
| 910 W Whitney Ave Louisville, KY | 3.0 | 1.0 | 1186 | $1,450 | $1.22 | 2d | 1 | 0.16mi |
| 910 W Whitney Ave Louisville, KY | 3.0 | 1.0 | 1186 | $1,450 | $1.22 | 12d | 1 | 0.16mi |
| 551 Denmark St Louisville, KY | 3.0 | 1.5 | 1160 | $1,700 | $1.47 | 24d | 1 | 0.22mi |
| 615 Dresden Ave Louisville, KY | 3.0 | 1.0 | 884 | $1,450 | $1.64 | 24d | 1 | 0.25mi |
| 3860 Southern Pkwy Louisville, KY | 3.0 | 1.0 | 1064 | $1,250 | $1.17 | 24d | 1 | 0.45mi |
| 4133 S 5th St Louisville, KY | 4.0 | 1.0 | 1200 | $1,435 | $1.20 | 16d | 1 | 0.46mi |
| 4007 Southern Pkwy Unit 1 Louisville, KY | 4.0 | 1.0 | 1500 | $1,395 | $0.93 | 3d | 1 | 0.47mi |
| 3909 Southern Pkwy Unit 2 Louisville, KY | 3.0 | 1.0 | 1000 | $1,100 | $1.10 | 3d | 1 | 0.48mi |
| 310 W Kenton St Louisville, KY | 3.0 | 2.0 | 1295 | $1,350 | $1.04 | 24d | 1 | 0.52mi |
| 4513 S 6th St Louisville, KY | 3.0 | 2.0 | 1581 | $2,650 | $1.68 | 24d | 1 | 0.64mi |
| 1522 Clara Ave Louisville, KY | 3.0 | 2.0 | 1150 | $1,150 | $1.00 | 24d | 1 | 0.74mi |
| 3102 Grant Ave Louisville, KY | 4.0 | 2.0 | 1603 | $1,595 | $1.00 | 24d | 1 | 0.78mi |
| 3717 Wheeler Ave Louisville, KY | 3.0 | 2.0 | 1124 | $1,450 | $1.29 | 24d | 1 | 0.82mi |
| 3746 Kahlert Ave Louisville, KY | 3.0 | 1.0 | 955 | $1,350 | $1.41 | 16d | 1 | 0.85mi |
| 4010 Taylor Blvd Louisville, KY | 4.0 | 2.0 | 1612 | $3,000 | $1.86 | 16d | 1 | 0.87mi |
| 2826 Taylor Blvd Louisville, KY | 3.0 | 1.0 | 1044 | $1,345 | $1.29 | 24d | 1 | 0.90mi |
| 119 E Southern Heights Ave Louisville, KY | 3.0 | 1.0 | 1000 | $1,250 | $1.25 | 24d | 1 | 0.92mi |
| 3627 Parthenia Ave Louisville, KY | 3.0 | 1.0 | 900 | $1,245 | $1.38 | 24d | 1 | 0.95mi |
| 1301 Lillian Ave Louisville, KY | 3.0 | 1.0 | 974 | $1,250 | $1.28 | 16d | 1 | 1.00mi |
| 315 M St Unit 101 Louisville, KY | 3.0 | 1.5 | 1200 | $1,800 | $1.50 | 12d | 1 | 1.09mi |
| 3524 Georgetown Cir Louisville, KY | 1.0–3.0 | 1.0 | 684 | $1,350 | $1.97 | 24d | 2 | 1.13mi |
| 3524 Georgetown Cir Unit 3530 Louisville, KY | 3.0 | 1.0 | 886 | $1,350 | $1.52 | 3d | 1 | 1.13mi |
| 3524 Georgetown Cir Louisville, KY | 1.0–3.0 | 1.0 | 684 | $1,350 | $1.97 | 15d | 4 | 1.13mi |
| 2711 S 3rd St Unit 1 Louisville, KY | 4.0 | 2.0 | 1800 | $2,400 | $1.33 | 12d | 1 | 1.15mi |
| 4000 Churchman Ave Louisville, KY | 3.0 | 1.0 | 1000 | $1,200 | $1.20 | 16d | 1 | 1.16mi |
| 1147 Lincoln Ave Louisville, KY | 4.0 | 1.0 | 1323 | $1,295 | $0.98 | 3d | 1 | 1.22mi |
| 510 Colorado Ave Louisville, KY | 3.0 | 2.0 | 1500 | $1,750 | $1.17 | 24d | 1 | 1.35mi |
| 2501 S 4th St Louisville, KY | 1.0–3.0 | 1.0–3.0 | 897 | $6,345 | $7.07 | 3d | 1 | 1.37mi |
Listing history 17 events
-
2026-06-18price $150,000 Active 33 DOM
-
2026-06-18days on market $160,000 Active 33 DOM
-
2026-06-17days on market $160,000 Active 32 DOM
-
2026-06-16days on market $160,000 Active 31 DOM
-
2026-06-15days on market $160,000 Active 30 DOM
-
2026-06-13days on market $160,000 Active 28 DOM
-
2026-06-10days on market $160,000 Active 25 DOM
-
2026-06-09days on market $160,000 Active 24 DOM
-
2026-06-08days on market $160,000 Active 23 DOM
-
2026-06-07pricedays on market $160,000 Active 22 DOM
-
2026-06-03days on market $180,000 Active 18 DOM
-
2026-06-02days on market $180,000 Active 17 DOM
-
2026-06-01days on market $180,000 Active 16 DOM
-
2026-05-31days on market $180,000 Active 15 DOM
-
2026-05-17$180,000 Active
-
2001-07-16historical
-
2001-02-16$75,000
ⓘ Source: listings_history table (triggers on properties + properties_extension) + one-shot
backfill from property_details.listing_events for pre-trigger history.
Nearby sold comps map
Loading sold comps map…
Walkable amenities ~0.75 mi
Loading nearby amenities…
Taxation est. · year 1
- Rental income
- $19,283
- − Mortgage interest
- −$8,402
- − Property taxes
- −$2,250
- − Insurance
- −$750
- − Repairs & maintenance
- −$1,543
- − Management
- −$1,543
- − Depreciation
- −$4,364
- Taxable income
- $432
- Est. tax owed @ 24.0%
- −$104
- After-tax cash flow
- $2,691/yr
For passive investors: Depreciation is non-cash, so a rental often shows a tax loss while cash-flowing — sheltering income. Rental losses are passive: they offset passive income freely, and up to $25,000/yr can offset ordinary (W-2) income if you actively participate and your MAGI is under $100k (phasing out to $0 by $150k); unused losses carry forward. On sale, claimed depreciation is recaptured at up to 25%, and gains may owe capital-gains tax (a 1031 exchange can defer both). Figures are a year-1 estimate at your 24.0% rate — not tax advice; consult a CPA.
Schools (NCES district)
- District
- Jefferson County
- NCES district ID
- 2102990
- Math proficiency
- 19% ▼ -17.00%
- Reading proficiency
- 35% ▼ -11.00%
- Median HH income
- $47,885
- Composite
- 23.45/100
- National rank
- #7884
- State rank
- #121 of 165 in KY
Livability — Louisville
- Score
- 63/100
- State rank
- #333
- US rank
- #15887
Category grades
Schools grade is shown separately in the Schools card above.
Census & demographics
- Census place
- Louisville, KY
- County
- Jefferson County · 790,184 people
- City population
- 769,292
- Metro
- Louisville/Jefferson County, KY-IN
- Population (ZIP)
- 20,532
- Household income
- $43,725
- Rent vs Own
- Severe rent burden
- 997.0
Population outlook (Jefferson County) Hauer SSP2
- Today (2025)
- 823,112 people
- By 2030
- 849,343 · +3.2%
- By 2040
- 895,696 · +8.8%
- By 2050
- 933,630 · +13.4%
- By 2075
- 1,028,262 · +24.9%
- By 2100
- 1,072,675 · +30.3%
Race, ethnicity, and origin ACS 2023
- Neighborhood character
- Diverse neighborhood (Simpson 0.63)
- Race & ethnicity
- White 51% Black 33% Two or more races 11% Hispanic / Latino 6% Asian 2%
- Hispanic origin (detail)
- Mexican 2% Cuban 3%
- Common ancestry
- Slovak 1% Romanian 1% Serbian 1%
- Foreign-born
- 9% · Canada, Vietnam
- Languages at home
- 88% English-only · Spanish 5% Other Indo-European 2% Arabic 1%
Political lean MEDSL · Jefferson
- 2024 margin
- D (+16.6) · D 57.4% · R 40.9% · Other 1.7%
- 2008→2024 swing
- +4.5pp toward D · 2008: 12.0pp · 2024: 16.6pp
- All cycles
- 2024: D+16.6 2020: D+20.1 2016: D+13.3 2012: D+11.1 2008: D+12.0
Not yet ingested
- Civics
- —
Market trends
- HPI YoY
- ▼ -119.35%
- Current HPI
- 227.8248
- Rent YoY
- ▲ 5.16%
- Metro
- Louisville/Jefferson County, KY-IN
- State GDP YoY
- ▲ 1.81%
- F500 in state
- 4
Industry mix (Fortune 500 HQ in KY)
| Industry | F500 HQs | Revenue |
|---|---|---|
| Healthcare | 1 | $118B |
|
||
| Food / Beverage | 1 | $7B |
|
||
Price history
+140.0% since first listed3 events — show timeline
- 2026-05-17 Listed $180,000 Metro Search MLS
- 2001-07-16 Listing Removed — Metro Search MLS
- 2001-02-16 Listed $75,000 Metro Search MLS
Cash-flow waterfall
monthlySold comps — $/sqft
last 12 mo · ≤1 miLoading sold comps…