220 S Franklin · Sidney, OH
Flood risk 4/10 · Minor
- FEMA flood zone
- X (unshaded)
- Chance of flooding over 30 yrs
- 0.22%
- Est. flood insurance / yr
- $473 – $860
Fire risk 1/10 · Minimal
- Est. fire insurance / yr
- $713 – $1,323
Heat risk 3/10 · Minor
- Hot days now (above 100°F)
- 7 days/yr
- Hot days in 30 yrs
- 19 days/yr
Wind risk 2/10 · Minimal
- Chance of severe wind over 30 yrs
- —
Air-quality risk 2/10 · Minimal
- Unhealthy air days now
- 1 days/yr
- Unhealthy air days in 30 yrs
- 2 days/yr
Risk factors via First Street. Map © Google.
Why this score? — see what drove the B- grade
The composite is a weighted blend of 9 inputs, each scored 0–100. Each bar is that input's sub-score; the figure is the points it added to the 100-point composite (weight × sub-score).
- Cash flow +30.0/30.0
- 1% rule +10.0/10.0
- DSCR +10.0/10.0
- ARV discount +7.5/15.0
- Schools +4.2/10.0
- Livability +3.8/5.0
- Rent growth +2.5/5.0
- Condition / age +1.0/5.0
- Appreciation +0.0/10.0
$39,900
🖨 Deal sheet 📄 Offer letter ✓ Due diligence
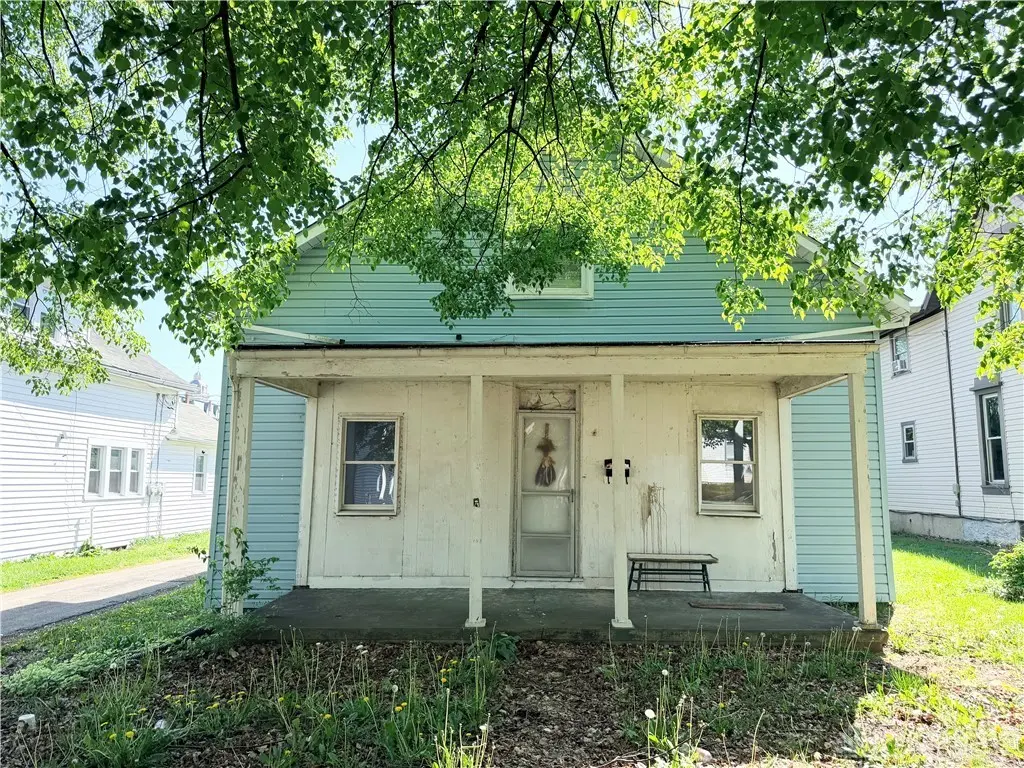
Listing remarks
This 2-bedroom, 1.5-bath home is being sold as is and is ready for your vision. The main floor features a convenient half bath, while upstairs you’ll find two bedrooms and a full bathroom. With a functional layout and great potential, this property is ideal for investors or buyers looking to renovate and add value.
Key facts
- Built 1881
Neighborhood map
What this means for you Summary
Snapshot
- This is a 2-bed/1.5-bath single-family listed at $40k. Condition is rated poor.
Deal economics
- At list price, monthly cash flow is $679 ($8k/yr) — positive.
- The deal already cash-flows at list — no discount required.
- Meets the 1% rule at list price ($1k rent vs $40k).
- Cap rate 26.7% vs local median 4.1% in Sidney — top-decile yield for the area; either an underpriced asset or a hidden risk that comps aren't pricing in. Stress-test before assuming the spread holds.
Location & tenants
- Location reads 76/100 on livability (#220 in OH, #3,412 nationally) — a middle-class / working-renter tenant base. Strengths: cost of living A+, housing A+, health & safety A+; Watch: crime C-, employment C-, amenities D.
- Sidney City (town): math 46% / reading 52% proficiency, ranked #454 of 656 in OH (top 69%) — families likely to look elsewhere, expect single-tenant / working-renter base with shorter leases.
- Market conditions: 145 active listings in the ZIP; 5 comparable units currently listed for rent nearby; rentals leasing fast (median 13d on market — plan ~1-2 weeks tenant-placement turnaround); 337 units permitted in Shelby County in 2024 (216 in 5+ unit buildings).
Forward outlook
- Local home prices are declining (-3.0%/yr); year-one equity from $276 of loan paydown is wiped out by about $1k of value loss. Plan a longer hold.
- Shelby County population projected at -18% by 2050 — secular population decline; favor cash flow + early exit over multi-decade hold.
- At projected returns (-3.0% appreciation + 3.0% rent growth), your $11k cash investment doubles in ~2 years — after that, you're playing with house money.
Negotiation context
- Only 1 days on market — expect competitive offers; lowballing is unlikely to land.
Risks & watch-outs
- Watch-outs: built in 1881 — expect roof / HVAC / electrical / plumbing capex.
Questions for the listing agent
- Have any recent inspections been done? Can we get a copy of the seller's disclosures and any deferred-maintenance estimates?
- Built in 1881 — when were the roof, HVAC, electrical panel, plumbing, and water heater last replaced?
- Is there a deadline driving the sale (1031 exchange, divorce, estate, relocation)? That informs how much negotiation room exists.
- What's the average days-on-market for RENTAL listings here right now (not sales)? A rising rental-DOM trend means longer vacancies and softer asking-rent achievability than the comps imply.
- What's the recent tenant-quality profile in this submarket — average credit score on applications, eviction rate, late-payment / NSF rate, and stable-employment percentage? A property-management company in the area should have these aggregated.
- How much new for-sale + rental construction is in the pipeline within 1–3 miles? Heavy new supply typically softens prices + rents 12–24 months out; constrained supply supports both.
Investment metrics
- 1% rule
- 3.03% ✓
- Cap rate
- 26.71%
- Cash-on-cash
- 72.93%
- DSCR
- 4.24
- GRM
- 2.8
CMA / ARV
- ARV (on-the-fly)
- $159,600
- Comps found
- 12
Show comp detail 12 sales within ~0.75 mi
| Address | Dist | Beds/Ba | Sqft | Sold | Price | $/sf | Match |
|---|---|---|---|---|---|---|---|
| 220 S Franklin | 0.00mi | 2/1.5 | 1,596 (0%) | 1mo | $42,000 | $26 | 100 |
| 717 Taft St | 0.40mi | 3/1.0 (+1) | 1,571 (-2%) | 5mo | $150,000 | $95 | 68 |
| 747 Chestnut Ave | 0.48mi | 3/1.5 (+1) | 1,548 (-3%) | 6mo | $159,900 | $103 | 62 |
| 544 Michigan St | 0.42mi | 3/1.0 (+1) | 1,456 (-9%) | 0mo | $145,000 | $100 | 58 |
| 900 Center St | 0.71mi | 3/1.0 (+1) | 1,618 (+1%) | 1mo | $285,000 | $176 | 57 |
| 527 Linden Ave | 0.59mi | 3/1.0 (+1) | 1,680 (+5%) | 1mo | $162,000 | $96 | 56 |
| 418 S Wagner Ave | 0.54mi | 3/2.0 (+1) | 1,506 (-6%) | 5mo | $228,000 | $151 | 54 |
| 716 Taft St | 0.39mi | 3/1.0 (+1) | 1,792 (+12%) | 1mo | $178,000 | $99 | 53 |
| 619 S Miami Ave | 0.42mi | 3/1.0 (+1) | 1,454 (-9%) | 8mo | $125,000 | $86 | 52 |
| 512 Sycamore Ave | 0.58mi | 3/1.0 (+1) | 1,718 (+8%) | 5mo | $104,000 | $61 | 49 |
| 808 N Main Ave | 0.75mi | 3/1.5 (+1) | 1,476 (-8%) | 1mo | $160,000 | $108 | 47 |
| 206 Charles Ave | 0.63mi | 3/2.0 (+1) | 1,382 (-13%) | 4mo | $224,000 | $162 | 38 |
Match score weights: distance 35% · size 25% · config 20% · recency 20%. Top-matched comps best support the ARV.
Projected returns pro-forma
-3.0% appreciation · 3.0% rent growth · sell at horizon
- IRR
- 72.7%
- Equity multiple
- 4.29×
- Total profit
- $36,796
- Equity at exit
- $5,949
- IRR
- 76.5%
- Equity multiple
- 8.86×
- Total profit
- $87,799
- Equity at exit
- $3,450
Cash invested: $11,172 (down + closing). Projections, not guarantees.
Landlord ↔ Tenant lean methodology
- Overall (STATE)
- 73 Landlord-Friendly
- State Ohio
- 73 Landlord-Friendly · R+6
- County
- — inherits STATE
- City
- — inherits STATE
ZIP-level market 45365
- Home prices YoY
- -20.1%
- Active inventory
- 145
- Price-to-rent
- 2.8×
Monthly cashflow live
- Estimated rent
- $1,208 high interval (Pro) →
- Mortgage (P&I)
- −$209
- Tax est. 1.5%
- −$50 /mo · $598/yr
- Insurance
- −$17
- HOA
- −$0
- Vacancy / Maint / Mgmt
- −$254
- Net cashflow
- $679
Break-even live
UW: 25.0% down · 7.5% · 30yr · 1.5% tax · 5.0% vac · 8.0% maint · 8.0% mgmt
Financing live
Cash to close
- Down payment
- $9,975
- Closing costs
- $1,197
- Reserves months
- —
- Total cash needed
- —
Loan-product check · same deal, 3 products live
Conventional
25% down · 7.5% · 30yr
- Down + closing
- —
- Monthly P&I
- —
- Monthly cashflow
- —
- DSCR
- —
- Eligible?
- —
Personal DTI + credit; lowest rate.
DSCR
20% down · 8.5% · 30yr
- Down + closing
- —
- Monthly P&I
- —
- Monthly cashflow
- —
- DSCR
- —
- Eligible?
- —
No personal income docs; deal must DSCR.
Hard money
10% down · 12.0% · 12mo
- Down + closing
- —
- Monthly P&I
- —
- Monthly cashflow
- —
- DSCR
- —
- Eligible?
- —
Short-term bridge; refi at stabilization.
Rent comps 5 comps
| Address | Beds | Baths | Sqft | Rent | $/sqft | DOM | Units | Dist |
|---|---|---|---|---|---|---|---|---|
| 314 Thompson St Sidney, OH | 3.0 | 1.0 | 1352 | $1,200 | $0.89 | 2d | 1 | 0.40mi |
| 803 S Main Ave Sidney, OH | 2.0 | 1.0 | 1104 | $1,100 | $1.00 | 43d | 1 | 0.49mi |
| 803 S Main Ave Sidney, OH | 2.0 | 1.0 | 1104 | $1,030 | $0.93 | 2d | 1 | 0.49mi |
| 805 S Main Ave Sidney, OH | 3.0 | 1.0 | 1423 | $1,400 | $0.98 | 21d | 1 | 0.49mi |
| 1402 N Main Ave Sidney, OH | 3.0 | 1.0 | 1544 | $1,300 | $0.84 | 12d | 1 | 1.15mi |
Listing history 2 events
-
2026-04-26status Pending
-
2026-04-25$39,900 Active
ⓘ Source: listings_history table (triggers on properties + properties_extension) + one-shot
backfill from property_details.listing_events for pre-trigger history.
Climate risk First Street
- Flood 4/10 Moderate FEMA zone X (unshaded) · 22% chance over 30 yrs
- Wildfire 1/10 Low
- Heat 3/10 Moderate 7 d/yr ≥100°F today · 19 d/yr by 30 yrs out
- Wind 2/10 Low
- Air quality 2/10 Low 1 unhealthy d/yr today · 2 by 30 yrs out
Nearby sold comps map
Loading sold comps map…
Walkable amenities ~0.75 mi
Loading nearby amenities…
Taxation est. · year 1
- Rental income
- $14,502
- − Mortgage interest
- −$2,235
- − Property taxes
- −$598
- − Insurance
- −$200
- − Repairs & maintenance
- −$1,160
- − Management
- −$1,160
- − Depreciation
- −$1,161
- Taxable income
- $7,988
- Est. tax owed @ 24.0%
- −$1,917
- After-tax cash flow
- $6,231/yr
For passive investors: Depreciation is non-cash, so a rental often shows a tax loss while cash-flowing — sheltering income. Rental losses are passive: they offset passive income freely, and up to $25,000/yr can offset ordinary (W-2) income if you actively participate and your MAGI is under $100k (phasing out to $0 by $150k); unused losses carry forward. On sale, claimed depreciation is recaptured at up to 25%, and gains may owe capital-gains tax (a 1031 exchange can defer both). Figures are a year-1 estimate at your 24.0% rate — not tax advice; consult a CPA.
Condition & rehab AI · 12 photos
This property requires extensive renovations, including exterior repairs, interior updates, and landscaping, to improve its condition and value.
Repairs flagged
- Major exterior siding — Significant damage and peeling paint
- Major kitchen cabinets — Outdated and possibly damaged
- Major bathroom fixtures — Outdated and possibly damaged
- Major flooring — Linoleum in kitchen and bathrooms, carpet in bedrooms
- Major interior walls — Peeling paint, outdated colors
- Major windows — Old, possibly single-pane windows
Value-add opportunities
- Resale Painting and updating interior walls — Fresh paint and updated colors can significantly improve curb appeal and interior aesthetics
- Resale Replacing windows — New windows can improve energy efficiency and increase home value
- Resale Rebuilding exterior siding — A new, well-maintained exterior can greatly enhance the home's curb appeal and value
- Resale Upgrading kitchen cabinets and fixtures — Modern, functional kitchen can attract more buyers and increase home value
- Resale Replacing flooring — New flooring can improve the home's overall appearance and increase its value
- Both Landscaping and curb appeal improvements — A well-maintained lawn and landscaping can significantly increase both resale and rental value
Renovation cost estimate screening
| Repair item | Severity | Est. cost |
|---|---|---|
| exterior siding · Significant damage and peeling paint | Major | $15,000–50,000 |
| kitchen cabinets · Outdated and possibly damaged | Major | $15,000–50,000 |
| bathroom fixtures · Outdated and possibly damaged | Major | $15,000–50,000 |
| flooring · Linoleum in kitchen and bathrooms, carpet in bedrooms | Major | $15,000–50,000 |
| interior walls · Peeling paint, outdated colors | Major | $15,000–50,000 |
| windows · Old, possibly single-pane windows | Major | $15,000–50,000 |
| Total estimated repair cost · 6 items | $90,000–300,000 |
Value-add ROI direction
- Resale Painting and updating interior walls — Fresh paint and updated colors can significantly improve curb appeal and interior aesthetics ↑
- Resale Replacing windows — New windows can improve energy efficiency and increase home value ↑
- Resale Rebuilding exterior siding — A new, well-maintained exterior can greatly enhance the home's curb appeal and value ↑
- Resale Upgrading kitchen cabinets and fixtures — Modern, functional kitchen can attract more buyers and increase home value ↑
- Resale Replacing flooring — New flooring can improve the home's overall appearance and increase its value ↑
- Both Landscaping and curb appeal improvements — A well-maintained lawn and landscaping can significantly increase both resale and rental value ↑
ⓘ Cost ranges are severity-bucket heuristics (US national rule-of-thumb). Get contractor quotes + a written scope before underwriting a rehab budget.
Schools (NCES district)
- District
- Sidney City
- NCES district ID
- 3910003
- Math proficiency
- 46% ▼ -14.00%
- Reading proficiency
- 52% ▼ -6.00%
- Median HH income
- $45,974
- Composite
- 41.55/100
- National rank
- #3443
- State rank
- #454 of 656 in OH
Livability — Sidney
- Score
- 76/100
- State rank
- #220
- US rank
- #3412
Category grades
Schools grade is shown separately in the Schools card above.
Census & demographics
- Census place
- Sidney, OH
- County
- Shelby · 44,840 people
- City population
- 28,955
- Population (ZIP)
- 28,955
- Household income
- $66,044
- Rent vs Own
- Severe rent burden
- 5.7
Population outlook (Shelby County) Hauer SSP2
- Today (2025)
- 47,264 people
- By 2030
- 45,935 · -2.8%
- By 2040
- 42,786 · -9.5%
- By 2050
- 38,981 · -17.5%
- By 2075
- 30,225 · -36.1%
- By 2100
- 21,273 · -55.0%
Race, ethnicity, and origin ACS 2023
- Neighborhood character
- Predominantly White (90%)
- Race & ethnicity
- White 90% Two or more races 4% Black 3% Hispanic / Latino 2%
- Common ancestry
- Lithuanian 3% Slovak 1% Italian 1%
- Foreign-born
- 2% · Canada
- Languages at home
- 98% English-only · Spanish 1%
Political lean MEDSL · Shelby
- 2024 margin
- Solid R (+64.8) · D 17.2% · R 82.0%
- 2008→2024 swing
- -28.5pp toward R · 2008: -36.4pp · 2024: -64.8pp
- All cycles
- 2024: R+64.8 2020: R+63.2 2016: R+60.6 2012: R+46.0 2008: R+36.4
Not yet ingested
- Civics
- —
Market trends
- HPI YoY
- ▼ -66.62%
- Current HPI
- 264.4532
- Rent YoY
- —
- Metro
- —
- State GDP YoY
- ▲ 1.98%
- F500 in state
- 48
Industry mix (Fortune 500 HQ in OH)
| Industry | F500 HQs | Revenue |
|---|---|---|
| Insurance | 3 | $145B |
|
||
| Industrial Machinery | 3 | $49B |
|
||
| Financial Services | 3 | $24B |
|
||
| Consumer Goods | 2 | $93B |
|
||
| Aerospace / Defense | 2 | $47B |
|
||
| Utilities | 2 | $33B |
|
||
Price history
2 events — show timeline
- 2026-04-26 Pending — Dayton MLS
- 2026-04-25 Listed $39,900 Dayton MLS
Cash-flow waterfall
monthlySold comps — $/sqft
last 12 mo · ≤1 miLoading sold comps…