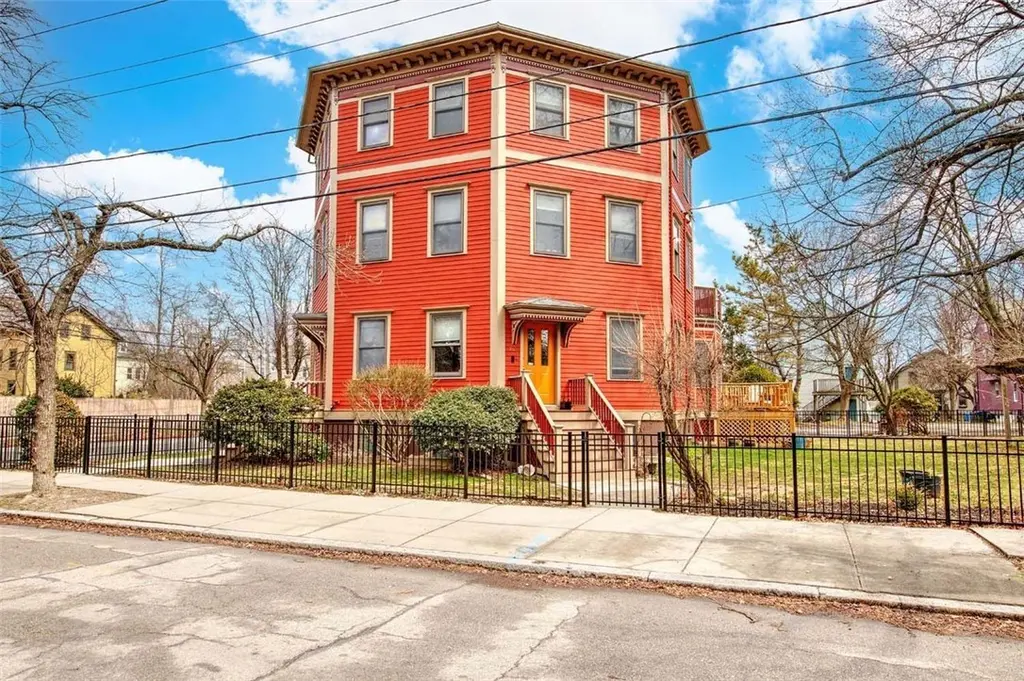
30 Division St #68 · Providence, RI
Flood risk 1/10 · Minimal
- FEMA flood zone
- X (unshaded)
- Chance of flooding over 30 yrs
- 0.0%
- Est. flood insurance / yr
- $473 – $860
Fire risk 1/10 · Minimal
- Est. fire insurance / yr
- $835 – $1,551
Heat risk 5/10 · Moderate
- Hot days now (above 97°F)
- 7 days/yr
- Hot days in 30 yrs
- 15 days/yr
Wind risk 6/10 · Moderate
- Chance of severe wind over 30 yrs
- 71.0%
Air-quality risk 2/10 · Minimal
- Unhealthy air days now
- 1 days/yr
- Unhealthy air days in 30 yrs
- 2 days/yr
Risk factors via First Street. Map © Google.
Why this score? — see what drove the F grade
The composite is a weighted blend of 9 inputs, each scored 0–100. Each bar is that input's sub-score; the figure is the points it added to the 100-point composite (weight × sub-score).
- ARV discount +14.6/15.0
- Cash flow +5.5/30.0
- Livability +4.2/5.0
- Rent growth +3.4/5.0
- 1% rule +2.5/10.0
- Condition / age +2.5/5.0
- Schools +1.0/10.0
- DSCR +0.0/10.0
- Appreciation +0.0/10.0
$249,900
🖨 Deal sheet 📄 Offer letter ✓ Due diligence
Key facts
- Townhouse style unit
- Off street parking
- Private entry
Tags
Property features AI
Finance
- Financial info: Pets allowed (cats and large dogs over 25 lbs.)
- HOA & community: Monthly association fee; Association fee: $296.42; Community of 12 units
Exterior
- Parking: Assigned parking (1 space); No garage
- Utilities: Sewer connected; Water connected; Electrical: 100 amp service with circuit breakers
- Home design: Condominium (Octagon Condominium); 3 stories; Entry level: 1
- Construction: Drywall and clapboard exterior; Concrete perimeter foundation; Below-grade finished area; Above-grade finished area
- Exterior features: Sewer connected; Water connected
Interior
- Bedrooms: Total of 4 rooms (includes bedrooms and living areas)
- Flooring: Vinyl
- Bathrooms: 2 full bathrooms
- Heating & cooling: Baseboard heating; Gas heating; Hot water heating
- Interior features: Vinyl flooring; Tub with shower; Exterior and interior entry to finished basement
- Laundry & utility: In-unit laundry; Tankless water heater
Neighborhood map
What this means for you Summary
Snapshot
- This is a 1-bed/1.5-bath condo listed at $250k.
Deal economics
- At list price, monthly cash flow is $-533 ($-6k/yr) — negative.
- To cash-flow at today's rent, offer at most $156k (37.7% below list).
- To meet the 1% rule (rent ≥ 1% of price), the offer needs to be $187k (25.1% below list).
- Recommended offer: $156k (37.7% below list) — sets the bar for cash-flow.
Location & tenants
- Location reads 84/100 on livability (#2 in RI, #794 nationally) — a professional / high-income tenant draw. Strengths: amenities A+, commute A+, housing A+; Watch: employment C-, schools F.
- Providence (urban): math 8% / reading 16% proficiency, ranked #34 of 39 in RI (top 87%) — low school quality limits family demand, transient renter base, plan for 1-2y turnover; 79% free/reduced lunch — lower-income household profile, screen leases tightly.
- Market conditions: Rents rising (+3.7%/yr); 132 active listings in the ZIP; 4 comparable units currently listed for rent nearby; rentals at typical pace (median 15d on market — plan ~3-4 weeks tenant-placement turnaround); 776 units permitted in Providence County in 2024 (229 in 5+ unit buildings).
- This rent runs 35% of the median local income ($65k/yr) — at the standard rent-burdened threshold; future hikes will face affordability resistance.
Forward outlook
- Local home prices are declining (-3.0%/yr); year-one equity from $2k of loan paydown is wiped out by about $7k of value loss. Plan a longer hold.
- Providence County population projected at +5% by 2050 — modest demand growth; plan on rents tracking national, not racing it.
Negotiation context
- Only 14 days on market — expect competitive offers; lowballing is unlikely to land.
Risks & watch-outs
- Climate carrying-cost: major wind risk, 71% chance of damaging wind over 30y; extreme-heat days projected 7→15/yr by 2055 (HVAC capex compounding) — expect insurance premiums to compound above CPI over the hold.
Questions for the listing agent
- What do current leases actually rent for vs. the listed asking? Can we see a recent rent roll and the last 12 months of T-12 income?
- What does the HOA fee cover, when was the last increase, and are there any pending special assessments or reserve-fund shortfalls?
- Any open or pending special assessments — roof, HVAC, plumbing, elevator, façade? What's the per-unit balance and payoff schedule, and is the seller paying it off at close or rolling it to the buyer?
- Is there a deadline driving the sale (1031 exchange, divorce, estate, relocation)? That informs how much negotiation room exists.
- Schools are F-rated, which usually means shorter tenancies and higher turnover. Who's the typical renter profile here, and what's been the actual vacancy rate?
- The area grade is low — what's the realistic commute time and amenity access for the typical tenant pool here? Any planned neighborhood developments (good or bad) we should know about?
- What's the average days-on-market for RENTAL listings here right now (not sales)? A rising rental-DOM trend means longer vacancies and softer asking-rent achievability than the comps imply.
- What's the recent tenant-quality profile in this submarket — average credit score on applications, eviction rate, late-payment / NSF rate, and stable-employment percentage? A property-management company in the area should have these aggregated.
- How much new apartment / multifamily construction is in the pipeline within 1–3 miles? Heavy new supply (>2% of stock underway) typically softens rents 12–24 months out; light construction supports rent growth.
Investment metrics
- 1% rule
- 0.75% ✗
- Cap rate
- 3.74%
- Cash-on-cash
- -9.13%
- DSCR
- 0.59
- GRM
- 11.1
CMA / ARV
- ARV (median comp)
- $296,400
- List price
- $249,900
- Delta
- -15.69%
- Verdict
- UNDERPRICED
- Comps
- 1 within 2.0 mi
Projected returns pro-forma
-3.0% appreciation · 3.68% rent growth · sell at horizon
- IRR
- -31.5%
- Equity multiple
- -0.04×
- Total profit
- $-72,926
- Equity at exit
- $37,261
- IRR
- -31.0%
- Equity multiple
- -0.44×
- Total profit
- $-100,994
- Equity at exit
- $21,607
Cash invested: $69,972 (down + closing). Projections, not guarantees.
Landlord ↔ Tenant lean methodology
- Overall (STATE)
- 31 Tenant-Leaning
- State Rhode Island
- 31 Tenant-Leaning · D+8
- County
- — inherits STATE
- City
- — inherits STATE
ZIP-level market 02909
- Home prices YoY
- -13.3%
- Rents YoY
- 3.7%
- Active inventory
- 132
- Price-to-rent
- 11.1×
Monthly cashflow live
- Estimated rent
- $1,872 medium interval (Pro) →
- Mortgage (P&I)
- −$1,311
- Tax from tax record
- −$301 /mo · $3,615/yr
- Insurance
- −$104
- HOA
- −$296
- Vacancy / Maint / Mgmt
- −$393
- Net cashflow
- $-533
Break-even live
UW: 25.0% down · 7.5% · 30yr · 1.5% tax · 5.0% vac · 8.0% maint · 8.0% mgmt
Financing live
Cash to close
- Down payment
- $62,475
- Closing costs
- $7,497
- Reserves months
- —
- Total cash needed
- —
Loan-product check · same deal, 3 products live
Conventional
25% down · 7.5% · 30yr
- Down + closing
- —
- Monthly P&I
- —
- Monthly cashflow
- —
- DSCR
- —
- Eligible?
- —
Personal DTI + credit; lowest rate.
DSCR
20% down · 8.5% · 30yr
- Down + closing
- —
- Monthly P&I
- —
- Monthly cashflow
- —
- DSCR
- —
- Eligible?
- —
No personal income docs; deal must DSCR.
Hard money
10% down · 12.0% · 12mo
- Down + closing
- —
- Monthly P&I
- —
- Monthly cashflow
- —
- DSCR
- —
- Eligible?
- —
Short-term bridge; refi at stabilization.
Rent comps 4 comps
| Address | Beds | Baths | Sqft | Rent | $/sqft | DOM | Units | Dist |
|---|---|---|---|---|---|---|---|---|
| 166 Valley St Providence, RI | 2.0 | 1.0–2.0 | 733 | $2,205 | $3.01 | 2d | 7 | 0.75mi |
| 304 Webster Ave Cranston, RI | 2.0 | 1.0 | 1144 | $1,850 | $1.62 | 10d | 1 | 1.13mi |
| 348 Union Ave Unit 1 Providence, RI | 2.0 | 1.0 | 900 | $1,900 | $2.11 | 14d | 1 | 1.20mi |
| 37 Sumner Ave Unit 2 Cranston, RI | 2.0 | 1.0 | 800 | $1,600 | $2.00 | 17d | 1 | 1.47mi |
HOA detail condo
- Monthly dues
- $296 · $3,552/yr
- Assessments
- None detected in remarks — confirm with the listing agent.
Listing history 1 events
-
2026-05-15$249,900 Active 479-char remark
ⓘ Source: listings_history table (triggers on properties + properties_extension) + one-shot
backfill from property_details.listing_events for pre-trigger history.
Tax reassessment forecast RI · Partial reset (capped growth)
- Current annual tax
- $3,615 · $301/mo
- Projected year-2 tax
- $3,844 · $320/mo
- Expected delta
- +$229/yr (+$19/mo · 6.3%)
ⓘ Screening estimate from a state-policy table — verify with the county assessor before closing.
Climate risk First Street
- Flood 1/10 Low FEMA zone X (unshaded) · 0% chance over 30 yrs
- Wildfire 1/10 Low
- Heat 5/10 Major 7 d/yr ≥97°F today · 15 d/yr by 30 yrs out
- Wind 6/10 Major 71% chance of damaging wind over 30 yrs
- Air quality 2/10 Low 1 unhealthy d/yr today · 2 by 30 yrs out
Nearby sold comps map
Loading sold comps map…
Walkable amenities ~0.75 mi
Loading nearby amenities…
Taxation est. · year 1
- Rental income
- $22,469
- − Mortgage interest
- −$13,998
- − Property taxes
- −$3,615
- − Insurance
- −$1,250
- − Repairs & maintenance
- −$1,798
- − Management
- −$1,798
- − HOA
- −$3,552
- − Depreciation
- −$7,270
- Taxable loss
- −$10,810
- Est. tax savings @ 24.0%
- +$2,594
- After-tax cash flow
- $-3,797/yr
For passive investors: Depreciation is non-cash, so a rental often shows a tax loss while cash-flowing — sheltering income. Rental losses are passive: they offset passive income freely, and up to $25,000/yr can offset ordinary (W-2) income if you actively participate and your MAGI is under $100k (phasing out to $0 by $150k); unused losses carry forward. On sale, claimed depreciation is recaptured at up to 25%, and gains may owe capital-gains tax (a 1031 exchange can defer both). Figures are a year-1 estimate at your 24.0% rate — not tax advice; consult a CPA.
Schools (NCES district)
- District
- Providence
- NCES district ID
- 4400900
- Math proficiency
- 8% ▼ -4.00%
- Reading proficiency
- 16% ▼ -2.00%
- Median HH income
- $38,197
- Composite
- 10.12/100
- National rank
- #9803
- State rank
- #34 of 39 in RI
Livability — Providence
- Score
- 84/100
- State rank
- #2
- US rank
- #794
Category grades
Schools grade is shown separately in the Schools card above.
Census & demographics
- Census place
- Providence, RI
- County
- Providence County · 548,917 people
- City population
- 212,734
- Metro
- Providence-Warwick, RI-MA
- Population (ZIP)
- 46,014
- Household income
- $64,649
- Rent vs Own
- Severe rent burden
- 2000.0
Population outlook (Providence County) Hauer SSP2
- Today (2025)
- 653,469 people
- By 2030
- 660,819 · +1.1%
- By 2040
- 672,747 · +3.0%
- By 2050
- 683,741 · +4.6%
- By 2075
- 720,435 · +10.2%
- By 2100
- 741,582 · +13.5%
Race, ethnicity, and origin ACS 2023
- Neighborhood character
- Diverse neighborhood (Simpson 0.57)
- Race & ethnicity
- Hispanic / Latino 60% Two or more races 23% White 22% Black 12% Asian 2% Native American 2%
- Hispanic origin (detail)
- Puerto Rican 12% Dominican 23%
- Common ancestry
- Lithuanian 2% Russian 1% Romanian 1%
- Foreign-born
- 35% · Canada, Jamaica
- Languages at home
- 43% English-only · Spanish 50% Other Indo-European 2% Other Asian/Pacific 1%
Political lean MEDSL · Providence
- 2024 margin
- D (+14.4) · D 56.1% · R 41.7% · Other 2.2%
- 2008→2024 swing
- -20.0pp toward R · 2008: 34.4pp · 2024: 14.4pp
- All cycles
- 2024: D+14.4 2020: D+22.9 2016: D+21.2 2012: D+34.9 2008: D+34.4
Not yet ingested
- Civics
- —
Market trends
- HPI YoY
- ▼ -72.78%
- Current HPI
- 474.9956
- Rent YoY
- ▲ 3.68%
- Metro
- Providence-Warwick, RI-MA
- State GDP YoY
- ▲ 2.25%
- F500 in state
- 10
Industry mix (Fortune 500 HQ in RI)
| Industry | F500 HQs | Revenue |
|---|---|---|
| Healthcare | 1 | $373B |
|
||
| Food Distribution | 1 | $31B |
|
||
| Aerospace / Defense | 1 | $14B |
|
||
| Financial Services | 1 | $8B |
|
||
| Consumer Goods | 1 | $4B |
|
||
Price history
2 events — show timeline
- 2026-05-29 Pending — RIS
- 2026-05-15 Listed $249,900 RIS
Property tax history
-19.8%/yrLatest (2013): $3,615 · -19.8% YoY. Source: county tax records.
Cash-flow waterfall
monthlySold comps — $/sqft
last 12 mo · ≤1 miLoading sold comps…