 Duplex
1002 Falconer St · Charleston, AR
Flood risk 1/10 · Minimal
- FEMA flood zone
- X (unshaded)
- Chance of flooding over 30 yrs
- 0.0%
- Est. flood insurance / yr
- $507 – $1,088
Fire risk 6/10 · Moderate
- Est. fire insurance / yr
- $1,499 – $2,785
Heat risk 7/10 · Major
- Hot days now (above 112°F)
- 7 days/yr
- Hot days in 30 yrs
- 20 days/yr
Wind risk 2/10 · Minimal
- Chance of severe wind over 30 yrs
- 2.0%
Air-quality risk 2/10 · Minimal
- Unhealthy air days now
- 0 days/yr
- Unhealthy air days in 30 yrs
- 1 days/yr
Risk factors via First Street. Map © Google.
Why this score? — see what drove the D grade
The composite is a weighted blend of 9 inputs, each scored 0–100. Each bar is that input's sub-score; the figure is the points it added to the 100-point composite (weight × sub-score).
- Appreciation +10.0/10.0
- Cash flow +9.9/30.0
- ARV discount +7.5/15.0
- Schools +3.8/10.0
- Livability +3.5/5.0
- DSCR +2.8/10.0
- Rent growth +2.5/5.0
- Condition / age +2.5/5.0
- 1% rule +2.1/10.0
$280,000
🖨 Deal sheet 📄 Offer letter ✓ Due diligence
Multi-family units
County records classify this as Multi-Family (2-4 Unit). Listing-text estimate: 2 units. confirmed
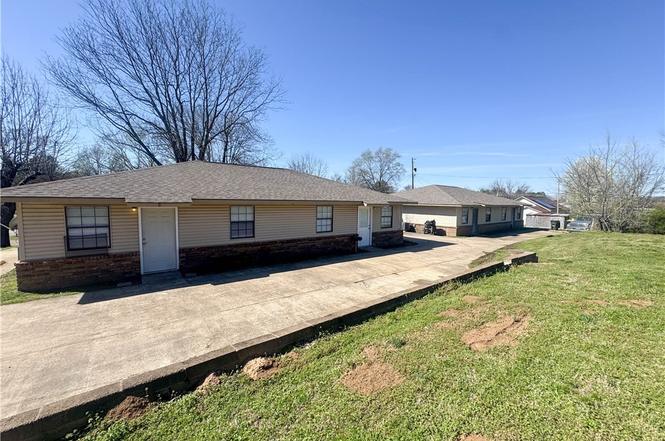
Listing remarks
BACK ON THE MARKET AT NO FAULT OF SELLER. Investment Opportunity - 4 Rental Units! Great income-producing property featuring two duplex buildings for a total of 4 rental units in Charleston, AR. Each unit offers 2 bedrooms and 1 bathroom with a functional open floor plan that creates a comfortable living space for tenants. The interiors feature durable ceramic tile or luxury vinyl plank (LVP) throughout - no carpet, making maintenance easy and appealing for long term rentals. Each unit includes a spacious living area that flows into the kitchen and dining space maximizing usuability and tenant appeal. With multiple units on one property, this is an excellent opportunity for investors
Key facts
- Luxury vinyl plank
- Spacious living area
- Duplex buildings
Tags
Property features AI
Finance
- Other: Property type: Residential duplex
- Financial info: Actual rent for the 2-bedroom unit: $700
Exterior
- Parking: 2 parking spaces on concrete
- Security: Smoke detector(s)
- Utilities: Tenant pays cable, electric, and water/sewer
- Home design: Residential duplex; One story
- Construction: Brick construction; Shingle roof; Slab foundation
- Exterior features: Public maintained road; No fencing
Interior
- Kitchen: Dishwasher; Electric water heater
- Bedrooms: 2-bedroom unit
- Flooring: Ceramic tile; Laminate
- Bathrooms: 1 bathroom
- Heating & cooling: Central heating (electric); Central air conditioning (electric)
- Interior features: Smoke detector(s); Ceramic tile and laminate flooring
- Laundry & utility: Electric dryer hookup
Neighborhood map
What this means for you Summary
Snapshot
- This is a 2 × 2-bed/1.0-bath units multifamily listed at $280k.
Deal economics
- At list price, monthly cash flow is $-175 ($-2k/yr) — negative. Per door: $-87/mo.
- To cash-flow at today's rent, offer at most $249k (11.0% below list).
- To meet the 1% rule (rent ≥ 1% of price), the offer needs to be $199k (28.9% below list).
- Recommended offer: $199k (28.9% below list) — sets the bar for 1% rule.
Location & tenants
- Location reads 69/100 on livability (#70 in AR) — a middle-class / working-renter tenant base. Strengths: cost of living A+, housing A+, health & safety A+; Watch: crime D, amenities F, commute F.
- Charleston School District (rural): math 46% / reading 43% proficiency, ranked #39 of 238 in AR (top 16%) — families likely to look elsewhere, expect single-tenant / working-renter base with shorter leases.
- Market conditions: 51 active listings in the ZIP; 23 units permitted in Franklin County in 2024 (0 in 5+ unit buildings).
Forward outlook
- In year one you build about $30k of equity ($2k loan paydown + $28k appreciation (10.0% local appreciation)).
- Franklin County population projected at -16% by 2050 — secular population decline; favor cash flow + early exit over multi-decade hold.
- By year 2, paydown + projected appreciation supports a ~$48k cash-out refi (75% LTV) — recoverable capital for the next deal without selling this one.
Negotiation context
- It's been on market 23 days — a 2% lower offer ($276k) is reasonable based on typical stale-listing flexibility.
- 2 sale attempts with the ask held roughly flat each time — persistent listings suggest the price (not the market) is what's stuck; bring a comps-based counter.
- Current owner paid $83k; list at $280k implies a 237% gain — meaningful room to come down on a strong offer.
Risks & watch-outs
- Climate carrying-cost: major wildfire risk; extreme-heat days projected 7→20/yr by 2055 (HVAC capex compounding) — expect insurance premiums to compound above CPI over the hold.
Questions for the listing agent
- What do current leases actually rent for vs. the listed asking? Can we see a recent rent roll and the last 12 months of T-12 income?
- Can we see the unit-by-unit rent roll, current vacancy, and any below-market leases? What's the average tenancy length?
- What capital expenditures (roof, boiler, parking lot, exteriors) have been made in the last 5 years, and what's planned in the next 2?
- Is there a deadline driving the sale (1031 exchange, divorce, estate, relocation)? That informs how much negotiation room exists.
- Crime grade is D in this area — have there been break-ins, vandalism, or insurance claims at this property in the last 3 years? What carrier currently insures it and at what premium?
- The area grade is low — what's the realistic commute time and amenity access for the typical tenant pool here? Any planned neighborhood developments (good or bad) we should know about?
- What's the average days-on-market for RENTAL listings here right now (not sales)? A rising rental-DOM trend means longer vacancies and softer asking-rent achievability than the comps imply.
- What's the recent tenant-quality profile in this submarket — average credit score on applications, eviction rate, late-payment / NSF rate, and stable-employment percentage? A property-management company in the area should have these aggregated.
- How much new apartment / multifamily construction is in the pipeline within 1–3 miles? Heavy new supply (>2% of stock underway) typically softens rents 12–24 months out; light construction supports rent growth.
Investment metrics
- 1% rule
- 0.71% ✗
- Cap rate
- 5.54%
- Cash-on-cash
- -2.67%
- DSCR
- 0.88
- GRM
- 11.7
CMA / ARV
No comps found within radius.
Projected returns pro-forma
10.0% appreciation · 3.0% rent growth · sell at horizon
- IRR
- 22.4%
- Equity multiple
- 2.80×
- Total profit
- $141,283
- Equity at exit
- $252,246
- IRR
- 20.0%
- Equity multiple
- 6.42×
- Total profit
- $424,637
- Equity at exit
- $543,978
Cash invested: $78,400 (down + closing). Projections, not guarantees.
Landlord ↔ Tenant lean methodology
- Overall (STATE)
- 92 Strongly Landlord-Friendly
- State Arkansas
- 92 Strongly Landlord-Friendly · R+14
- County
- — inherits STATE
- City
- — inherits STATE
ZIP-level market 72933
- Home prices YoY
- 5.8%
- Active inventory
- 51
- Price-to-rent
- 23.4×
Monthly cashflow live
- Estimated rent
- $1,992 medium interval (Pro) →
- Mortgage (P&I)
- −$1,468
- Tax from tax record
- −$163 /mo · $1,961/yr
- Insurance
- −$117
- HOA
- −$0
- Vacancy / Maint / Mgmt
- −$418
- Net cashflow
- $-175
Break-even live
2-unit breakdown (identical units grouped — click to expand)
| Units | Beds | Baths | Est. rent |
|---|---|---|---|
| 2× units | 2 | 1 | $1,992 |
| #1 | 2 | 1 | $996 |
| #2 | 2 | 1 | $996 |
| Total (2 units) | $1,992 | ||
UW: 25.0% down · 7.5% · 30yr · 1.5% tax · 5.0% vac · 8.0% maint · 8.0% mgmt
Financing live
Cash to close
- Down payment
- $70,000
- Closing costs
- $8,400
- Reserves months
- —
- Total cash needed
- —
Loan-product check · same deal, 3 products live
Conventional
25% down · 7.5% · 30yr
- Down + closing
- —
- Monthly P&I
- —
- Monthly cashflow
- —
- DSCR
- —
- Eligible?
- —
Personal DTI + credit; lowest rate.
DSCR
20% down · 8.5% · 30yr
- Down + closing
- —
- Monthly P&I
- —
- Monthly cashflow
- —
- DSCR
- —
- Eligible?
- —
No personal income docs; deal must DSCR.
Hard money
10% down · 12.0% · 12mo
- Down + closing
- —
- Monthly P&I
- —
- Monthly cashflow
- —
- DSCR
- —
- Eligible?
- —
Short-term bridge; refi at stabilization.
Listing history 5 events
-
2026-04-28status Pending
-
2026-04-15status Active
-
2026-03-23status Pending
-
2026-03-13$280,000 Active
-
2000-12-07soldstatus $83,000
ⓘ Source: listings_history table (triggers on properties + properties_extension) + one-shot
backfill from property_details.listing_events for pre-trigger history.
Tax reassessment forecast AR · Resets to sale price
- Current annual tax
- $1,961 · $163/mo
- Projected year-2 tax
- $1,961 · $163/mo
- Expected delta
- $0/yr ($0/mo · 0.0%)
ⓘ Screening estimate from a state-policy table — verify with the county assessor before closing.
Climate risk First Street
- Flood 1/10 Low FEMA zone X (unshaded) · 0% chance over 30 yrs
- Wildfire 6/10 Major
- Heat 7/10 Severe 7 d/yr ≥112°F today · 20 d/yr by 30 yrs out
- Wind 2/10 Low 2% chance of damaging wind over 30 yrs
- Air quality 2/10 Low 0 unhealthy d/yr today · 1 by 30 yrs out
Nearby sold comps map
Loading sold comps map…
Walkable amenities ~0.75 mi
Loading nearby amenities…
Taxation est. · year 1
- Rental income
- $23,904
- − Mortgage interest
- −$15,684
- − Property taxes
- −$1,961
- − Insurance
- −$1,400
- − Repairs & maintenance
- −$1,912
- − Management
- −$1,912
- − Depreciation
- −$8,145
- Taxable loss
- −$7,111
- Est. tax savings @ 24.0%
- +$1,707
- After-tax cash flow
- $-390/yr
For passive investors: Depreciation is non-cash, so a rental often shows a tax loss while cash-flowing — sheltering income. Rental losses are passive: they offset passive income freely, and up to $25,000/yr can offset ordinary (W-2) income if you actively participate and your MAGI is under $100k (phasing out to $0 by $150k); unused losses carry forward. On sale, claimed depreciation is recaptured at up to 25%, and gains may owe capital-gains tax (a 1031 exchange can defer both). Figures are a year-1 estimate at your 24.0% rate — not tax advice; consult a CPA.
Schools (NCES district)
- District
- Charleston School District
- NCES district ID
- 0504200
- Math proficiency
- 46% ▼ -12.00%
- Reading proficiency
- 43% ▼ -9.00%
- Median HH income
- $47,155
- Composite
- 37.97/100
- National rank
- #4296
- State rank
- #39 of 238 in AR
Livability — Charleston
- Score
- 69/100
- State rank
- #70
- US rank
- #8583
Category grades
Schools grade is shown separately in the Schools card above.
Census & demographics
- Census place
- Charleston, AR
- Population (ZIP)
- 5,207
Population outlook (Franklin County) Hauer SSP2
- Today (2025)
- 16,946 people
- By 2030
- 16,403 · -3.2%
- By 2040
- 15,303 · -9.7%
- By 2050
- 14,243 · -16.0%
- By 2075
- 12,136 · -28.4%
- By 2100
- 10,443 · -38.4%
Race, ethnicity, and origin ACS 2023
- Neighborhood character
- Predominantly White (86%)
- Race & ethnicity
- White 86% Two or more races 10% Hispanic / Latino 2%
- Common ancestry
- Slovak 2% Iranian 2% Italian 1%
- Foreign-born
- 1%
Political lean MEDSL · Franklin
- 2024 margin
- Solid R (+62.4) · D 17.7% · R 80.1% · Other 2.2%
- 2008→2024 swing
- -23.1pp toward R · 2008: -39.3pp · 2024: -62.4pp
- All cycles
- 2024: R+62.4 2020: R+61.4 2016: R+54.6 2012: R+44.4 2008: R+39.3
Not yet ingested
- Civics
- —
Market trends
- HPI YoY
- ▲ 15.06%
- Current HPI
- 273.2222
- Rent YoY
- —
- Metro
- —
- State GDP YoY
- ▲ 3.80%
- F500 in state
- 10
Industry mix (Fortune 500 HQ in AR)
| Industry | F500 HQs | Revenue |
|---|---|---|
| Retail | 1 | $681B |
|
||
| Food / Agriculture | 1 | $53B |
|
||
| Retail / Energy | 1 | $22B |
|
||
| Transportation / Logistics | 1 | $12B |
|
||
| Energy | 1 | $4B |
|
||
Price history
+237.3% since first listed5 events — show timeline
- 2026-04-28 Pending — WRVBOR
- 2026-04-15 Relisted — WRVBOR
- 2026-03-23 Pending — WRVBOR
- 2026-03-13 Listed $280,000 WRVBOR
- 2000-12-07 Sold (Public Records) $83,000 Public Records
Property tax history
+1.7%/yrLatest (2025): $1,961 · +0.0% YoY. Source: county tax records.
Cash-flow waterfall
monthlySold comps — $/sqft
last 12 mo · ≤1 miLoading sold comps…