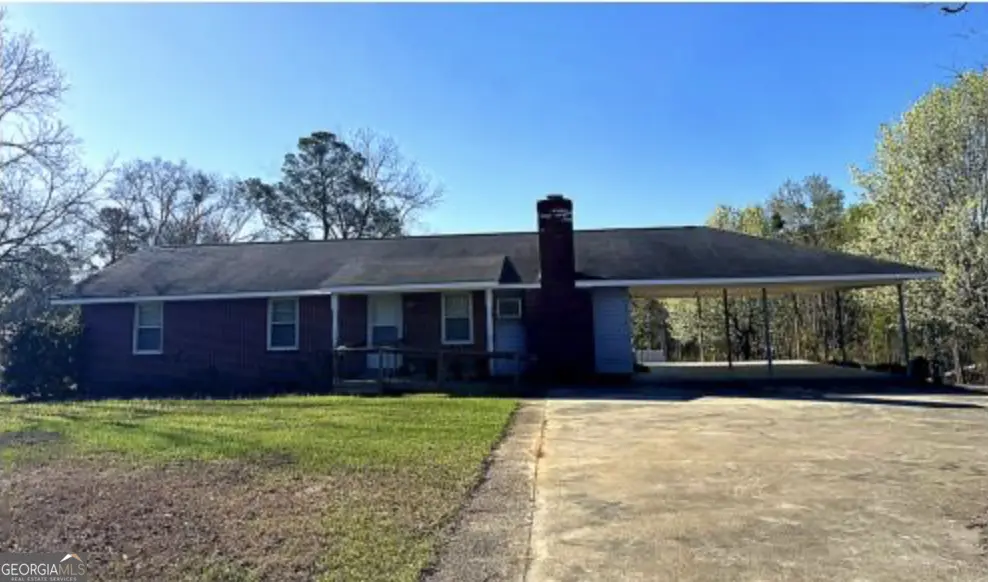
801 Warthen St · Vidalia, GA
Flood risk 1/10 · Minimal
- FEMA flood zone
- X (unshaded)
- Chance of flooding over 30 yrs
- 0.0%
- Est. flood insurance / yr
- $507 – $1,088
Fire risk 6/10 · Moderate
- Est. fire insurance / yr
- $963 – $1,789
Heat risk 7/10 · Major
- Hot days now (above 107°F)
- 7 days/yr
- Hot days in 30 yrs
- 18 days/yr
Wind risk 8/10 · Major
- Chance of severe wind over 30 yrs
- 80.0%
Air-quality risk 2/10 · Minimal
- Unhealthy air days now
- 1 days/yr
- Unhealthy air days in 30 yrs
- 1 days/yr
Risk factors via First Street. Map © Google.
Why this score? — see what drove the C- grade
The composite is a weighted blend of 9 inputs, each scored 0–100. Each bar is that input's sub-score; the figure is the points it added to the 100-point composite (weight × sub-score).
- Cash flow +21.8/30.0
- ARV discount +7.8/15.0
- DSCR +7.0/10.0
- 1% rule +4.5/10.0
- Livability +3.0/5.0
- Rent growth +2.5/5.0
- Condition / age +2.5/5.0
- Schools +2.1/10.0
- Appreciation +0.0/10.0
$155,000
🖨 Deal sheet 📄 Offer letter ✓ Due diligence
Listing remarks
Welcome to 801 Warthen Street in Vidalia, a charming corner lot property that offers both character and functionality! This home features a fenced backyard, separate utility room, and a cook shed that's perfect for entertaining, weekend cookouts, or creating your own outdoor retreat. The property is lined with muscadine grape vines, pear trees, and five mature pecan trees, giving you a true taste of Southern living right in your own backyard. With space to enjoy, unique outdoor features, and a setting that stands out, this property is a rare find in town and full of potential for its next owner.
Key facts
- Mature pecan trees
- Cook shed
- Pear trees
Tags
Property features AI
Finance
- Other: Resale property
- HOA & community: No association
Exterior
- Parking: Carport; Open parking / parking pad
- Utilities: Electricity available; Public sewer; Water: public and private; Cable available; High-speed internet available
- Home design: Single-family residence; House structure; Built in 1962
- Construction: Brick construction; Composition roof
- Exterior features: Back yard with fenced yard; Corner lot; Outbuilding / shed(s)
Interior
- Kitchen: Dishwasher
- Bedrooms: Three bedrooms on the main level
- Flooring: Carpet; Tile; Vinyl
- Bathrooms: 1 full bathroom and 1 half bathroom (1.5 total); one bathroom on the main level
- Heating & cooling: Central heating; Central air conditioning
- Interior features: One-level layout; Crawl space basement; Fireplace in the living room; Other interior features
- Laundry & utility: Laundry closet
Neighborhood map
What this means for you Summary
Snapshot
- This is a 3-bed/1.0-bath single-family listed at $155k.
Deal economics
- At list price, monthly cash flow is $242 ($3k/yr) — positive.
- The deal already cash-flows at list — no discount required.
- To meet the 1% rule (rent ≥ 1% of price), the offer needs to be $147k (5.4% below list).
- Recommended offer: $147k (5.4% below list) — sets the bar for 1% rule.
- Cap rate 8.2% vs local median 3.9% in Vidalia — top-decile yield for the area; either an underpriced asset or a hidden risk that comps aren't pricing in. Stress-test before assuming the spread holds.
Location & tenants
- Location reads 60/100 on livability (#377 in GA) — a middle-class / working-renter tenant base. Strengths: cost of living A+, housing A+; Watch: health & safety C-, crime F, amenities F.
- Vidalia City (town): math 24% / reading 27% proficiency, ranked #126 of 174 in GA (top 72%) — low school quality limits family demand, transient renter base, plan for 1-2y turnover; 61% free/reduced lunch — lower-income household profile, screen leases tightly.
- Zoned schools: J. R. Trippe Middle School (math 21% / reading 32%, grade F, #282 of 470 statewide, top 61%, 531 students, 90% FRL) — zoned schools average 90% FRL vs 61% district-wide (29 pts higher); higher-poverty schools than district average — tighter screening recommended.
- Market conditions: 103 active listings in the ZIP; 33 units permitted in Toombs County in 2024 (0 in 5+ unit buildings).
- This rent runs 32% of the median local income ($55k/yr) — at the standard rent-burdened threshold; future hikes will face affordability resistance.
Forward outlook
- Local home prices are declining (-3.0%/yr); year-one equity from $1k of loan paydown is wiped out by about $5k of value loss. Plan a longer hold.
- Toombs County population projected at -11% by 2050 — secular population decline; favor cash flow + early exit over multi-decade hold.
Negotiation context
- Only 3 days on market — expect competitive offers; lowballing is unlikely to land.
- 3 sale attempts since 2y ago with the ask held roughly flat each time — persistent listings suggest the price (not the market) is what's stuck; bring a comps-based counter.
Risks & watch-outs
- Climate carrying-cost: severe wind risk, 80% chance of damaging wind over 30y; major wildfire risk; extreme-heat days projected 7→18/yr by 2055 (HVAC capex compounding) — expect insurance premiums to compound above CPI over the hold.
Questions for the listing agent
- Built in 1962 — when were the roof, HVAC, electrical panel, plumbing, and water heater last replaced?
- Is there a deadline driving the sale (1031 exchange, divorce, estate, relocation)? That informs how much negotiation room exists.
- Schools are F-rated, which usually means shorter tenancies and higher turnover. Who's the typical renter profile here, and what's been the actual vacancy rate?
- Crime grade is F in this area — have there been break-ins, vandalism, or insurance claims at this property in the last 3 years? What carrier currently insures it and at what premium?
- What's the average days-on-market for RENTAL listings here right now (not sales)? A rising rental-DOM trend means longer vacancies and softer asking-rent achievability than the comps imply.
- What's the recent tenant-quality profile in this submarket — average credit score on applications, eviction rate, late-payment / NSF rate, and stable-employment percentage? A property-management company in the area should have these aggregated.
- How much new for-sale + rental construction is in the pipeline within 1–3 miles? Heavy new supply typically softens prices + rents 12–24 months out; constrained supply supports both.
Investment metrics
- 1% rule
- 0.95% ✗
- Cap rate
- 8.17%
- Cash-on-cash
- 6.70%
- DSCR
- 1.30
- GRM
- 8.8
CMA / ARV
- ARV (median comp)
- $156,205
- List price
- $155,000
- Delta
- -0.77%
- Verdict
- FAIR
- Comps
- 20 within 1.0 mi
Show comp detail 2 sales within ~0.75 mi
| Address | Dist | Beds/Ba | Sqft | Sold | Price | $/sf | Match |
|---|---|---|---|---|---|---|---|
| 801 Warthen St | 0.00mi | 3/1.5 | 1,377 (0%) | 1mo | $150,000 | $109 | 98 |
| 903 Loop Rd | 0.64mi | 3/2.0 | 1,380 (+0%) | 4mo | $187,000 | $136 | 63 |
Match score weights: distance 35% · size 25% · config 20% · recency 20%. Top-matched comps best support the ARV.
Projected returns pro-forma
-3.0% appreciation · 3.0% rent growth · sell at horizon
- IRR
- -6.1%
- Equity multiple
- 0.78×
- Total profit
- $-9,748
- Equity at exit
- $23,111
- IRR
- 3.5%
- Equity multiple
- 1.26×
- Total profit
- $11,098
- Equity at exit
- $13,402
Cash invested: $43,400 (down + closing). Projections, not guarantees.
Landlord ↔ Tenant lean methodology
- Overall (STATE)
- 90 Strongly Landlord-Friendly
- State Georgia
- 90 Strongly Landlord-Friendly · R+3
- County
- — inherits STATE
- City
- — inherits STATE
ZIP-level market 30474
- Home prices YoY
- -20.1%
- Active inventory
- 103
- Price-to-rent
- 8.8×
Monthly cashflow live
- Estimated rent
- $1,467 medium interval (Pro) →
- Mortgage (P&I)
- −$813
- Tax from tax record
- −$39 /mo · $468/yr
- Insurance
- −$65
- HOA
- −$0
- Vacancy / Maint / Mgmt
- −$308
- Net cashflow
- $242
Break-even live
UW: 25.0% down · 7.5% · 30yr · 1.5% tax · 5.0% vac · 8.0% maint · 8.0% mgmt
Financing live
Cash to close
- Down payment
- $38,750
- Closing costs
- $4,650
- Reserves months
- —
- Total cash needed
- —
Loan-product check · same deal, 3 products live
Conventional
25% down · 7.5% · 30yr
- Down + closing
- —
- Monthly P&I
- —
- Monthly cashflow
- —
- DSCR
- —
- Eligible?
- —
Personal DTI + credit; lowest rate.
DSCR
20% down · 8.5% · 30yr
- Down + closing
- —
- Monthly P&I
- —
- Monthly cashflow
- —
- DSCR
- —
- Eligible?
- —
No personal income docs; deal must DSCR.
Hard money
10% down · 12.0% · 12mo
- Down + closing
- —
- Monthly P&I
- —
- Monthly cashflow
- —
- DSCR
- —
- Eligible?
- —
Short-term bridge; refi at stabilization.
Listing history 7 events
-
2026-05-04status Under Contract 673-char remark
-
2026-03-16$155,000 New 673-char remark
-
2026-03-12historical
-
2026-02-05price $159,000
-
2025-08-28$162,000 New
-
2024-07-16historical
-
2024-05-22$199,000 New
ⓘ Source: listings_history table (triggers on properties + properties_extension) + one-shot
backfill from property_details.listing_events for pre-trigger history.
Tax reassessment forecast GA · Resets to sale price
- Current annual tax
- $468 · $39/mo
- Projected year-2 tax
- $1,426 · $119/mo
- Expected delta
- +$958/yr (+$80/mo · 204.4%)
ⓘ Screening estimate from a state-policy table — verify with the county assessor before closing.
Climate risk First Street
- Flood 1/10 Low FEMA zone X (unshaded) · 0% chance over 30 yrs
- Wildfire 6/10 Major
- Heat 7/10 Severe 7 d/yr ≥107°F today · 18 d/yr by 30 yrs out
- Wind 8/10 Severe 80% chance of damaging wind over 30 yrs
- Air quality 2/10 Low 1 unhealthy d/yr today · 1 by 30 yrs out
Nearby sold comps map
Loading sold comps map…
Walkable amenities ~0.75 mi
Loading nearby amenities…
Taxation est. · year 1
- Rental income
- $17,604
- − Mortgage interest
- −$8,682
- − Property taxes
- −$468
- − Insurance
- −$775
- − Repairs & maintenance
- −$1,408
- − Management
- −$1,408
- − Depreciation
- −$4,509
- Taxable income
- $352
- Est. tax owed @ 24.0%
- −$84
- After-tax cash flow
- $2,825/yr
For passive investors: Depreciation is non-cash, so a rental often shows a tax loss while cash-flowing — sheltering income. Rental losses are passive: they offset passive income freely, and up to $25,000/yr can offset ordinary (W-2) income if you actively participate and your MAGI is under $100k (phasing out to $0 by $150k); unused losses carry forward. On sale, claimed depreciation is recaptured at up to 25%, and gains may owe capital-gains tax (a 1031 exchange can defer both). Figures are a year-1 estimate at your 24.0% rate — not tax advice; consult a CPA.
Schools (NCES district)
- District
- Vidalia City
- NCES district ID
- 1305340
- Math proficiency
- 24% ▼ -9.00%
- Reading proficiency
- 27% ▼ -4.00%
- Median HH income
- $33,262
- Composite
- 20.87/100
- National rank
- #8495
- State rank
- #126 of 174 in GA
Livability — Vidalia
- Score
- 60/100
- State rank
- #377
- US rank
- #19133
Category grades
Schools grade is shown separately in the Schools card above.
Census & demographics
- Census place
- Vidalia, GA
- County
- Toombs County · 17,315 people
- City population
- 17,315
- Metro
- Vidalia, GA
- Population (ZIP)
- 17,315
- Household income
- $55,295
- Rent vs Own
- Severe rent burden
- 427.0
Population outlook (Toombs County) Hauer SSP2
- Today (2025)
- 26,784 people
- By 2030
- 26,312 · -1.8%
- By 2040
- 25,219 · -5.8%
- By 2050
- 23,733 · -11.4%
- By 2075
- 19,107 · -28.7%
- By 2100
- 12,922 · -51.8%
Race, ethnicity, and origin ACS 2023
- Neighborhood character
- Diverse neighborhood (Simpson 0.60)
- Race & ethnicity
- White 57% Black 25% Two or more races 10% Hispanic / Latino 9% Asian 1%
- Hispanic origin (detail)
- Mexican 7%
- Common ancestry
- Slovak 2% Italian 1% Lithuanian 1%
- Foreign-born
- 5% · Canada, China
- Languages at home
- 91% English-only · Spanish 7% Chinese 1% Other Indo-European 1%
Political lean MEDSL · Toombs
- 2024 margin
- Solid R (+50.7) · D 24.5% · R 75.2%
- 2008→2024 swing
- -12.6pp toward R · 2008: -38.1pp · 2024: -50.7pp
- All cycles
- 2024: R+50.7 2020: R+45.2 2016: R+46.9 2012: R+40.5 2008: R+38.1
Not yet ingested
- Civics
- —
Market trends
- HPI YoY
- ▼ -58.08%
- Current HPI
- 231.4021
- Rent YoY
- —
- Metro
- Vidalia, GA
- State GDP YoY
- ▲ 2.66%
- F500 in state
- 28
Industry mix (Fortune 500 HQ in GA)
| Industry | F500 HQs | Revenue |
|---|---|---|
| Paper / Packaging | 2 | $29B |
|
||
| Retail | 1 | $160B |
|
||
| Transportation / Logistics | 1 | $91B |
|
||
| Airlines | 1 | $62B |
|
||
| Consumer Goods | 1 | $47B |
|
||
| Utilities | 1 | $25B |
|
||
Price history
-24.6% since first listed9 events — show timeline
- 2026-06-02 Sold (Public Records) $150,000 Public Records
- 2026-06-02 Sold (MLS) $150,000 GAMLS
- 2026-05-04 Pending — GAMLS
- 2026-03-16 Listed $155,000 GAMLS
- 2026-03-12 Listing Removed — GAMLS
- 2026-02-05 Price Changed $159,000 GAMLS
- 2025-08-28 Listed $162,000 GAMLS
- 2024-07-16 Listing Removed — GAMLS
- 2024-05-22 Listed $199,000 GAMLS
Property tax history
+8.0%/yrLatest (2025): $468 · +0.0% YoY. Source: county tax records.
Cash-flow waterfall
monthlySold comps — $/sqft
last 12 mo · ≤1 miLoading sold comps…