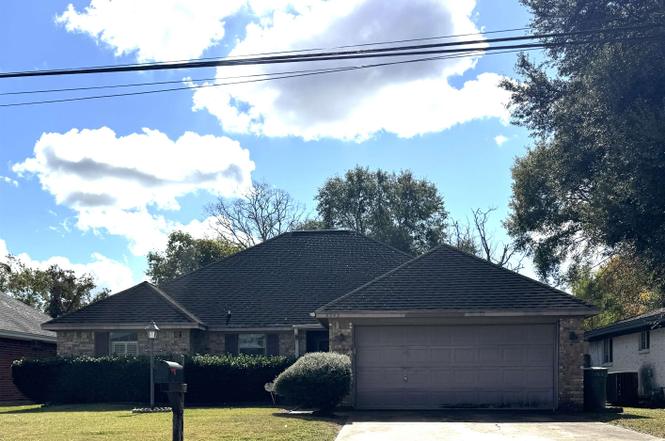
9545 Gross St · Beaumont, TX
Flood risk 4/10 · Minor
- FEMA flood zone
- X
- Chance of flooding over 30 yrs
- 0.22%
- Est. flood insurance / yr
- $507 – $1,088
Fire risk 2/10 · Minimal
- Est. fire insurance / yr
- $1,222 – $2,270
Heat risk 9/10 · Severe
- Hot days now (above 110°F)
- 7 days/yr
- Hot days in 30 yrs
- 24 days/yr
Wind risk 9/10 · Severe
- Chance of severe wind over 30 yrs
- 99.0%
Air-quality risk 2/10 · Minimal
- Unhealthy air days now
- 1 days/yr
- Unhealthy air days in 30 yrs
- 1 days/yr
Risk factors via First Street. Map © Google.
Why this score? — see what drove the D+ grade
The composite is a weighted blend of 9 inputs, each scored 0–100. Each bar is that input's sub-score; the figure is the points it added to the 100-point composite (weight × sub-score).
- Cash flow +15.0/30.0
- ARV discount +12.0/15.0
- 1% rule +5.3/10.0
- DSCR +4.6/10.0
- Livability +3.2/5.0
- Rent growth +2.5/5.0
- Condition / age +2.5/5.0
- Schools +1.5/10.0
- Appreciation +0.0/10.0
$189,000
🖨 Deal sheet (PDF) 📄 Offer letter ✓ Due diligence
Listing remarks
This well-loved 3-bedroom, 2-bath home offers comfort, space, and a great layout for everyday living or entertaining. A great addition to the home is the enclosed room off of the living room that can be used as an office, craft room or playroom for the kids. Enjoy a desirable split floor plan that provides privacy for the primary suite, along with an open kitchen that’s perfect for gathering with family and friends. The spacious backyard offers endless possibilities—plenty of room for play, gardening, or outdoor entertaining. A large storage building with a loft provides extra space for hobbies, storage, or even a future workshop. Don’t miss your chance to make this charm
Key facts
- Spacious backyard
- Split floor plan
- Enclosed room
Tags
Neighborhood map
What this means for you Summary
Snapshot
- This is a 3-bed/2.0-bath single-family listed at $189k.
Deal economics
- At list price, monthly cash flow is $59 ($707/yr) — positive.
- The deal already cash-flows at list — no discount required.
- Meets the 1% rule at list price ($2k rent vs $189k).
- Recommended offer: $166k (12.0% below list) — sets the bar for market timing.
- Cap rate 6.7% vs local median 5.3% in Beaumont — meaningfully above typical; check what's discounted (condition, days-on-market, listing class) to confirm the premium yield is real.
Location & tenants
- Location reads 64/100 on livability (#739 in TX) — a middle-class / working-renter tenant base. Strengths: cost of living A+, housing A+, health & safety A+; Watch: employment D, crime F, amenities F.
- Beaumont ISD (urban): math 14% / reading 22% proficiency, ranked #789 of 826 in TX (top 96%) — low school quality limits family demand, transient renter base, plan for 1-2y turnover; 69% free/reduced lunch — lower-income household profile, screen leases tightly.
- Zoned schools: Amelia El (math 8% / reading 15%, grade F, #4,225 of 4,322 statewide, top 98%, 544 students, 84% FRL); Vincent Middle (math 8% / reading 17%, grade F, #1,616 of 1,662 statewide, top 97%, 688 students, 75% FRL); West Brook Sr H S (math 19% / reading 34%, grade F, #1,228 of 1,632 statewide, top 76%, 2,245 students, 58% FRL) — zoned schools at 72% FRL track the district average.
- Market conditions: 151 active listings in the ZIP; 12 comparable units currently listed for rent nearby; rentals lingering (median 46d on market — plan ~5-8 weeks vacancy on turnover, expect pricing pressure); 58% of comp listings sitting > 30 days — soft ceiling on asking rent; 343 units permitted in Jefferson County in 2024 (0 in 5+ unit buildings).
- This rent runs 33% of the median local income ($70k/yr) — at the standard rent-burdened threshold; future hikes will face affordability resistance.
Forward outlook
- Local home prices are declining (-3.0%/yr); year-one equity from $1k of loan paydown is wiped out by about $6k of value loss. Plan a longer hold.
Negotiation context
- It's been on market 148 days — a 12% lower offer ($166k) is reasonable based on typical stale-listing flexibility.
Risks & watch-outs
- Watch-outs: property tax is 2.6% of price.
- Climate carrying-cost: severe wind risk, 99% chance of damaging wind over 30y; extreme-heat days projected 7→24/yr by 2055 (HVAC capex compounding) — expect insurance premiums to compound above CPI over the hold.
Questions for the listing agent
- It's been on market 148 days. Have you received any prior offers? Is the seller open to a 12% concession, seller financing, or rate buy-down credit?
- Property tax is high relative to price — has the assessment been appealed recently, and will the sale trigger a re-assessment?
- Why hasn't it sold? Are there any deal-killer items the seller is aware of (foundation, flood, title, zoning, code violations)?
- Is there a deadline driving the sale (1031 exchange, divorce, estate, relocation)? That informs how much negotiation room exists.
- Schools are D-rated, which usually means shorter tenancies and higher turnover. Who's the typical renter profile here, and what's been the actual vacancy rate?
- Crime grade is F in this area — have there been break-ins, vandalism, or insurance claims at this property in the last 3 years? What carrier currently insures it and at what premium?
- The area grade is low — what's the realistic commute time and amenity access for the typical tenant pool here? Any planned neighborhood developments (good or bad) we should know about?
- What's the average days-on-market for RENTAL listings here right now (not sales)? A rising rental-DOM trend means longer vacancies and softer asking-rent achievability than the comps imply.
- What's the recent tenant-quality profile in this submarket — average credit score on applications, eviction rate, late-payment / NSF rate, and stable-employment percentage? A property-management company in the area should have these aggregated.
- How much new for-sale + rental construction is in the pipeline within 1–3 miles? Heavy new supply typically softens prices + rents 12–24 months out; constrained supply supports both.
Investment metrics
- 1% rule
- 1.03% ✓
- Cap rate
- 6.67%
- Cash-on-cash
- 1.34%
- DSCR
- 1.06
- GRM
- 8.1
CMA / ARV
- ARV (on-the-fly)
- $209,751
- Comps found
- 5
Show comp detail 5 sales within ~0.75 mi
| Address | Dist | Beds/Ba | Sqft | Sold | Price | $/sf | Match |
|---|---|---|---|---|---|---|---|
| 9310 Josey St | 0.30mi | 3/2.0 | 1,408 (-7%) | 16mo | $69,000 | $49 | 61 |
| 9510 Shepherd Dr | 0.35mi | 3/2.0 | 1,302 (-14%) | 1mo | $182,000 | $140 | 60 |
| 9710 Mapes St | 0.17mi | 4/3.0 (+1) | 1,664 (+10%) | 14mo | $229,000 | $138 | 54 |
| 1745 Shirley Cir | 0.63mi | 3/2.0 | 1,366 (-10%) | 8mo | $195,000 | $143 | 49 |
| 9410 Guy Cir | 0.50mi | 3/1.5 | 1,282 (-15%) | 10mo | $178,000 | $139 | 41 |
Match score weights: distance 35% · size 25% · config 20% · recency 20%. Top-matched comps best support the ARV.
Projected returns pro-forma
-3.0% appreciation · 3.0% rent growth · sell at horizon
- IRR
- -14.1%
- Equity multiple
- 0.49×
- Total profit
- $-26,740
- Equity at exit
- $28,181
- IRR
- -5.2%
- Equity multiple
- 0.66×
- Total profit
- $-17,910
- Equity at exit
- $16,341
Cash invested: $52,920 (down + closing). Projections, not guarantees.
Landlord ↔ Tenant lean methodology
- Overall (STATE)
- 87 Strongly Landlord-Friendly
- State Texas
- 87 Strongly Landlord-Friendly · R+5
- County
- — inherits STATE
- City
- — inherits STATE
ZIP-level market 77707
- Active inventory
- 151
- Price-to-rent
- 8.1×
Monthly cashflow live
- Estimated rent
- $1,942 high interval (Pro) →
- Mortgage (P&I)
- −$991
- Tax from tax record
- −$406 /mo · $4,868/yr
- Insurance
- −$79
- HOA
- −$0
- Vacancy / Maint / Mgmt
- −$408
- Net cashflow
- $59
Break-even live
Sensitivity live
| Price | -10% $166 | -5% $112 | +0% $59 | +5% $5 | +10% $-48 |
|---|---|---|---|---|---|
| Rent | -10% $-95 | -5% $-18 | +0% $59 | +5% $136 | +10% $212 |
| Rate | -1.0pp $154 | -0.5pp $107 | base $59 | +0.5pp $10 | +1.0pp $-40 |
UW: 25.0% down · 7.5% · 30yr · 1.5% tax · 5.0% vac · 8.0% maint · 8.0% mgmt
Financing live
Cash to close
- Down payment
- $47,250
- Closing costs
- $5,670
- Reserves months
- —
- Total cash needed
- —
Loan-product check · same deal, 3 products live
Conventional
25% down · 7.5% · 30yr
- Down + closing
- —
- Monthly P&I
- —
- Monthly cashflow
- —
- DSCR
- —
- Eligible?
- —
Personal DTI + credit; lowest rate.
DSCR
20% down · 8.5% · 30yr
- Down + closing
- —
- Monthly P&I
- —
- Monthly cashflow
- —
- DSCR
- —
- Eligible?
- —
No personal income docs; deal must DSCR.
Hard money
10% down · 12.0% · 12mo
- Down + closing
- —
- Monthly P&I
- —
- Monthly cashflow
- —
- DSCR
- —
- Eligible?
- —
Short-term bridge; refi at stabilization.
Rent comps 12 comps
| Address | Beds | Baths | Sqft | Rent | $/sqft | DOM | Units | Dist |
|---|---|---|---|---|---|---|---|---|
| 9260 Josey St Beaumont, TX | 3.0 | 2.0 | 1500 | $2,100 | $1.40 | 45d | 1 | 0.31mi |
| 9225 Shepherd Dr Beaumont, TX | 3.0 | 1.0 | 1136 | $1,495 | $1.32 | 45d | 1 | 0.40mi |
| 120 Smelker St Beaumont, TX | 3.0 | 2.0 | 1300 | $1,795 | $1.38 | 15d | 1 | 0.69mi |
| 2065 88th Cir Beaumont, TX | 3.0 | 2.0 | 1750 | $1,800 | $1.03 | 25d | 1 | 0.94mi |
| 405 Harbor Oaks Dr Beaumont, TX | 3.0 | 2.5 | 1828 | $2,600 | $1.42 | 25d | 1 | 1.03mi |
| 434 Harbor Oaks Dr Beaumont, TX | 3.0 | 2.0 | 1844 | $2,500 | $1.36 | 25d | 1 | 1.07mi |
| 1625 Glendale St Beaumont, TX | 3.0 | 2.0 | 1330 | $1,800 | $1.35 | 45d | 1 | 1.30mi |
| 8960 Manion Dr Beaumont, TX | 2.0 | 2.5 | 1358 | $1,550 | $1.14 | 45d | 1 | 1.32mi |
| 1069 Green Meadow St Beaumont, TX | 2.0 | 2.0 | 1556 | $1,795 | $1.15 | 46d | 1 | 1.39mi |
| 976 Sunmeadow Dr Beaumont, TX | 3.0 | 2.5 | 1656 | $1,995 | $1.20 | 15d | 1 | 1.43mi |
| 976 Sunmeadow Dr Unit 05/04/26 Beaumont, TX | 3.0 | 2.5 | 1656 | $2,150 | $1.30 | 45d | 1 | 1.43mi |
| 9540 Glen Meadow Ln Beaumont, TX | 3.0 | 2.5 | 2045 | $2,295 | $1.12 | 45d | 1 | 1.50mi |
Listing history 6 events
-
2026-04-11status Pending
-
2026-02-17price $189,000
-
2025-11-26price $199,000
-
2025-11-14$211,000 Active
-
2022-01-10soldstatus
-
2021-10-28soldstatus
ⓘ Source: listings_history table (triggers on properties + properties_extension) + one-shot
backfill from property_details.listing_events for pre-trigger history.
Tax reassessment forecast TX · Resets to sale price
- Current annual tax
- $4,868 · $406/mo
- Projected year-2 tax
- $4,868 · $406/mo
- Expected delta
- $0/yr ($0/mo · 0.0%)
ⓘ Screening estimate from a state-policy table — verify with the county assessor before closing.
Climate risk First Street
- Flood 4/10 Moderate FEMA zone X · 22% chance over 30 yrs
- Wildfire 2/10 Low
- Heat 9/10 Extreme 7 d/yr ≥110°F today · 24 d/yr by 30 yrs out
- Wind 9/10 Extreme 99% chance of damaging wind over 30 yrs
- Air quality 2/10 Low 1 unhealthy d/yr today · 1 by 30 yrs out
Nearby sold comps map
Loading sold comps map…
Walkable amenities ~0.75 mi
Loading nearby amenities…
Taxation est. · year 1
- Rental income
- $23,309
- − Mortgage interest
- −$10,587
- − Property taxes
- −$4,868
- − Insurance
- −$945
- − Repairs & maintenance
- −$1,865
- − Management
- −$1,865
- − Depreciation
- −$5,498
- Taxable loss
- −$2,319
- Est. tax savings @ 24.0%
- +$557
- After-tax cash flow
- $1,264/yr
For passive investors: Depreciation is non-cash, so a rental often shows a tax loss while cash-flowing — sheltering income. Rental losses are passive: they offset passive income freely, and up to $25,000/yr can offset ordinary (W-2) income if you actively participate and your MAGI is under $100k (phasing out to $0 by $150k); unused losses carry forward. On sale, claimed depreciation is recaptured at up to 25%, and gains may owe capital-gains tax (a 1031 exchange can defer both). Figures are a year-1 estimate at your 24.0% rate — not tax advice; consult a CPA.
Schools (NCES district)
- District
- Beaumont ISD
- NCES district ID
- 4809670
- Math proficiency
- 14% ▼ -13.00%
- Reading proficiency
- 22% ▼ -7.00%
- Median HH income
- $41,683
- Composite
- 15.43/100
- National rank
- #9316
- State rank
- #789 of 826 in TX
Livability — Beaumont
- Score
- 64/100
- State rank
- #739
- US rank
- #13710
Category grades
Schools grade is shown separately in the Schools card above.
Census & demographics
- Census place
- Beaumont, TX
- County
- Jefferson County · 203,592 people
- City population
- 125,901
- Metro
- Beaumont-Port Arthur, TX
- Population (ZIP)
- 18,323
- Household income
- $69,756
- Rent vs Own
- Severe rent burden
- 596.0
Population outlook (Jefferson County) Hauer SSP2
- Today (2025)
- 259,015 people
- By 2030
- 260,685 · +0.6%
- By 2040
- 263,309 · +1.7%
- By 2050
- 265,237 · +2.4%
- By 2075
- 270,193 · +4.3%
- By 2100
- 255,628 · -1.3%
Race, ethnicity, and origin ACS 2023
- Neighborhood character
- Highly diverse neighborhood (Simpson 0.70)
- Race & ethnicity
- Black 40% White 28% Hispanic / Latino 23% Two or more races 18% Asian 6%
- Hispanic origin (detail)
- Mexican 19%
- Common ancestry
- Lithuanian 3% Italian 1% Romanian 1%
- Foreign-born
- 12% · Canada, Vietnam
- Languages at home
- 75% English-only · Spanish 19% Vietnamese 3% Other Indo-European 1%
Political lean MEDSL · Jefferson
- 2024 margin
- Lean R (+8.9) · D 45.1% · R 54.0%
- 2008→2024 swing
- -11.1pp toward R · 2008: 2.2pp · 2024: -8.9pp
- All cycles
- 2024: R+8.9 2020: R+1.6 2016: R+0.5 2012: D+1.6 2008: D+2.2
Not yet ingested
- Civics
- —
Market trends
- HPI YoY
- ▼ -163.16%
- Current HPI
- 167.8109
- Rent YoY
- —
- Metro
- Beaumont-Port Arthur, TX
- State GDP YoY
- ▲ 3.95%
- F500 in state
- 110
Industry mix (Fortune 500 HQ in TX)
| Industry | F500 HQs | Revenue |
|---|---|---|
| Energy | 16 | $1,198B |
|
||
| Technology | 5 | $198B |
|
||
| Engineering / Construction | 4 | $72B |
|
||
| Energy Services | 3 | $60B |
|
||
| Utilities | 3 | $41B |
|
||
| Healthcare | 2 | $330B |
|
||
Price history
-10.4% since first listed6 events — show timeline
- 2026-04-11 Pending — BBOR
- 2026-02-17 Price Changed $189,000 BBOR
- 2025-11-26 Price Changed $199,000 BBOR
- 2025-11-14 Listed $211,000 BBOR
- 2022-01-10 Sold (Public Records) — Public Records
- 2021-10-28 Sold (Public Records) — Public Records
Property tax history
+3.4%/yrLatest (2025): $4,868 · -0.6% YoY. Source: county tax records.
Cash-flow waterfall
monthlySold comps — $/sqft
last 12 mo · ≤1 miLoading sold comps…