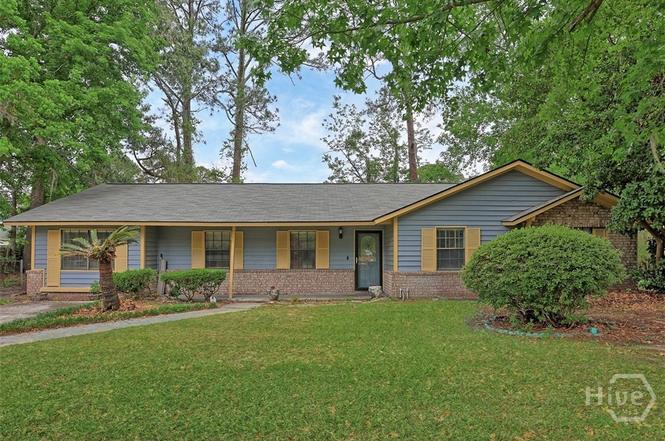
8 Williamsburg Ct · Savannah, GA
Flood risk 1/10 · Minimal
- FEMA flood zone
- X (unshaded)
- Chance of flooding over 30 yrs
- 0.0%
- Est. flood insurance / yr
- $507 – $1,088
Fire risk 3/10 · Minor
- Est. fire insurance / yr
- $963 – $1,789
Heat risk 10/10 · Severe
- Hot days now (above 106°F)
- 7 days/yr
- Hot days in 30 yrs
- 18 days/yr
Wind risk 9/10 · Severe
- Chance of severe wind over 30 yrs
- 99.0%
Air-quality risk 2/10 · Minimal
- Unhealthy air days now
- 2 days/yr
- Unhealthy air days in 30 yrs
- 2 days/yr
Risk factors via First Street. Map © Google.
Why this score? — see what drove the D+ grade
The composite is a weighted blend of 9 inputs, each scored 0–100. Each bar is that input's sub-score; the figure is the points it added to the 100-point composite (weight × sub-score).
- ARV discount +15.0/15.0
- Cash flow +14.5/30.0
- DSCR +4.4/10.0
- Livability +4.3/5.0
- 1% rule +3.2/10.0
- Condition / age +2.5/5.0
- Rent growth +2.1/5.0
- Schools +2.0/10.0
- Appreciation +0.0/10.0
$247,900
🖨 Deal sheet 📄 Offer letter ✓ Due diligence
Listing remarks MLS
Spacious open floor plan home situated on a cul-de-sac lot. e Bedrooms, 2 baths, Living room, Dining Room, Family Room, large kitchen with center island and breakfast bar that seats six, Front porch and patio. Mature landscaping and trees.
Key facts
- Upgraded hvac system
- Updated flooring
- Cozy fireplace
Tags
Property features AI
Finance
- Other: Located in Largo Woods Subdivision
Exterior
- Utilities: Public water; Public sewer; 220V electric service; Cable available; Underground utilities
- Home design: Single-family residence; One story; No shared/common walls
- Construction: Brick construction; Composition roof; Concrete perimeter and slab foundation; Built with R1 zoning
- Exterior features: Patio; Wood fencing / fenced yard; Corner, level, wooded lot; Asphalt road (publicly maintained)
Interior
- Kitchen: Dishwasher; Disposal; Microwave; Oven; Refrigerator; Electric water heater
- Bedrooms: Three main-level bedrooms
- Bathrooms: Two full bathrooms (both on the main level)
- Interior features: Wood-burning fireplace in the living room; Has view; Home warranty included
- Laundry & utility: Laundry room
Neighborhood map
What this means for you Summary
Snapshot
- This is a 3-bed/2.0-bath single-family listed at $248k.
Deal economics
- At list price, monthly cash flow is $54 ($645/yr) — positive.
- The deal already cash-flows at list — no discount required.
- To meet the 1% rule (rent ≥ 1% of price), the offer needs to be $204k (17.8% below list).
- Recommended offer: $204k (17.8% below list) — sets the bar for 1% rule.
- Cap rate 6.6% vs local median 4.0% in Savannah — top-decile yield for the area; either an underpriced asset or a hidden risk that comps aren't pricing in. Stress-test before assuming the spread holds.
Location & tenants
- Location reads 86/100 on livability (#1 in GA, #397 nationally) — a professional / high-income tenant draw. Strengths: crime A+, amenities A+, commute A+; Watch: employment D, schools F.
- Savannah-Chatham County (urban): math 20% / reading 26% proficiency, ranked #134 of 174 in GA (top 77%) — low school quality limits family demand, transient renter base, plan for 1-2y turnover.
- Market conditions: Rents soft (-1.4%/yr); 405 active listings in the ZIP; 23 comparable units currently listed for rent nearby; rentals at typical pace (median 23d on market — plan ~3-4 weeks tenant-placement turnaround); 2,694 units permitted in Chatham County in 2024 (973 in 5+ unit buildings).
- This rent runs 35% of the median local income ($70k/yr) — at the standard rent-burdened threshold; future hikes will face affordability resistance.
Forward outlook
- Local home prices are declining (-3.0%/yr); year-one equity from $2k of loan paydown is wiped out by about $7k of value loss. Plan a longer hold.
- Chatham County population projected at +33% by 2050 — long-run rental-demand tailwind backs the buy-and-hold thesis.
Negotiation context
- Only 1 days on market — expect competitive offers; lowballing is unlikely to land.
- 6 sale attempts since 20y ago with the ask held roughly flat each time — persistent listings suggest the price (not the market) is what's stuck; bring a comps-based counter.
- Current owner paid $150k; list at $248k implies a 65% gain — meaningful room to come down on a strong offer.
Risks & watch-outs
- Climate carrying-cost: severe wind risk, 99% chance of damaging wind over 30y; extreme-heat days projected 7→18/yr by 2055 (HVAC capex compounding) — expect insurance premiums to compound above CPI over the hold.
Questions for the listing agent
- Built in 1969 — when were the roof, HVAC, electrical panel, plumbing, and water heater last replaced?
- Is there a deadline driving the sale (1031 exchange, divorce, estate, relocation)? That informs how much negotiation room exists.
- Schools are F-rated, which usually means shorter tenancies and higher turnover. Who's the typical renter profile here, and what's been the actual vacancy rate?
- The area grade is low — what's the realistic commute time and amenity access for the typical tenant pool here? Any planned neighborhood developments (good or bad) we should know about?
- What's the average days-on-market for RENTAL listings here right now (not sales)? A rising rental-DOM trend means longer vacancies and softer asking-rent achievability than the comps imply.
- What's the recent tenant-quality profile in this submarket — average credit score on applications, eviction rate, late-payment / NSF rate, and stable-employment percentage? A property-management company in the area should have these aggregated.
- How much new for-sale + rental construction is in the pipeline within 1–3 miles? Heavy new supply typically softens prices + rents 12–24 months out; constrained supply supports both.
Investment metrics
- 1% rule
- 0.82% ✗
- Cap rate
- 6.55%
- Cash-on-cash
- 0.93%
- DSCR
- 1.04
- GRM
- 10.1
CMA / ARV
- ARV (on-the-fly)
- $339,430
- Comps found
- 12
Show comp detail 12 sales within ~0.75 mi
| Address | Dist | Beds/Ba | Sqft | Sold | Price | $/sf | Match |
|---|---|---|---|---|---|---|---|
| 4 Dorchester Ct | 0.19mi | 3/2.0 | 1,958 (+5%) | 5mo | $365,000 | $186 | 78 |
| 204 San Fernando Blvd | 0.29mi | 4/2.0 (+1) | 1,813 (-3%) | 8mo | $330,000 | $182 | 71 |
| 11405 Largo Dr | 0.48mi | 3/2.0 | 1,800 (-4%) | 4mo | $345,000 | $192 | 68 |
| 2 Indigo Ct | 0.59mi | 3/2.0 | 1,808 (-3%) | 6mo | $361,500 | $200 | 62 |
| 604 Sugarbush Cir | 0.45mi | 3/2.0 | 2,014 (+8%) | 6mo | $329,900 | $164 | 60 |
| 6 La Brea Blvd | 0.54mi | 3/2.0 | 1,690 (-9%) | 2mo | $330,000 | $195 | 58 |
| 302 Wilshire Blvd | 0.71mi | 3/2.0 | 1,766 (-5%) | 2mo | $285,000 | $161 | 57 |
| 202 Leeds Gate Rd | 0.65mi | 3/2.0 | 1,691 (-9%) | 1mo | $270,000 | $160 | 54 |
| 415 Wilshire Blvd | 0.47mi | 3/1.5 | 1,595 (-14%) | 2mo | $257,000 | $161 | 51 |
| 208 Leeds Gate Rd | 0.61mi | 3/2.0 | 1,686 (-10%) | 7mo | $234,995 | $139 | 50 |
| 205 Leeds Gate Rd | 0.60mi | 4/2.0 (+1) | 1,636 (-12%) | 7mo | $295,000 | $180 | 40 |
| 110 Morekis Dr | 0.58mi | 4/2.0 (+1) | 1,611 (-14%) | 8mo | $299,000 | $186 | 39 |
Match score weights: distance 35% · size 25% · config 20% · recency 20%. Top-matched comps best support the ARV.
Projected returns pro-forma
-3.0% appreciation · 0.0% rent growth · sell at horizon
- IRR
- -18.0%
- Equity multiple
- 0.38×
- Total profit
- $-42,787
- Equity at exit
- $36,963
- IRR
- -16.6%
- Equity multiple
- 0.19×
- Total profit
- $-56,200
- Equity at exit
- $21,434
Cash invested: $69,412 (down + closing). Projections, not guarantees.
Landlord ↔ Tenant lean methodology
- Overall (STATE)
- 90 Strongly Landlord-Friendly
- State Georgia
- 90 Strongly Landlord-Friendly · R+3
- County
- — inherits STATE
- City
- — inherits STATE
ZIP-level market 31419
- Home prices YoY
- -25.9%
- Rents YoY
- -1.4%
- Active inventory
- 405
- Price-to-rent
- 10.1×
Monthly cashflow live
- Estimated rent
- $2,038 high interval (Pro) →
- Mortgage (P&I)
- −$1,300
- Tax from tax record
- −$153 /mo · $1,836/yr
- Insurance
- −$103
- HOA
- −$0
- Vacancy / Maint / Mgmt
- −$428
- Net cashflow
- $54
Break-even live
UW: 25.0% down · 7.5% · 30yr · 1.5% tax · 5.0% vac · 8.0% maint · 8.0% mgmt
Financing live
Cash to close
- Down payment
- $61,975
- Closing costs
- $7,437
- Reserves months
- —
- Total cash needed
- —
Loan-product check · same deal, 3 products live
Conventional
25% down · 7.5% · 30yr
- Down + closing
- —
- Monthly P&I
- —
- Monthly cashflow
- —
- DSCR
- —
- Eligible?
- —
Personal DTI + credit; lowest rate.
DSCR
20% down · 8.5% · 30yr
- Down + closing
- —
- Monthly P&I
- —
- Monthly cashflow
- —
- DSCR
- —
- Eligible?
- —
No personal income docs; deal must DSCR.
Hard money
10% down · 12.0% · 12mo
- Down + closing
- —
- Monthly P&I
- —
- Monthly cashflow
- —
- DSCR
- —
- Eligible?
- —
Short-term bridge; refi at stabilization.
Rent comps 23 comps
| Address | Beds | Baths | Sqft | Rent | $/sqft | DOM | Units | Dist |
|---|---|---|---|---|---|---|---|---|
| 808 Jamestowne Rd Savannah, GA | 3.0 | 2.0 | 1927 | $2,000 | $1.04 | 43d | 1 | 0.23mi |
| 406 Montclair Blvd Savannah, GA | 3.0 | 2.0 | 1422 | $1,995 | $1.40 | 13d | 1 | 0.26mi |
| 10609 Middleground Rd Savannah, GA | 3.0 | 1.5 | 1886 | $1,895 | $1.00 | 43d | 1 | 0.42mi |
| 29 Ventura Blvd Savannah, GA | 3.0 | 2.0 | 1620 | $2,150 | $1.33 | 23d | 1 | 0.53mi |
| 2 La Brea Blvd Savannah, GA | 3.0 | 2.0 | 1361 | $1,900 | $1.40 | 43d | 1 | 0.55mi |
| 16 Ventura Blvd Savannah, GA | 4.0 | 2.0 | 1404 | $2,500 | $1.78 | 23d | 1 | 0.59mi |
| 10708 Egmont Rd Savannah, GA | 3.0 | 2.0 | 2131 | $2,800 | $1.31 | 43d | 1 | 0.64mi |
| 528 Wild Turkey Rd Savannah, GA | 3.0 | 2.0 | 1650 | $2,400 | $1.45 | 21d | 1 | 0.70mi |
| 210 Tibet Ave Savannah, GA | 2.0–3.0 | 1.5–2.5 | 1150 | $1,899 | $1.65 | 13d | 11 | 0.71mi |
| 15 Pointer Pl Savannah, GA | 2.0 | 2.5 | 1326 | $1,850 | $1.40 | 43d | 1 | 0.87mi |
| 205 W Montgomery Xrds Savannah, GA | 1.0–3.0 | 1.0–2.0 | 1075 | $1,850 | $1.72 | 23d | 1 | 0.88mi |
| 309 Station Trl Savannah, GA | 2.0 | 2.5 | 1587 | $1,850 | $1.17 | 43d | 1 | 0.89mi |
| 201 W Montgomery Cross Rd Savannah, GA | 1.0–3.0 | 1.0–2.0 | 1013 | $1,699 | $1.68 | 13d | 18 | 0.98mi |
| 117 Hopeland Dr Savannah, GA | 3.0 | 2.0 | 2033 | $2,400 | $1.18 | 13d | 1 | 1.11mi |
| 140 Windmill Ln Savannah, GA | 3.0 | 2.5 | 1388 | $1,775 | $1.28 | 43d | 1 | 1.20mi |
| 1114 Mohawk St Savannah, GA | 3.0 | 2.0 | 1266 | $1,750 | $1.38 | 23d | 4 | 1.24mi |
| 12 Dyches Dr Savannah, GA | 3.0 | 2.0 | 1461 | $2,000 | $1.37 | 43d | 1 | 1.26mi |
| 12473 Northwood Rd Savannah, GA | 3.0 | 2.0 | 1422 | $2,000 | $1.41 | 43d | 1 | 1.28mi |
| 11330 White Bluff Rd #26 Savannah, GA | 3.0 | 2.5 | 1975 | $2,200 | $1.11 | 23d | 1 | 1.32mi |
| 98 Hidden Lake Ct Savannah, GA | 2.0 | 1.5 | 1228 | $1,400 | $1.14 | 13d | 1 | 1.35mi |
| 11400 White Bluff Rd Savannah, GA | 1.0–3.0 | 1.0–2.0 | 1000 | $1,695 | $1.70 | 13d | 21 | 1.36mi |
| 511 Dyches Dr Savannah, GA | 3.0 | 2.0 | 1758 | $2,100 | $1.19 | 23d | 1 | 1.36mi |
| 321 Sharondale Rd Savannah, GA | 4.0 | 2.0 | 1699 | $2,100 | $1.24 | 23d | 1 | 1.40mi |
Listing history 2 events
-
2026-06-13remarks 699-char remark
-
2026-06-13$247,900 Pending 1 DOM
ⓘ Source: listings_history table (triggers on properties + properties_extension) + one-shot
backfill from property_details.listing_events for pre-trigger history.
Tax reassessment forecast GA · Resets to sale price
- Current annual tax
- $1,836 · $153/mo
- Projected year-2 tax
- $2,281 · $190/mo
- Expected delta
- +$445/yr (+$37/mo · 24.2%)
ⓘ Screening estimate from a state-policy table — verify with the county assessor before closing.
Climate risk First Street
- Flood 1/10 Low FEMA zone X (unshaded) · 0% chance over 30 yrs
- Wildfire 3/10 Moderate
- Heat 10/10 Extreme 7 d/yr ≥106°F today · 18 d/yr by 30 yrs out
- Wind 9/10 Extreme 99% chance of damaging wind over 30 yrs
- Air quality 2/10 Low 2 unhealthy d/yr today · 2 by 30 yrs out
Nearby sold comps map
Loading sold comps map…
Walkable amenities ~0.75 mi
Loading nearby amenities…
Taxation est. · year 1
- Rental income
- $24,456
- − Mortgage interest
- −$13,886
- − Property taxes
- −$1,836
- − Insurance
- −$1,240
- − Repairs & maintenance
- −$1,956
- − Management
- −$1,956
- − Depreciation
- −$7,212
- Taxable loss
- −$3,630
- Est. tax savings @ 24.0%
- +$871
- After-tax cash flow
- $1,516/yr
For passive investors: Depreciation is non-cash, so a rental often shows a tax loss while cash-flowing — sheltering income. Rental losses are passive: they offset passive income freely, and up to $25,000/yr can offset ordinary (W-2) income if you actively participate and your MAGI is under $100k (phasing out to $0 by $150k); unused losses carry forward. On sale, claimed depreciation is recaptured at up to 25%, and gains may owe capital-gains tax (a 1031 exchange can defer both). Figures are a year-1 estimate at your 24.0% rate — not tax advice; consult a CPA.
Schools (NCES district)
- District
- Savannah-Chatham County
- NCES district ID
- 1301020
- Math proficiency
- 20% ▼ -11.00%
- Reading proficiency
- 26% ▼ -5.00%
- Median HH income
- $47,443
- Composite
- 20.14/100
- National rank
- #8639
- State rank
- #134 of 174 in GA
Livability — Savannah
- Score
- 86/100
- State rank
- #1
- US rank
- #397
Category grades
Schools grade is shown separately in the Schools card above.
Census & demographics
- Census place
- Savannah, GA
- County
- Chatham County · 271,602 people
- City population
- 216,564
- Metro
- Savannah, GA
- Population (ZIP)
- 57,077
- Household income
- $69,635
- Rent vs Own
- Severe rent burden
- 2575.0
Population outlook (Chatham County) Hauer SSP2
- Today (2025)
- 332,584 people
- By 2030
- 355,508 · +6.9%
- By 2040
- 400,030 · +20.3%
- By 2050
- 443,019 · +33.2%
- By 2075
- 534,579 · +60.7%
- By 2100
- 583,863 · +75.6%
Race, ethnicity, and origin ACS 2023
- Neighborhood character
- Diverse neighborhood (Simpson 0.68)
- Race & ethnicity
- White 40% Black 38% Hispanic / Latino 12% Two or more races 7% Asian 5%
- Hispanic origin (detail)
- Mexican 4% Puerto Rican 3%
- Common ancestry
- Slovak 2% Lithuanian 1% Serbian 1%
- Foreign-born
- 12% · Canada, Vietnam, South Korea
- Languages at home
- 83% English-only · Spanish 9% Other Indo-European 2% Vietnamese 1%
Political lean MEDSL · Chatham
- 2024 margin
- D (+18.0) · D 58.6% · R 40.6%
- 2008→2024 swing
- +3.6pp toward D · 2008: 14.4pp · 2024: 18.0pp
- All cycles
- 2024: D+18.0 2020: D+18.8 2016: D+14.5 2012: D+12.0 2008: D+14.4
Not yet ingested
- Civics
- —
Market trends
- HPI YoY
- ▼ -92.38%
- Current HPI
- 264.8625
- Rent YoY
- ▼ -1.44%
- Metro
- Savannah, GA
- State GDP YoY
- ▲ 2.66%
- F500 in state
- 28
Industry mix (Fortune 500 HQ in GA)
| Industry | F500 HQs | Revenue |
|---|---|---|
| Paper / Packaging | 2 | $29B |
|
||
| Retail | 1 | $160B |
|
||
| Transportation / Logistics | 1 | $91B |
|
||
| Airlines | 1 | $62B |
|
||
| Consumer Goods | 1 | $47B |
|
||
| Utilities | 1 | $25B |
|
||
Price history
+127.6% since first listed16 events — show timeline
- 2026-06-13 Pending — Hive MLS
- 2026-06-10 Listed $247,900 Hive MLS
- 2025-11-25 Listing Removed — GAMLS
- 2025-11-11 Price Changed $275,000 GAMLS
- 2025-10-28 Relisted — GAMLS
- 2025-10-14 Pending — GAMLS
- 2025-08-12 Listed $310,000 GAMLS
- 2018-08-31 Sold (Public Records) $150,000 Public Records
- 2018-08-22 Sold (MLS) $150,000 Hive MLS
- 2018-04-29 Listed $169,000 Hive MLS
- 2012-05-31 Sold (MLS) $104,900 Hive MLS
- 2012-03-20 Listed $104,900 Hive MLS
- 2007-01-16 Sold (Public Records) $160,000 Public Records
- 2007-01-12 Sold (MLS) $160,000 Hive MLS
- 2006-03-06 Listed $165,000 Hive MLS
- 2002-08-01 Sold (Public Records) $108,900 Public Records
Property tax history
+3.5%/yrLatest (2025): $1,836 · -0.6% YoY. Source: county tax records.
Cash-flow waterfall
monthlySold comps — $/sqft
last 12 mo · ≤1 miLoading sold comps…