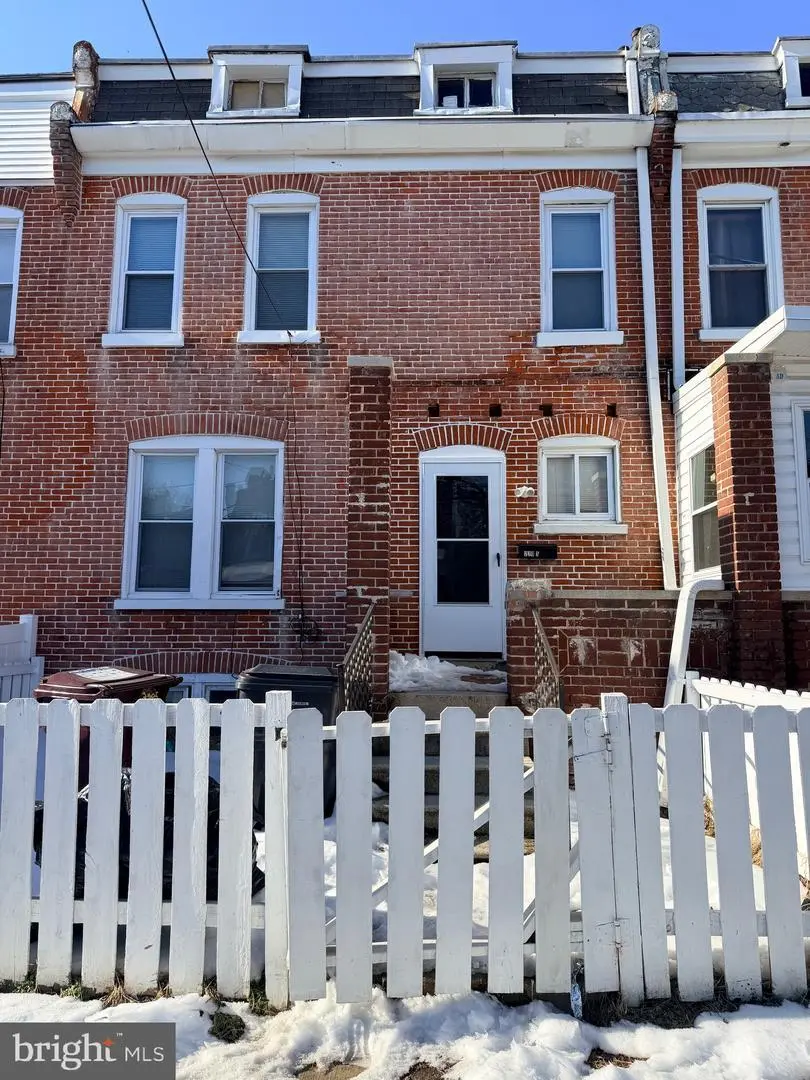
2305 Jessup St · Wilmington, DE
Flood risk 1/10 · Minimal
- FEMA flood zone
- X (unshaded)
- Chance of flooding over 30 yrs
- 0.0%
- Est. flood insurance / yr
- $473 – $860
Fire risk 1/10 · Minimal
- Est. fire insurance / yr
- $476 – $884
Heat risk 8/10 · Major
- Hot days now (above 103°F)
- 7 days/yr
- Hot days in 30 yrs
- 16 days/yr
Wind risk 6/10 · Moderate
- Chance of severe wind over 30 yrs
- 27.0%
Air-quality risk 3/10 · Minor
- Unhealthy air days now
- 2 days/yr
- Unhealthy air days in 30 yrs
- 3 days/yr
Risk factors via First Street. Map © Google.
Why this score? — see what drove the C grade
The composite is a weighted blend of 9 inputs, each scored 0–100. Each bar is that input's sub-score; the figure is the points it added to the 100-point composite (weight × sub-score).
- Cash flow +28.7/30.0
- DSCR +10.0/10.0
- 1% rule +6.7/10.0
- Rent growth +3.9/5.0
- Livability +3.2/5.0
- Schools +3.1/10.0
- Condition / age +2.5/5.0
- ARV discount +0.0/15.0
- Appreciation +0.0/10.0
$155,000
🖨 Deal sheet 📄 Offer letter ✓ Due diligence
Listing remarks MLS
Great opportunity for an investor or first-time homebuyer! This recently renovated 3-bedroom, 1-bath home features granite countertops, stainless steel appliances, and a brand-new HVAC system. Move-in ready with modern updates throughout—perfect for owner-occupants or as a low-maintenance rental investment. Schedule a showing today!
Key facts
- Built 1900
- Listed 100 days
Neighborhood map
What this means for you Summary
Snapshot
- This is a 3-bed/1.0-bath townhouse listed at $155k.
Deal economics
- At list price, monthly cash flow is $517 ($6k/yr) — positive.
- The deal already cash-flows at list — no discount required.
- Meets the 1% rule at list price ($2k rent vs $155k).
- Recommended offer: $141k (9.0% below list) — sets the bar for market timing.
- Cap rate 10.3% vs local median 5.6% in Wilmington — top-decile yield for the area; either an underpriced asset or a hidden risk that comps aren't pricing in. Stress-test before assuming the spread holds.
Location & tenants
- Location reads 64/100 on livability (#52 in DE) — a middle-class / working-renter tenant base. Strengths: cost of living A+, housing A; Watch: employment D+, schools D, commute D.
- Brandywine School District (suburban): math 28% / reading 40% proficiency, ranked #11 of 26 in DE (top 42%) — families likely to look elsewhere, expect single-tenant / working-renter base with shorter leases.
- Market conditions: Rents rising fast (+5.7%/yr); 119 active listings in the ZIP; 40 comparable units currently listed for rent nearby; rentals at typical pace (median 24d on market — plan ~3-4 weeks tenant-placement turnaround); 1,367 units permitted in New Castle County in 2024 (201 in 5+ unit buildings).
- This rent runs 41% of the median local income ($54k/yr) — at the standard rent-burdened threshold; future hikes will face affordability resistance.
Forward outlook
- Local home prices are declining (-3.0%/yr); year-one equity from $1k of loan paydown is wiped out by about $5k of value loss. Plan a longer hold.
- New Castle County population projected at +9% by 2050 — modest demand growth; plan on rents tracking national, not racing it.
- At projected returns (-3.0% appreciation + 5.7% rent growth), your $43k cash investment doubles in ~7 years — after that, you're playing with house money.
Negotiation context
- It's been on market 100 days — a 9% lower offer ($141k) is reasonable based on typical stale-listing flexibility.
- 3 sale attempts since 6y ago; this cycle's ask has dropped $15k (9%) from the opening price — seller is motivated, your offer sets the floor, not the list.
- Current owner paid $30k; list at $155k implies a 417% gain — meaningful room to come down on a strong offer.
Risks & watch-outs
- Watch-outs: built in 1900 — expect roof / HVAC / electrical / plumbing capex.
- Climate carrying-cost: major wind risk, 27% chance of damaging wind over 30y; extreme-heat days projected 7→16/yr by 2055 (HVAC capex compounding) — expect insurance premiums to compound above CPI over the hold.
Questions for the listing agent
- It's been on market 100 days. Have you received any prior offers? Is the seller open to a 9% concession, seller financing, or rate buy-down credit?
- Built in 1900 — when were the roof, HVAC, electrical panel, plumbing, and water heater last replaced?
- Why hasn't it sold? Are there any deal-killer items the seller is aware of (foundation, flood, title, zoning, code violations)?
- Is there a deadline driving the sale (1031 exchange, divorce, estate, relocation)? That informs how much negotiation room exists.
- Schools are D-rated, which usually means shorter tenancies and higher turnover. Who's the typical renter profile here, and what's been the actual vacancy rate?
- Crime grade is F in this area — have there been break-ins, vandalism, or insurance claims at this property in the last 3 years? What carrier currently insures it and at what premium?
- What's the average days-on-market for RENTAL listings here right now (not sales)? A rising rental-DOM trend means longer vacancies and softer asking-rent achievability than the comps imply.
- What's the recent tenant-quality profile in this submarket — average credit score on applications, eviction rate, late-payment / NSF rate, and stable-employment percentage? A property-management company in the area should have these aggregated.
- How much new for-sale + rental construction is in the pipeline within 1–3 miles? Heavy new supply typically softens prices + rents 12–24 months out; constrained supply supports both.
Investment metrics
- 1% rule
- 1.17% ✓
- Cap rate
- 10.30%
- Cash-on-cash
- 14.30%
- DSCR
- 1.64
- GRM
- 7.1
CMA / ARV
- ARV (median comp)
- $117,363
- List price
- $155,000
- Delta
- 32.07%
- Verdict
- OVERPRICED
- Comps
- 20 within 1.0 mi
Show comp detail 12 sales within ~0.75 mi
| Address | Dist | Beds/Ba | Sqft | Sold | Price | $/sf | Match |
|---|---|---|---|---|---|---|---|
| 2412 Lamotte St | 0.09mi | 3/1.0 | 1,275 (+2%) | 0mo | $125,000 | $98 | 92 |
| 212 W 25th St | 0.32mi | 3/1.0 | 1,225 (-2%) | 1mo | $80,000 | $65 | 81 |
| 2708 Thompson Pl | 0.44mi | 3/1.0 | 1,175 (-6%) | 1mo | $215,000 | $183 | 69 |
| 2717 N West St | 0.37mi | 3/1.0 | 1,150 (-8%) | 2mo | $155,000 | $135 | 68 |
| 709 E 26th St | 0.24mi | 3/2.5 | 1,375 (+10%) | 0mo | $230,000 | $167 | 66 |
| 623 W Twenty Eighth St | 0.69mi | 3/1.5 | 1,250 (0%) | 0mo | $235,000 | $188 | 65 |
| 1212 N Tatnall St | 0.70mi | 3/1.0 | 1,275 (+2%) | 0mo | $165,000 | $129 | 64 |
| 3208 N Madison St | 0.69mi | 3/1.0 | 1,200 (-4%) | 2mo | $274,999 | $229 | 60 |
| 2011 N West St | 0.38mi | 4/1.0 (+1) | 1,375 (+10%) | 1mo | $135,000 | $98 | 60 |
| 1313 N Walnut St | 0.49mi | 2/1.0 (-1) | 1,350 (+8%) | 0mo | $155,000 | $115 | 58 |
| 222 E 30th St | 0.39mi | 3/2.0 | 1,400 (+12%) | 1mo | $280,000 | $200 | 57 |
| 1029 Clifford Brown Walk | 0.64mi | 4/1.5 (+1) | 1,175 (-6%) | 2mo | $30,000 | $26 | 52 |
Match score weights: distance 35% · size 25% · config 20% · recency 20%. Top-matched comps best support the ARV.
Projected returns pro-forma
-3.0% appreciation · 5.72% rent growth · sell at horizon
- IRR
- 7.4%
- Equity multiple
- 1.30×
- Total profit
- $12,867
- Equity at exit
- $23,111
- IRR
- 18.7%
- Equity multiple
- 2.74×
- Total profit
- $75,508
- Equity at exit
- $13,402
Cash invested: $43,400 (down + closing). Projections, not guarantees.
Landlord ↔ Tenant lean methodology
- Overall (STATE)
- 70 Landlord-Friendly
- State Delaware
- 70 Landlord-Friendly · D+7
- County
- — inherits STATE
- City
- — inherits STATE
ZIP-level market 19802
- Rents YoY
- 5.7%
- Active inventory
- 119
- Price-to-rent
- 7.1×
Monthly cashflow live
- Estimated rent
- $1,816 high interval (Pro) →
- Mortgage (P&I)
- −$813
- Tax from tax record
- −$40 /mo · $481/yr
- Insurance
- −$65
- HOA
- −$0
- Vacancy / Maint / Mgmt
- −$381
- Net cashflow
- $517
Break-even live
UW: 25.0% down · 7.5% · 30yr · 1.5% tax · 5.0% vac · 8.0% maint · 8.0% mgmt
Financing live
Cash to close
- Down payment
- $38,750
- Closing costs
- $4,650
- Reserves months
- —
- Total cash needed
- —
Loan-product check · same deal, 3 products live
Conventional
25% down · 7.5% · 30yr
- Down + closing
- —
- Monthly P&I
- —
- Monthly cashflow
- —
- DSCR
- —
- Eligible?
- —
Personal DTI + credit; lowest rate.
DSCR
20% down · 8.5% · 30yr
- Down + closing
- —
- Monthly P&I
- —
- Monthly cashflow
- —
- DSCR
- —
- Eligible?
- —
No personal income docs; deal must DSCR.
Hard money
10% down · 12.0% · 12mo
- Down + closing
- —
- Monthly P&I
- —
- Monthly cashflow
- —
- DSCR
- —
- Eligible?
- —
Short-term bridge; refi at stabilization.
Rent comps 40 comps
| Address | Beds | Baths | Sqft | Rent | $/sqft | DOM | Units | Dist |
|---|---|---|---|---|---|---|---|---|
| 103 E 24th St Unit 1 Wilmington, DE | 3.0 | 1.0 | 1025 | $1,795 | $1.75 | 43d | 1 | 0.05mi |
| 5 E 24th St Unit 1 Wilmington, DE | 3.0 | 1.0 | 1150 | $1,795 | $1.56 | 43d | 1 | 0.12mi |
| 2518 N Tatnall St Wilmington, DE | 4.0 | 1.5 | 1575 | $1,995 | $1.27 | 43d | 1 | 0.22mi |
| 2705 Speakman Pl Wilmington, DE | 3.0 | 1.5 | 1100 | $1,975 | $1.80 | 12d | 1 | 0.23mi |
| 125 W 23rd St Wilmington, DE | 4.0 | 2.0 | 1672 | $1,995 | $1.19 | 43d | 1 | 0.29mi |
| 2401 N West St Wilmington, DE | 4.0 | 1.0 | 1650 | $1,900 | $1.15 | 15d | 1 | 0.31mi |
| 918 E 17th St Unit 1 Wilmington, DE | 3.0 | 1.0 | 1100 | $1,795 | $1.63 | 1d | 1 | 0.38mi |
| 302 W 23rd St Unit 1 Wilmington, DE | 2.0 | 1.0 | 1450 | $1,295 | $0.89 | 24d | 1 | 0.41mi |
| 2601 N Heald St Wilmington, DE | 3.0 | 1.0 | 1025 | $1,795 | $1.75 | 1d | 1 | 0.41mi |
| 306 W 23rd St Unit 1 Wilmington, DE | 2.0 | 1.0 | 1475 | $1,295 | $0.88 | 24d | 1 | 0.42mi |
| 306 W 23rd St Unit 2 Wilmington, DE | 2.0 | 1.0 | 1475 | $1,295 | $0.88 | 43d | 1 | 0.42mi |
| 306 Concord Ave Unit 2 Wilmington, DE | 3.0 | 1.0 | 1100 | $1,350 | $1.23 | 43d | 1 | 0.42mi |
| 314 Concord Ave Unit 2 Wilmington, DE | 2.0 | 1.0 | 1300 | $1,295 | $1.00 | 24d | 1 | 0.43mi |
| 3005 N West St Wilmington, DE | 3.0 | 1.0 | 1176 | $1,900 | $1.62 | 24d | 1 | 0.48mi |
| 2923 N Washington St Wilmington, DE | 3.0 | 1.0 | 1225 | $1,600 | $1.31 | 1d | 1 | 0.49mi |
| 400 W 29th St Wilmington, DE | 3.0 | 1.5 | 1125 | $1,950 | $1.73 | 43d | 1 | 0.51mi |
| 3003 N Washington St Wilmington, DE | 3.0 | 1.0 | 1250 | $1,950 | $1.56 | 43d | 1 | 0.51mi |
| 409 W 20th St Unit 2 Wilmington, DE | 2.0 | 1.0 | 1100 | $1,500 | $1.36 | 12d | 1 | 0.55mi |
| 409 W 20th St Unit 2 Wilmington, DE | 2.0 | 1.0 | 1100 | $1,700 | $1.55 | 10d | 1 | 0.55mi |
| 518 E 12th St Wilmington, DE | 2.0 | 1.0 | 875 | $1,425 | $1.63 | 20d | 1 | 0.56mi |
| 517 W 26th St Unit NA Wilmington, DE | 3.0 | 1.5 | 1344 | $1,900 | $1.41 | 24d | 1 | 0.56mi |
| 1124 Clifford Brown Walk Wilmington, DE | 2.0 | 1.0 | 1240 | $1,625 | $1.31 | 43d | 1 | 0.59mi |
| 1217 N King St Wilmington, DE | 3.0 | 1.5 | 1300 | $2,145 | $1.65 | 18d | 1 | 0.59mi |
| 107 W 13th St Wilmington, DE | 3.0 | 1.5 | 1325 | $1,895 | $1.43 | 43d | 1 | 0.65mi |
| 604 W 20th St Unit 2 Wilmington, DE | 2.0 | 1.0 | 900 | $1,195 | $1.33 | 24d | 1 | 0.65mi |
| 1026 Bennett St Wilmington, DE | 3.0 | 1.0 | 1125 | $1,685 | $1.50 | 1d | 1 | 0.66mi |
| 1004 N Spruce St Wilmington, DE | 3.0 | 1.5 | 1075 | $1,800 | $1.67 | 18d | 1 | 0.67mi |
| 605 E 10th St Wilmington, DE | 3.0 | 1.0 | 1200 | $1,850 | $1.54 | 24d | 1 | 0.68mi |
| 547 Eastlawn Ave Wilmington, DE | 3.0 | 1.0 | 1400 | $1,995 | $1.43 | 43d | 1 | 0.69mi |
| 928 Kirkwood St Wilmington, DE | 3.0 | 1.5 | 1150 | $1,700 | $1.48 | 17d | 1 | 0.72mi |
| 1001 N Orange St Wilmington, DE | 1.0–2.0 | 1.0–2.0 | 833 | $2,135 | $2.56 | 1d | 62 | 0.78mi |
| 913 N Market St Wilmington, DE | 1.0–2.0 | 1.0–2.0 | 974 | $1,985 | $2.04 | 43d | 5 | 0.81mi |
| 507 Barrett St Wilmington, DE | 3.0 | 1.0 | 1275 | $1,700 | $1.33 | 43d | 1 | 0.88mi |
| 116 W 9th St Wilmington, DE | 1.0–2.0 | 1.0–2.0 | 813 | $2,250 | $2.77 | 1d | 16 | 0.88mi |
| 212 W 9th St Unit 204 Wilmington, DE | 2.0 | 2.0 | 1671 | $1,745 | $1.04 | 5d | 1 | 0.89mi |
| 212 W 9th St Unit 204 Wilmington, DE | 2.0 | 2.0 | 1671 | $1,795 | $1.07 | 43d | 1 | 0.89mi |
| 228 W 9th St Unit 201 Wilmington, DE | 2.0 | 2.0 | 1031 | $1,695 | $1.64 | 44d | 1 | 0.90mi |
| 903 Shallcross Ave Wilmington, DE | 2.0 | 1.5 | 1575 | $2,195 | $1.39 | 24d | 1 | 0.90mi |
| 801 N Market St Unit 207 Wilmington, DE | 2.0 | 2.0 | 1239 | $1,895 | $1.53 | 5d | 1 | 0.92mi |
| 801 N Orange St Wilmington, DE | 3.0 | 1.0–3.0 | 1118 | $3,991 | $3.57 | 2d | 117 | 0.92mi |
Listing history 26 events
-
2026-06-18days on market $155,000 Active 100 DOM
-
2026-06-17days on market $155,000 Active 99 DOM
-
2026-06-16days on market $155,000 Active 98 DOM
-
2026-06-15days on market $155,000 Active 97 DOM
-
2026-06-13days on market $155,000 Active 95 DOM
-
2026-06-09days on market $155,000 Active 91 DOM
-
2026-06-08days on market $155,000 Active 90 DOM
-
2026-06-07days on market $155,000 Active 89 DOM
-
2026-06-04remarks 368-char remark
-
2026-06-04days on market $155,000 Active 86 DOM
-
2026-06-03days on market $155,000 Active 85 DOM
-
2026-06-02days on market $155,000 Active 84 DOM
-
2026-06-02remarks 350-char remark
-
2026-06-02price $155,000 Active 83 DOM
-
2026-06-01days on market $165,000 Active 83 DOM
-
2026-05-31days on market $165,000 Active 82 DOM
-
2026-05-11status Active 340-char remark
Show marketing remark (340 chars)
Great opportunity for an investor or first-time homebuyer! This recently renovated 3-bedroom, 1-bath home features granite countertops, stainless steel appliances, and a brand-new HVAC system. Move-in ready with modern updates throughout—perfect for owner-occupants or as a low-maintenance rental investment. Schedule a showing today!
-
2026-04-05historical Active Under Contract 340-char remark
Show marketing remark (340 chars)
Great opportunity for an investor or first-time homebuyer! This recently renovated 3-bedroom, 1-bath home features granite countertops, stainless steel appliances, and a brand-new HVAC system. Move-in ready with modern updates throughout—perfect for owner-occupants or as a low-maintenance rental investment. Schedule a showing today!
-
2026-03-18price $165,000 340-char remark
Show marketing remark (340 chars)
Great opportunity for an investor or first-time homebuyer! This recently renovated 3-bedroom, 1-bath home features granite countertops, stainless steel appliances, and a brand-new HVAC system. Move-in ready with modern updates throughout—perfect for owner-occupants or as a low-maintenance rental investment. Schedule a showing today!
-
2026-02-02$170,000 Active 340-char remark
Show marketing remark (340 chars)
Great opportunity for an investor or first-time homebuyer! This recently renovated 3-bedroom, 1-bath home features granite countertops, stainless steel appliances, and a brand-new HVAC system. Move-in ready with modern updates throughout—perfect for owner-occupants or as a low-maintenance rental investment. Schedule a showing today!
-
2026-01-31historical $170,000 340-char remark
Show marketing remark (340 chars)
Great opportunity for an investor or first-time homebuyer! This recently renovated 3-bedroom, 1-bath home features granite countertops, stainless steel appliances, and a brand-new HVAC system. Move-in ready with modern updates throughout—perfect for owner-occupants or as a low-maintenance rental investment. Schedule a showing today!
-
2021-01-15soldstatus $30,000 Closed 126-char remark
Show marketing remark (126 chars)
INVESTOR ALERT! This is your opportunity to own a home in the city of Wilmington. Come check it out and bring your best offer.
-
2020-12-17status Pending 126-char remark
Show marketing remark (126 chars)
INVESTOR ALERT! This is your opportunity to own a home in the city of Wilmington. Come check it out and bring your best offer.
-
2020-11-30price $40,000 126-char remark
Show marketing remark (126 chars)
INVESTOR ALERT! This is your opportunity to own a home in the city of Wilmington. Come check it out and bring your best offer.
-
2020-11-20price $45,000 126-char remark
Show marketing remark (126 chars)
INVESTOR ALERT! This is your opportunity to own a home in the city of Wilmington. Come check it out and bring your best offer.
-
2020-09-22$54,000 Active 126-char remark
Show marketing remark (126 chars)
INVESTOR ALERT! This is your opportunity to own a home in the city of Wilmington. Come check it out and bring your best offer.
ⓘ Source: listings_history table (triggers on properties + properties_extension) + one-shot
backfill from property_details.listing_events for pre-trigger history.
Tax reassessment forecast DE · Partial reset (capped growth)
- Current annual tax
- $481 · $40/mo
- Projected year-2 tax
- $690 · $58/mo
- Expected delta
- +$209/yr (+$17/mo · 43.4%)
ⓘ Screening estimate from a state-policy table — verify with the county assessor before closing.
Climate risk First Street
- Flood 1/10 Low FEMA zone X (unshaded) · 0% chance over 30 yrs
- Wildfire 1/10 Low
- Heat 8/10 Severe 7 d/yr ≥103°F today · 16 d/yr by 30 yrs out
- Wind 6/10 Major 27% chance of damaging wind over 30 yrs
- Air quality 3/10 Moderate 2 unhealthy d/yr today · 3 by 30 yrs out
Nearby sold comps map
Loading sold comps map…
Walkable amenities ~0.75 mi
Loading nearby amenities…
Taxation est. · year 1
- Rental income
- $21,795
- − Mortgage interest
- −$8,682
- − Property taxes
- −$481
- − Insurance
- −$775
- − Repairs & maintenance
- −$1,744
- − Management
- −$1,744
- − Depreciation
- −$4,509
- Taxable income
- $3,860
- Est. tax owed @ 24.0%
- −$926
- After-tax cash flow
- $5,281/yr
For passive investors: Depreciation is non-cash, so a rental often shows a tax loss while cash-flowing — sheltering income. Rental losses are passive: they offset passive income freely, and up to $25,000/yr can offset ordinary (W-2) income if you actively participate and your MAGI is under $100k (phasing out to $0 by $150k); unused losses carry forward. On sale, claimed depreciation is recaptured at up to 25%, and gains may owe capital-gains tax (a 1031 exchange can defer both). Figures are a year-1 estimate at your 24.0% rate — not tax advice; consult a CPA.
Schools (NCES district)
- District
- Brandywine School District
- NCES district ID
- 1001240
- Math proficiency
- 28% ▼ -13.00%
- Reading proficiency
- 40% ▼ -13.00%
- Median HH income
- $68,743
- Composite
- 31.27/100
- National rank
- #6019
- State rank
- #11 of 26 in DE
Livability — Wilmington
- Score
- 64/100
- State rank
- #52
- US rank
- #14251
Category grades
Schools grade is shown separately in the Schools card above.
Census & demographics
- Census place
- Wilmington, DE
- County
- New Castle County · 483,412 people
- City population
- 173,480
- Metro
- Philadelphia-Camden-Wilmington, PA-NJ-DE-MD
- Population (ZIP)
- 26,051
- Household income
- $53,812
- Rent vs Own
- Severe rent burden
- 1816.0
Population outlook (New Castle County) Hauer SSP2
- Today (2025)
- 594,686 people
- By 2030
- 609,164 · +2.4%
- By 2040
- 632,154 · +6.3%
- By 2050
- 649,068 · +9.1%
- By 2075
- 687,771 · +15.7%
- By 2100
- 694,961 · +16.9%
Race, ethnicity, and origin ACS 2023
- Neighborhood character
- Predominantly Black (68%)
- Race & ethnicity
- Black 68% White 20% Hispanic / Latino 7% Two or more races 5%
- Hispanic origin (detail)
- Puerto Rican 4%
- Common ancestry
- Slovak 1% Romanian 1% Italian 1%
- Foreign-born
- 11% · Canada, Jamaica, China
- Languages at home
- 92% English-only · Spanish 4% Arabic 0%
Political lean MEDSL · New Castle
- 2024 margin
- Solid D (+32.6) · D 65.5% · R 32.9% · Other 1.6%
- 2008→2024 swing
- -8.1pp toward R · 2008: 40.6pp · 2024: 32.6pp
- All cycles
- 2024: D+32.6 2020: D+37.1 2016: D+29.6 2012: D+34.1 2008: D+40.6
Not yet ingested
- Civics
- —
Market trends
- HPI YoY
- ▼ -296.47%
- Current HPI
- 225.6613
- Rent YoY
- ▲ 5.72%
- Metro
- Philadelphia-Camden-Wilmington, PA-NJ-DE-MD
- State GDP YoY
- —
- F500 in state
- 0
Price history
+205.6% since first listed10 events — show timeline
- 2026-05-11 Relisted — BRIGHT MLS
- 2026-04-05 Contingent — BRIGHT MLS
- 2026-03-18 Price Changed $165,000 BRIGHT MLS
- 2026-02-02 Listed $170,000 BRIGHT MLS
- 2026-01-31 Coming Soon $170,000 BRIGHT MLS
- 2021-01-15 Sold (MLS) $30,000 BRIGHT MLS
- 2020-12-17 Pending — BRIGHT MLS
- 2020-11-30 Price Changed $40,000 BRIGHT MLS
- 2020-11-20 Price Changed $45,000 BRIGHT MLS
- 2020-09-22 Listed $54,000 BRIGHT MLS
Property tax history
-13.2%/yrLatest (2024): $481 · +10.2% YoY. Source: county tax records.
Cash-flow waterfall
monthlySold comps — $/sqft
last 12 mo · ≤1 miLoading sold comps…