161 Seven Seas Way #161 · Berkshire Lakes, FL
Flood risk 5/10 · Moderate
- FEMA flood zone
- X (shaded)
- Chance of flooding over 30 yrs
- 0.48%
- Est. flood insurance / yr
- $507 – $1,088
Fire risk 1/10 · Minimal
- Est. fire insurance / yr
- $947 – $1,759
Heat risk 10/10 · Severe
- Hot days now (above 107°F)
- 7 days/yr
- Hot days in 30 yrs
- 27 days/yr
Wind risk 10/10 · Severe
- Chance of severe wind over 30 yrs
- 99.0%
Air-quality risk 2/10 · Minimal
- Unhealthy air days now
- 2 days/yr
- Unhealthy air days in 30 yrs
- 2 days/yr
Risk factors via First Street. Map © Google.
Why this score? — see what drove the B- grade
The composite is a weighted blend of 9 inputs, each scored 0–100. Each bar is that input's sub-score; the figure is the points it added to the 100-point composite (weight × sub-score).
- Cash flow +30.0/30.0
- 1% rule +10.0/10.0
- DSCR +10.0/10.0
- ARV discount +7.5/15.0
- Schools +5.0/10.0
- Livability +2.5/5.0
- Condition / age +2.5/5.0
- Rent growth +2.2/5.0
- Appreciation +0.0/10.0
$235,000
🖨 Deal sheet (PDF) 📄 Offer letter ✓ Due diligence
Listing remarks
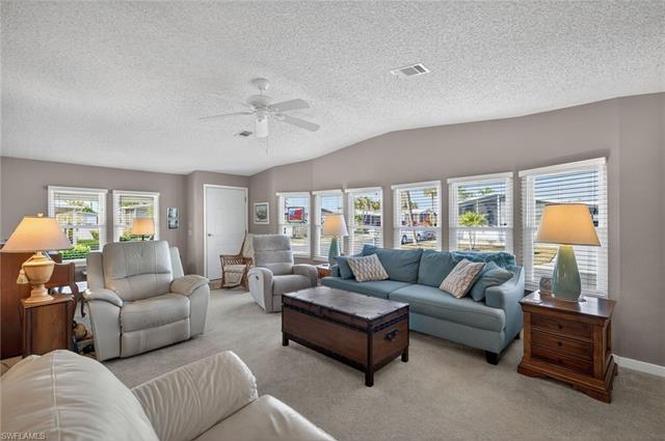
Enter through the front door into a spacious living area featuring a built-in wall unit—perfect for a large screen TV—with cabinets below providing generous storage. The dining area flows seamlessly from the living space and sits conveniently adjacent to the upgraded kitchen, which offers abundant counter space, updated finishes, and a center cooking island with an attached breakfast bar—ideal for casual meals or morning coffee. Just beyond the kitchen, the family room creates a comfortable secondary living space and leads to the large primary bedroom or second bedroom, both offering ample closet storage. The lanai provides a cozy spot to relax, read, or enjoy your favorit
Key facts
- Garage
- Community pool
- Built 1989
Neighborhood map
What this means for you Summary
Snapshot
- This is a 2-bed/2.0-bath manufactured listed at $235k.
Deal economics
- At list price, monthly cash flow is $2k ($19k/yr) — positive.
- The deal already cash-flows at list — no discount required.
- Meets the 1% rule at list price ($4k rent vs $235k).
Location & tenants
- Location reads: area grade B — affects rentability + tenant quality, not the cash-flow math above.
- Collier (suburban): math 60% / reading 56% proficiency, ranked #16 of 73 in FL (top 22%) — acceptable for families but not a draw, mixed tenant base, ~2y average lease.
- Market conditions: Rents soft (-1.1%/yr); 440 active listings in the ZIP; 40 comparable units currently listed for rent nearby; rentals at typical pace (median 22d on market — plan ~3-4 weeks tenant-placement turnaround); 3,520 units permitted in Collier County in 2024 (959 in 5+ unit buildings).
- At $3,954/mo this rent would consume 66% of the median local household income ($72k/yr) (locally 1423% of renters already pay >50% of income on rent) — very limited rent-growth headroom before tenants either downsize or default.
Forward outlook
- Local home prices are declining (-3.0%/yr); year-one equity from $2k of loan paydown is wiped out by about $7k of value loss. Plan a longer hold.
- Collier County population projected at +30% by 2050 — long-run rental-demand tailwind backs the buy-and-hold thesis.
- At projected returns (-3.0% appreciation + 0.0% rent growth), your $66k cash investment doubles in ~5 years — after that, you're playing with house money.
Negotiation context
- Only 0 days on market — expect competitive offers; lowballing is unlikely to land.
- Current owner paid $95k; list at $235k implies a 147% gain — meaningful room to come down on a strong offer.
Risks & watch-outs
- Climate carrying-cost: moderate flood risk; severe wind risk, 99% chance of damaging wind over 30y; extreme-heat days projected 7→27/yr by 2055 (HVAC capex compounding) — expect insurance premiums to compound above CPI over the hold.
Questions for the listing agent
- What does the HOA fee cover, when was the last increase, and are there any pending special assessments or reserve-fund shortfalls?
- Is there a deadline driving the sale (1031 exchange, divorce, estate, relocation)? That informs how much negotiation room exists.
- What's the average days-on-market for RENTAL listings here right now (not sales)? A rising rental-DOM trend means longer vacancies and softer asking-rent achievability than the comps imply.
- What's the recent tenant-quality profile in this submarket — average credit score on applications, eviction rate, late-payment / NSF rate, and stable-employment percentage? A property-management company in the area should have these aggregated.
- How much new for-sale + rental construction is in the pipeline within 1–3 miles? Heavy new supply typically softens prices + rents 12–24 months out; constrained supply supports both.
Investment metrics
- 1% rule
- 1.68% ✓
- Cap rate
- 14.19%
- Cash-on-cash
- 28.22%
- DSCR
- 2.26
- GRM
- 5.0
CMA / ARV
No comps found within radius.
Projected returns pro-forma
-3.0% appreciation · 0.0% rent growth · sell at horizon
- IRR
- 19.0%
- Equity multiple
- 1.74×
- Total profit
- $48,909
- Equity at exit
- $35,039
- IRR
- 25.2%
- Equity multiple
- 2.90×
- Total profit
- $124,823
- Equity at exit
- $20,319
Cash invested: $65,800 (down + closing). Projections, not guarantees.
Landlord ↔ Tenant lean methodology
- Overall (STATE)
- 87 Strongly Landlord-Friendly
- State Florida
- 87 Strongly Landlord-Friendly · R+3
- County
- — inherits STATE
- City
- — inherits STATE
ZIP-level market 34104
- Rents YoY
- -1.1%
- Active inventory
- 440
- Price-to-rent
- 5.0×
Monthly cashflow live
- Estimated rent
- $3,954 high interval (Pro) →
- Mortgage (P&I)
- −$1,232
- Tax from tax record
- −$84 /mo · $1,012/yr
- Insurance
- −$98
- HOA
- −$162
- Vacancy / Maint / Mgmt
- −$830
- Net cashflow
- $1,547
Break-even live
Sensitivity live
| Price | -10% $1,680 | -5% $1,614 | +0% $1,547 | +5% $1,481 | +10% $1,414 |
|---|---|---|---|---|---|
| Rent | -10% $1,235 | -5% $1,391 | +0% $1,547 | +5% $1,703 | +10% $1,860 |
| Rate | -1.0pp $1,666 | -0.5pp $1,607 | base $1,547 | +0.5pp $1,486 | +1.0pp $1,424 |
UW: 25.0% down · 7.5% · 30yr · 1.5% tax · 5.0% vac · 8.0% maint · 8.0% mgmt
Financing live
Cash to close
- Down payment
- $58,750
- Closing costs
- $7,050
- Reserves months
- —
- Total cash needed
- —
Loan-product check · same deal, 3 products live
Conventional
25% down · 7.5% · 30yr
- Down + closing
- —
- Monthly P&I
- —
- Monthly cashflow
- —
- DSCR
- —
- Eligible?
- —
Personal DTI + credit; lowest rate.
DSCR
20% down · 8.5% · 30yr
- Down + closing
- —
- Monthly P&I
- —
- Monthly cashflow
- —
- DSCR
- —
- Eligible?
- —
No personal income docs; deal must DSCR.
Hard money
10% down · 12.0% · 12mo
- Down + closing
- —
- Monthly P&I
- —
- Monthly cashflow
- —
- DSCR
- —
- Eligible?
- —
Short-term bridge; refi at stabilization.
Rent comps 40 comps
| Address | Beds | Baths | Sqft | Rent | $/sqft | DOM | Units | Dist |
|---|---|---|---|---|---|---|---|---|
| 1025 Jardin Dr Naples, FL | 3.0 | 3.0 | 1756 | $5,000 | $2.85 | 14d | 1 | 0.29mi |
| 1106 Jardin Dr Naples, FL | 3.0 | 3.0 | 1801 | $8,500 | $4.72 | 24d | 1 | 0.41mi |
| 5301 Whitten Dr #81 Naples, FL | 3.0 | 2.0 | 1386 | $2,700 | $1.95 | 24d | 1 | 0.42mi |
| 6825 Sterling Greens Dr #102 Naples, FL | 3.0 | 2.0 | 1499 | $4,500 | $3.00 | 24d | 1 | 0.50mi |
| 5257 Whitten Dr Naples, FL | 2.0 | 2.0 | 1500 | $2,500 | $1.67 | 15d | 1 | 0.51mi |
| 6816 Sterling Greens Dr Unit 1306 Naples, FL | 3.0 | 2.0 | 1506 | $2,900 | $1.93 | 15d | 1 | 0.51mi |
| 6816 Sterling Greens Dr Unit 1105 Naples, FL | 2.0 | 2.0 | 1243 | $1,895 | $1.52 | 15d | 1 | 0.51mi |
| 6816 Sterling Greens Pl #105 Naples, FL | 2.0 | 2.0 | 1243 | $1,895 | $1.52 | 22d | 1 | 0.51mi |
| 6700 Dennis Cir Unit A103 Naples, FL | 2.0 | 2.0 | 1308 | $2,000 | $1.53 | 15d | 1 | 0.52mi |
| 7065 Dennis Cir #302 Naples, FL | 2.0 | 2.0 | 1097 | $4,000 | $3.65 | 22d | 1 | 0.52mi |
| 6726 Sloane Pl Unit 1049716P Naples, FL | 3.0 | 2.0 | 1872 | $5,748 | $3.07 | 15d | 1 | 0.54mi |
| 6828 Sterling Greens Dr Unit 4105 Naples, FL | 2.0 | 2.0 | 1242 | $3,750 | $3.02 | 15d | 1 | 0.56mi |
| 1051 Eastham Way Unit B104 Naples, FL | 2.0 | 2.0 | 1091 | $4,300 | $3.94 | 15d | 1 | 0.59mi |
| 6854 Sterling Greens Dr #201 Naples, FL | 3.0 | 2.0 | 1727 | $4,500 | $2.61 | 15d | 1 | 0.61mi |
| 92 Glen Eagle Cir Naples, FL | 3.0 | 2.0 | 1562 | $12,000 | $7.68 | 22d | 1 | 0.63mi |
| 1100 Eastham Way Unit A-105 Naples, FL | 2.0 | 2.0 | 1184 | $4,500 | $3.80 | 15d | 1 | 0.64mi |
| 6871 Sterling Greens Dr #202 Naples, FL | 2.0 | 2.0 | 1727 | $5,500 | $3.18 | 15d | 1 | 0.66mi |
| 193 Fox Glen Dr Naples, FL | 3.0 | 2.0 | 1345 | $6,500 | $4.83 | 24d | 1 | 0.69mi |
| 1748 Royal Cir Naples, FL | 3.0 | 2.0 | 1451 | $3,200 | $2.21 | 24d | 1 | 0.69mi |
| 1208 Chelmsford Ct #67 Naples, FL | 2.0 | 2.0 | 1556 | $9,000 | $5.78 | 24d | 1 | 0.72mi |
| 6643 Craven Hill Way Naples, FL | 3.0 | 2.0 | 1384 | $2,900 | $2.10 | 15d | 1 | 0.73mi |
| 1787 Reuven Cir Unit 1001 Naples, FL | 2.0 | 2.0 | 1112 | $1,300 | $1.17 | 15d | 1 | 0.76mi |
| 1075 Foxfire Ln Naples, FL | 2.0 | 2.0 | 1092 | $3,300 | $3.02 | 24d | 3 | 0.81mi |
| 1810 Florida Club Cir Naples, FL | 2.0 | 2.0 | 1200 | $2,075 | $1.73 | 15d | 2 | 0.84mi |
| 1820 Florida Club Cir Naples, FL | 3.0 | 2.0 | 1282 | $2,850 | $2.22 | 24d | 2 | 0.86mi |
| 589 Lambton Ln Naples, FL | 3.0 | 2.0 | 1823 | $7,750 | $4.25 | 24d | 1 | 0.87mi |
| 882 Bluebird St Naples, FL | 3.0 | 2.0 | 1308 | $6,000 | $4.59 | 24d | 1 | 0.88mi |
| 1840 Florida Club Cir #5309 Naples, FL | 2.0 | 1.0 | 1328 | $2,300 | $1.73 | 24d | 1 | 0.89mi |
| 1830 Florida Club Cir #4111 Naples, FL | 3.0 | 2.0 | 1189 | $2,250 | $1.89 | 22d | 1 | 0.91mi |
| 2972 Kings Lake Blvd #2972 Naples, FL | 2.0 | 2.0 | 1100 | $3,000 | $2.73 | 24d | 1 | 0.91mi |
| 1950 W Crown Pointe Blvd Unit B207 Naples, FL | 2.0 | 2.0 | 1129 | $1,950 | $1.73 | 24d | 1 | 0.91mi |
| 6954 Avalon Cir #702 Naples, FL | 2.0 | 2.0 | 1467 | $4,500 | $3.07 | 24d | 1 | 0.91mi |
| 6954 Avalon Cir #707 Naples, FL | 3.0 | 2.0 | 1725 | $5,000 | $2.90 | 24d | 1 | 0.91mi |
| 6954 Avalon Cir #703 Naples, FL | 2.0 | 2.0 | 1467 | $3,000 | $2.04 | 15d | 1 | 0.91mi |
| 697 Crossfield Cir Naples, FL | 3.0 | 2.0 | 1764 | $7,500 | $4.25 | 24d | 1 | 0.93mi |
| 1835 Florida Club Cir #3201 Naples, FL | 3.0 | 2.0 | 1375 | $2,095 | $1.52 | 15d | 1 | 0.95mi |
| 5110 Brixton Ct Naples, FL | 3.0 | 2.0 | 1717 | $9,500 | $5.53 | 22d | 1 | 0.95mi |
| 443 Dundee Ct Naples, FL | 3.0 | 2.0 | 1766 | $8,000 | $4.53 | 24d | 1 | 0.96mi |
| 2050 W Crown Pointe Blvd Unit C214 Naples, FL | 3.0 | 2.0 | 1267 | $4,200 | $3.31 | 24d | 1 | 0.97mi |
| 1499 Vintage Ln Naples, FL | 3.0 | 2.0 | 1754 | $9,000 | $5.13 | 24d | 1 | 0.99mi |
HOA detail
- Monthly dues
- $162 · $1,944/yr
Listing history 3 events
-
2026-02-07status Pending
-
2026-01-21$235,000
-
2014-06-09soldstatus $95,000
ⓘ Source: listings_history table (triggers on properties + properties_extension) + one-shot
backfill from property_details.listing_events for pre-trigger history.
Tax reassessment forecast FL · Resets to sale price
- Current annual tax
- $1,012 · $84/mo
- Projected year-2 tax
- $1,950 · $163/mo
- Expected delta
- +$939/yr (+$78/mo · 92.7%)
ⓘ Screening estimate from a state-policy table — verify with the county assessor before closing.
Climate risk First Street
- Flood 5/10 Major FEMA zone X (shaded) · 48% chance over 30 yrs
- Wildfire 1/10 Low
- Heat 10/10 Extreme 7 d/yr ≥107°F today · 27 d/yr by 30 yrs out
- Wind 10/10 Extreme 99% chance of damaging wind over 30 yrs
- Air quality 2/10 Low 2 unhealthy d/yr today · 2 by 30 yrs out
Nearby sold comps map
Loading sold comps map…
Walkable amenities ~0.75 mi
Loading nearby amenities…
Taxation est. · year 1
- Rental income
- $47,451
- − Mortgage interest
- −$13,164
- − Property taxes
- −$1,012
- − Insurance
- −$1,175
- − Repairs & maintenance
- −$3,796
- − Management
- −$3,796
- − HOA
- −$1,944
- − Depreciation
- −$6,836
- Taxable income
- $15,728
- Est. tax owed @ 24.0%
- −$3,775
- After-tax cash flow
- $14,793/yr
For passive investors: Depreciation is non-cash, so a rental often shows a tax loss while cash-flowing — sheltering income. Rental losses are passive: they offset passive income freely, and up to $25,000/yr can offset ordinary (W-2) income if you actively participate and your MAGI is under $100k (phasing out to $0 by $150k); unused losses carry forward. On sale, claimed depreciation is recaptured at up to 25%, and gains may owe capital-gains tax (a 1031 exchange can defer both). Figures are a year-1 estimate at your 24.0% rate — not tax advice; consult a CPA.
Schools (NCES district)
- District
- Collier
- NCES district ID
- 1200330
- Math proficiency
- 60% ▼ -4.00%
- Reading proficiency
- 56% ▼ -2.00%
- Median HH income
- $58,275
- Composite
- 50.23/100
- National rank
- #1892
- State rank
- #16 of 73 in FL
Livability — Berkshire Lakes
No livability data for this city. (Only ~50 U.S. cities are tracked.)
Census & demographics
- County
- Collier County · 396,295 people
- Metro
- Naples-Marco Island, FL
- Population (ZIP)
- 26,408
- Household income
- $71,686
- Rent vs Own
- Severe rent burden
- 1423.0
Population outlook (Collier County) Hauer SSP2
- Today (2025)
- 420,858 people
- By 2030
- 450,054 · +6.9%
- By 2040
- 502,232 · +19.3%
- By 2050
- 544,932 · +29.5%
- By 2075
- 627,203 · +49.0%
- By 2100
- 659,015 · +56.6%
Race, ethnicity, and origin ACS 2023
- Neighborhood character
- Majority White (62%)
- Race & ethnicity
- White 62% Hispanic / Latino 30% Two or more races 19% Black 4% Asian 2%
- Hispanic origin (detail)
- Mexican 7% Puerto Rican 3% Cuban 6% Dominican 1%
- Common ancestry
- Lithuanian 6% Romanian 3% Hispanic 2%
- Foreign-born
- 30% · Canada, Jamaica, Dominican Republic
- Languages at home
- 66% English-only · Spanish 24% French/Haitian/Cajun 5% Russian/Polish/Slavic 1%
Political lean MEDSL · Collier
- 2024 margin
- Solid R (+33.1) · D 33.1% · R 66.2%
- 2008→2024 swing
- -10.6pp toward R · 2008: -22.5pp · 2024: -33.1pp
- All cycles
- 2024: R+33.1 2020: R+24.7 2016: R+26.0 2012: R+30.1 2008: R+22.5
Not yet ingested
- Civics
- —
Market trends
- HPI YoY
- ▼ -252.48%
- Current HPI
- 259.3498
- Rent YoY
- ▼ -1.10%
- Metro
- Naples-Marco Island, FL
- State GDP YoY
- ▲ 3.28%
- F500 in state
- 36
Industry mix (Fortune 500 HQ in FL)
| Industry | F500 HQs | Revenue |
|---|---|---|
| Industrial Technology | 2 | $29B |
|
||
| Insurance | 2 | $17B |
|
||
| Retail | 1 | $60B |
|
||
| Technology Distribution | 1 | $58B |
|
||
| Homebuilding | 1 | $35B |
|
||
| Technology Manufacturing | 1 | $35B |
|
||
Price history
+147.4% since first listed3 events — show timeline
- 2026-02-07 Pending — NAPLESMLS
- 2026-01-21 Listed $235,000 NAPLESMLS
- 2014-06-09 Sold (Public Records) $95,000 Public Records
Property tax history
+11.6%/yrLatest (2025): $1,012 · +6.2% YoY. Source: county tax records.
Cash-flow waterfall
monthlySold comps — $/sqft
last 12 mo · ≤1 miLoading sold comps…