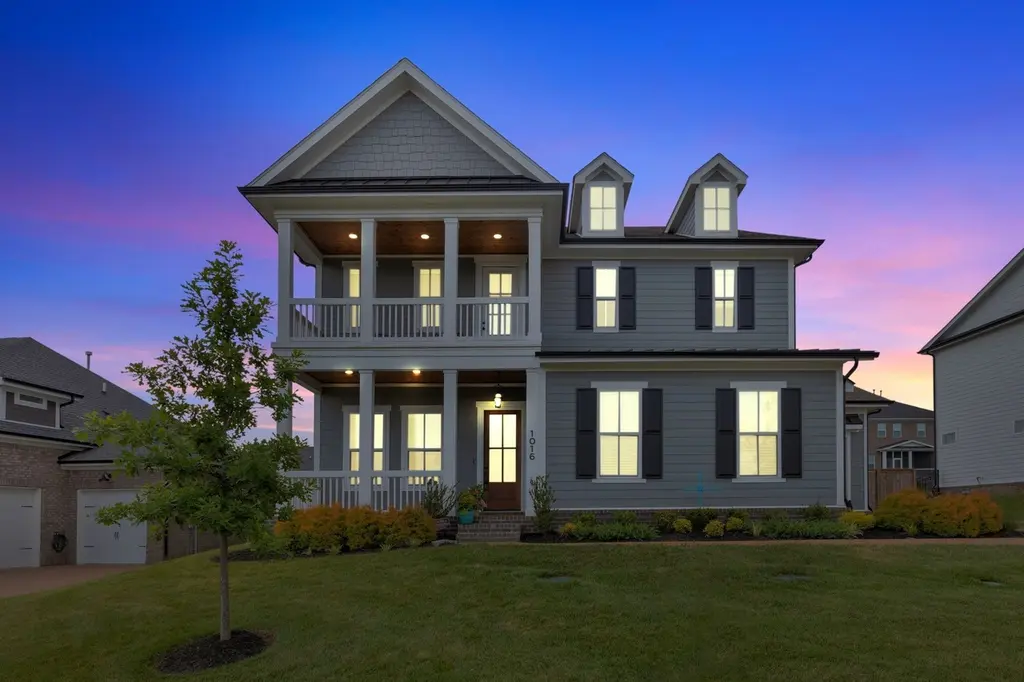
1016 Pine Creek Dr · Nolensville, TN
Flood risk No data
- FEMA flood zone
- —
- Chance of flooding over 30 yrs
- —
- Est. flood insurance / yr
- —
Fire risk No data
- Est. fire insurance / yr
- —
Heat risk No data
- Hot days now (above threshold)
- —
- Hot days in 30 yrs
- —
Wind risk No data
- Chance of severe wind over 30 yrs
- —
Air-quality risk No data
- Unhealthy air days now
- —
- Unhealthy air days in 30 yrs
- —
Risk factors via First Street. Map © Google.
Why this score? — see what drove the C grade
The composite is a weighted blend of 9 inputs, each scored 0–100. Each bar is that input's sub-score; the figure is the points it added to the 100-point composite (weight × sub-score).
- Cash flow +17.8/30.0
- Appreciation +8.3/10.0
- ARV discount +7.7/15.0
- DSCR +5.6/10.0
- Schools +5.5/10.0
- Livability +4.0/5.0
- 1% rule +3.6/10.0
- Rent growth +2.5/5.0
- Condition / age +2.5/5.0
$1,044,000
🖨 Deal sheet (PDF) 📄 Offer letter ✓ Due diligence
Listing remarks MLS
Better-than-new!! Home features an open floor plan with 10ft ceilings on the main level. Hardie board exterior & hardwood flooring throughout (except in secondary BR's). Chef’s kitchen features double stack cabinets w/crown molding, quartz countertops & island, tile backsplash, butler’s pantry, and stainless steel appliances. Primary suite is on the main level w/separate garden tub & deluxe shower in primary bath. Bonus/Flex room up & Study/Office down. $10K in Designer Window Coverings, 2 laundry rooms, quartz in all full bathrooms, shiplap & batten, designer finishes & designer lighting. Attached 3 car garage, Rainbird irrigation system, covered back patio, & upper balcony. Minutes from Arrington Vineyards with easy access to I-840 & Hwy 96.
Key facts
- 0.26 acre lot
- 3 garage spots
- Built 2022
Neighborhood map
What this means for you Summary
Snapshot
- This is a 5-bed/3.5-bath other listed at $1.04M.
Deal economics
- At list price, monthly cash flow is $856 ($10k/yr) — positive.
- The deal already cash-flows at list — no discount required.
- To meet the 1% rule (rent ≥ 1% of price), the offer needs to be $903k (13.5% below list).
- Recommended offer: $903k (13.5% below list) — sets the bar for 1% rule.
- Cap rate 7.3% vs local median 2.2% in Nolensville — top-decile yield for the area; either an underpriced asset or a hidden risk that comps aren't pricing in. Stress-test before assuming the spread holds.
Location & tenants
- Location reads 79/100 on livability (#2 in TN, #2,317 nationally) — a middle-class / working-renter tenant base. Strengths: crime A+, employment A+, housing A+; Watch: amenities D+, commute F, cost of living F.
- Williamson County (rural): math 58% / reading 59% proficiency, ranked #1 of 139 in TN (top 1%) — acceptable for families but not a draw, mixed tenant base, ~2y average lease; only 9% free/reduced lunch — higher-income household profile.
- Zoned schools: College Grove Elementary (math 72% / reading 59%, grade B+, #37 of 952 statewide, top 4%, 768 students, 0% FRL); Spring Station Middle School (math 45% / reading 44%, grade D, #30 of 333 statewide, top 9%, 828 students, 0% FRL); Summit High School (math 9% / reading 62%, grade F, #38 of 332 statewide, top 11%, 1,708 students, 0% FRL).
- Market conditions: 124 active listings in the ZIP; 2 comparable units currently listed for rent nearby; 1,994 units permitted in Williamson County in 2024 (637 in 5+ unit buildings).
Forward outlook
- In year one you build about $76k of equity ($7k loan paydown + $68k appreciation (6.5% local appreciation)).
- Williamson County population projected at +59% by 2050 — long-run rental-demand tailwind backs the buy-and-hold thesis.
- At projected returns (6.5% appreciation + 3.0% rent growth), your $292k cash investment doubles in ~4 years — after that, you're playing with house money.
- By year 2, paydown + projected appreciation supports a ~$121k cash-out refi (75% LTV) — recoverable capital for the next deal without selling this one.
Negotiation context
- It's been on market 129 days — a 12% lower offer ($919k) is reasonable based on typical stale-listing flexibility.
- 13 sale attempts since 5y ago with the ask held roughly flat each time — persistent listings suggest the price (not the market) is what's stuck; bring a comps-based counter.
Questions for the listing agent
- It's been on market 129 days. Have you received any prior offers? Is the seller open to a 14% concession, seller financing, or rate buy-down credit?
- What does the HOA fee cover, when was the last increase, and are there any pending special assessments or reserve-fund shortfalls?
- Why hasn't it sold? Are there any deal-killer items the seller is aware of (foundation, flood, title, zoning, code violations)?
- Is there a deadline driving the sale (1031 exchange, divorce, estate, relocation)? That informs how much negotiation room exists.
- Schools are A-rated — typically a magnet for longer-tenancy family renters. What's the average tenant stay here, and is there a school-zone premium baked into asking?
- What's the average days-on-market for RENTAL listings here right now (not sales)? A rising rental-DOM trend means longer vacancies and softer asking-rent achievability than the comps imply.
- What's the recent tenant-quality profile in this submarket — average credit score on applications, eviction rate, late-payment / NSF rate, and stable-employment percentage? A property-management company in the area should have these aggregated.
- How much new for-sale + rental construction is in the pipeline within 1–3 miles? Heavy new supply typically softens prices + rents 12–24 months out; constrained supply supports both.
Investment metrics
- 1% rule
- 0.86% ✗
- Cap rate
- 7.28%
- Cash-on-cash
- 3.51%
- DSCR
- 1.16
- GRM
- 9.6
CMA / ARV
- ARV (median comp)
- $1,048,065
- List price
- $1,044,000
- Delta
- -0.39%
- Verdict
- FAIR
- Comps
- 20 within 1.0 mi
Projected returns pro-forma
6.54% appreciation · 3.0% rent growth · sell at horizon
- IRR
- 19.5%
- Equity multiple
- 2.33×
- Total profit
- $389,462
- Equity at exit
- $692,440
- IRR
- 18.6%
- Equity multiple
- 4.74×
- Total profit
- $1,094,172
- Equity at exit
- $1,288,146
Cash invested: $292,320 (down + closing). Projections, not guarantees.
Landlord ↔ Tenant lean methodology
- Overall (STATE)
- 87 Strongly Landlord-Friendly
- State Tennessee
- 87 Strongly Landlord-Friendly · R+13
- County
- — inherits STATE
- City
- — inherits STATE
ZIP-level market 37014
- Home prices YoY
- 1.3%
- Active inventory
- 124
- Price-to-rent
- 9.6×
Monthly cashflow live
- Estimated rent
- $9,030 medium interval (Pro) →
- Mortgage (P&I)
- −$5,475
- Tax from tax record
- −$283 /mo · $3,397/yr
- Insurance
- −$435
- HOA
- −$85
- Vacancy / Maint / Mgmt
- −$1,896
- Net cashflow
- $856
Break-even live
Sensitivity live
| Price | -10% $1,447 | -5% $1,151 | +0% $856 | +5% $560 | +10% $265 |
|---|---|---|---|---|---|
| Rent | -10% $142 | -5% $499 | +0% $856 | +5% $1,212 | +10% $1,569 |
| Rate | -1.0pp $1,382 | -0.5pp $1,121 | base $856 | +0.5pp $585 | +1.0pp $310 |
UW: 25.0% down · 7.5% · 30yr · 1.5% tax · 5.0% vac · 8.0% maint · 8.0% mgmt
Financing live
Cash to close
- Down payment
- $261,000
- Closing costs
- $31,320
- Reserves months
- —
- Total cash needed
- —
Loan-product check · same deal, 3 products live
Conventional
25% down · 7.5% · 30yr
- Down + closing
- —
- Monthly P&I
- —
- Monthly cashflow
- —
- DSCR
- —
- Eligible?
- —
Personal DTI + credit; lowest rate.
DSCR
20% down · 8.5% · 30yr
- Down + closing
- —
- Monthly P&I
- —
- Monthly cashflow
- —
- DSCR
- —
- Eligible?
- —
No personal income docs; deal must DSCR.
Hard money
10% down · 12.0% · 12mo
- Down + closing
- —
- Monthly P&I
- —
- Monthly cashflow
- —
- DSCR
- —
- Eligible?
- —
Short-term bridge; refi at stabilization.
Rent comps 2 comps
| Address | Beds | Baths | Sqft | Rent | $/sqft | DOM | Units | Dist |
|---|---|---|---|---|---|---|---|---|
| 6605 Goshawk Ct Arrington, TN | 5.0 | 5.5 | 5835 | $11,900 | $2.04 | 19d | 1 | 1.16mi |
| 1301 Ashby Valley Ln Arrington, TN | 4.0 | 4.5 | 4282 | $6,500 | $1.52 | 25d | 1 | 1.40mi |
HOA detail
- Monthly dues
- $85 · $1,020/yr
Listing history 50 events
-
2026-06-21days on market $1,044,000 Active 129 DOM
-
2026-06-18days on market $1,044,000 Active 126 DOM
-
2026-06-17days on market $1,044,000 Active 125 DOM
-
2026-06-16days on market $1,044,000 Active 124 DOM
-
2026-06-15days on market $1,044,000 Active 123 DOM
-
2026-06-13days on market $1,044,000 Active 121 DOM
-
2026-06-13days on market $1,044,000 Active 120 DOM
-
2026-06-09days on market $1,044,000 Active 117 DOM
-
2026-06-08days on market $1,044,000 Active 116 DOM
-
2026-06-07days on market $1,044,000 Active 115 DOM
-
2026-06-02days on market $1,044,000 Active 110 DOM
-
2026-06-01days on market $1,044,000 Active 109 DOM
-
2026-05-31days on market $1,044,000 Active 108 DOM
-
2026-02-13$1,097,000 Active 798-char remark
Show marketing remark (798 chars)
Better-than-new!! Home features an open floor plan with 10ft ceilings on the main level. Hardie board exterior & hardwood flooring throughout (except in secondary BR's). Chef’s kitchen features double stack cabinets w/crown molding, quartz countertops & island, tile backsplash, butler’s pantry, and stainless steel appliances. Primary suite is on the main level w/separate garden tub & deluxe shower in primary bath. Bonus/Flex room up & Study/Office down. $10K in Designer Window Coverings, 2 laundry rooms, quartz in all full bathrooms, shiplap & batten, designer finishes & designer lighting. Attached 3 car garage, Rainbird irrigation system, covered back patio, & upper balcony. Minutes from Arrington Vineyards with easy access to I-840 & Hwy 96.
-
2026-02-06historical $1,097,000 798-char remark
Show marketing remark (798 chars)
Better-than-new!! Home features an open floor plan with 10ft ceilings on the main level. Hardie board exterior & hardwood flooring throughout (except in secondary BR's). Chef’s kitchen features double stack cabinets w/crown molding, quartz countertops & island, tile backsplash, butler’s pantry, and stainless steel appliances. Primary suite is on the main level w/separate garden tub & deluxe shower in primary bath. Bonus/Flex room up & Study/Office down. $10K in Designer Window Coverings, 2 laundry rooms, quartz in all full bathrooms, shiplap & batten, designer finishes & designer lighting. Attached 3 car garage, Rainbird irrigation system, covered back patio, & upper balcony. Minutes from Arrington Vineyards with easy access to I-840 & Hwy 96.
-
2025-12-02price $1,089,000
-
2025-12-02historical
-
2025-11-19price $1,079,000
-
2025-11-19price $1,087,000
-
2025-10-06price $1,089,000
-
2025-09-18price $1,087,000
-
2025-08-08price $1,089,000
-
2025-07-09$1,125,000 Active
-
2025-07-06historical
-
2023-12-19historical $4,900
-
2023-12-14soldstatus $965,900
-
2023-12-13soldstatus $965,900 Closed
-
2023-12-02status Pending
-
2023-11-19$4,900
-
2023-10-23price $965,900
-
2023-10-05price $995,900
-
2023-09-07$999,000 Active
-
2022-12-21soldstatus $998,600 Closed
-
2022-11-15status Pending
-
2022-10-31historical
-
2022-10-31$998,600 Active
-
2022-10-27price $997,600
-
2022-10-07price $1,007,600
-
2022-09-23price $1,037,600
-
2022-09-09price $1,038,600
-
2022-09-01price $1,039,600
-
2022-06-24$1,038,600 Active
-
2022-06-15historical
-
2022-06-13status Active
-
2022-06-03$977,000 Active
-
2022-06-02historical
-
2022-02-04historical
-
2022-02-01price $943,370
-
2022-02-01status Active
-
2022-01-27soldstatus $1,767,650
ⓘ Source: listings_history table (triggers on properties + properties_extension) + one-shot
backfill from property_details.listing_events for pre-trigger history.
Tax reassessment forecast TN · Resets to sale price
- Current annual tax
- $3,397 · $283/mo
- Projected year-2 tax
- $7,412 · $618/mo
- Expected delta
- +$4,015/yr (+$335/mo · 118.2%)
ⓘ Screening estimate from a state-policy table — verify with the county assessor before closing.
Nearby sold comps map
Loading sold comps map…
Walkable amenities ~0.75 mi
Loading nearby amenities…
Taxation est. · year 1
- Rental income
- $108,360
- − Mortgage interest
- −$58,480
- − Property taxes
- −$3,397
- − Insurance
- −$5,220
- − Repairs & maintenance
- −$8,669
- − Management
- −$8,669
- − HOA
- −$1,020
- − Depreciation
- −$30,371
- Taxable loss
- −$7,466
- Est. tax savings @ 24.0%
- +$1,792
- After-tax cash flow
- $12,061/yr
For passive investors: Depreciation is non-cash, so a rental often shows a tax loss while cash-flowing — sheltering income. Rental losses are passive: they offset passive income freely, and up to $25,000/yr can offset ordinary (W-2) income if you actively participate and your MAGI is under $100k (phasing out to $0 by $150k); unused losses carry forward. On sale, claimed depreciation is recaptured at up to 25%, and gains may owe capital-gains tax (a 1031 exchange can defer both). Figures are a year-1 estimate at your 24.0% rate — not tax advice; consult a CPA.
Schools (NCES district)
- District
- Williamson County
- NCES district ID
- 4704530
- Math proficiency
- 58% ▼ -13.00%
- Reading proficiency
- 59% ▼ -8.00%
- Median HH income
- $103,392
- Composite
- 54.94/100
- National rank
- #1307
- State rank
- #1 of 139 in TN
Livability — Nolensville
- Score
- 79/100
- State rank
- #2
- US rank
- #2317
Category grades
Schools grade is shown separately in the Schools card above.
Census & demographics
- City population
- 24,409
- Population (ZIP)
- 3,633
Population outlook (Williamson County) Hauer SSP2
- Today (2025)
- 275,925 people
- By 2030
- 308,630 · +11.9%
- By 2040
- 374,403 · +35.7%
- By 2050
- 438,644 · +59.0%
- By 2075
- 592,763 · +114.8%
- By 2100
- 691,828 · +150.7%
Race, ethnicity, and origin ACS 2023
- Neighborhood character
- Predominantly White (83%)
- Race & ethnicity
- White 83% Hispanic / Latino 6% Black 6% Two or more races 3% Asian 3%
- Hispanic origin (detail)
- Mexican 4%
- Common ancestry
- Serbian 12% Slovak 1% English 1%
- Foreign-born
- 3% · Canada
- Languages at home
- 93% English-only · Spanish 5% Other Indo-European 2%
Political lean MEDSL · Williamson
- 2024 margin
- Solid R (+32.4) · D 33.0% · R 65.4% · Other 1.7%
- 2008→2024 swing
- +7.1pp toward D · 2008: -39.5pp · 2024: -32.4pp
- All cycles
- 2024: R+32.4 2020: R+26.1 2016: R+35.5 2012: R+46.8 2008: R+39.5
Not yet ingested
- Civics
- —
Market trends
- HPI YoY
- ▲ 6.54%
- Current HPI
- 498.4505
- Rent YoY
- —
- Metro
- —
- State GDP YoY
- ▲ 2.78%
- F500 in state
- 22
Industry mix (Fortune 500 HQ in TN)
| Industry | F500 HQs | Revenue |
|---|---|---|
| Healthcare | 3 | $91B |
|
||
| Retail | 3 | $72B |
|
||
| Transportation / Logistics | 1 | $88B |
|
||
| Paper / Packaging | 1 | $19B |
|
||
| Insurance | 1 | $13B |
|
||
| Energy | 1 | $12B |
|
||
Price history
+35.1% since first listed50 events — show timeline
- 2026-02-13 Listed $1,097,000 REALTRACS as Distributed by MLS Grid
- 2026-02-06 Coming Soon $1,097,000 REALTRACS as Distributed by MLS Grid
- 2025-12-02 Listing Removed — REALTRACS as Distributed by MLS Grid
- 2025-12-02 Price Changed $1,089,000 REALTRACS as Distributed by MLS Grid
- 2025-11-19 Price Changed $1,079,000 REALTRACS as Distributed by MLS Grid
- 2025-11-19 Price Changed $1,087,000 REALTRACS as Distributed by MLS Grid
- 2025-10-06 Price Changed $1,089,000 REALTRACS as Distributed by MLS Grid
- 2025-09-18 Price Changed $1,087,000 REALTRACS as Distributed by MLS Grid
- 2025-08-08 Price Changed $1,089,000 REALTRACS as Distributed by MLS Grid
- 2025-07-09 Listed $1,125,000 REALTRACS as Distributed by MLS Grid
- 2025-07-06 Coming Soon — REALTRACS as Distributed by MLS Grid
- 2023-12-19 Rental Removed $4,900 RENT.
- 2023-12-14 Sold (Public Records) $965,900 Public Records
- 2023-12-13 Sold (MLS) $965,900 REALTRACS as Distributed by MLS Grid
- 2023-12-02 Pending — REALTRACS as Distributed by MLS Grid
- 2023-11-19 Listed for Rent $4,900 RENT.
- 2023-10-23 Price Changed $965,900 REALTRACS as Distributed by MLS Grid
- 2023-10-05 Price Changed $995,900 REALTRACS as Distributed by MLS Grid
- 2023-09-07 Listed $999,000 REALTRACS as Distributed by MLS Grid
- 2022-12-21 Sold (MLS) $998,600 REALTRACS as Distributed by MLS Grid
- 2022-11-15 Pending — REALTRACS as Distributed by MLS Grid
- 2022-10-31 Listing Removed — REALTRACS as Distributed by MLS Grid
- 2022-10-31 Listed $998,600 REALTRACS as Distributed by MLS Grid
- 2022-10-27 Price Changed $997,600 REALTRACS as Distributed by MLS Grid
- 2022-10-07 Price Changed $1,007,600 REALTRACS as Distributed by MLS Grid
- 2022-09-23 Price Changed $1,037,600 REALTRACS as Distributed by MLS Grid
- 2022-09-09 Price Changed $1,038,600 REALTRACS as Distributed by MLS Grid
- 2022-09-01 Price Changed $1,039,600 REALTRACS as Distributed by MLS Grid
- 2022-06-24 Listed $1,038,600 REALTRACS as Distributed by MLS Grid
- 2022-06-15 Listing Removed — REALTRACS as Distributed by MLS Grid
- 2022-06-13 Relisted — REALTRACS as Distributed by MLS Grid
- 2022-06-03 Listed $977,000 REALTRACS as Distributed by MLS Grid
- 2022-06-02 Coming Soon — REALTRACS as Distributed by MLS Grid
- 2022-02-04 Listing Removed — REALTRACS as Distributed by MLS Grid
- 2022-02-01 Price Changed $943,370 REALTRACS as Distributed by MLS Grid
- 2022-02-01 Relisted — REALTRACS as Distributed by MLS Grid
- 2022-01-27 Sold (Public Records) $1,767,650 Public Records
- 2022-01-08 Price Changed $918,370 REALTRACS as Distributed by MLS Grid
- 2022-01-03 Listed $913,370 REALTRACS as Distributed by MLS Grid
- 2022-01-02 Price Changed $913,370 REALTRACS as Distributed by MLS Grid
- 2021-12-27 Coming Soon — REALTRACS as Distributed by MLS Grid
- 2021-11-18 Sold (Public Records) $1,050,000 Public Records
- 2021-11-08 Price Changed $887,285 REALTRACS as Distributed by MLS Grid
- 2021-11-08 Price Changed $888,620 REALTRACS as Distributed by MLS Grid
- 2021-11-01 Relisted — REALTRACS as Distributed by MLS Grid
- 2021-10-10 Price Changed $822,135 REALTRACS as Distributed by MLS Grid
- 2021-10-10 Price Changed $881,585 REALTRACS as Distributed by MLS Grid
- 2021-10-01 Relisted — REALTRACS as Distributed by MLS Grid
- 2021-09-25 Price Changed $817,135 REALTRACS as Distributed by MLS Grid
- 2021-09-10 Listed $812,135 REALTRACS as Distributed by MLS Grid
Property tax history
+68.9%/yrLatest (2025): $3,397 · +2.8% YoY. Source: county tax records.
Cash-flow waterfall
monthlySold comps — $/sqft
last 12 mo · ≤1 miLoading sold comps…