 🏷️ Likely Rental
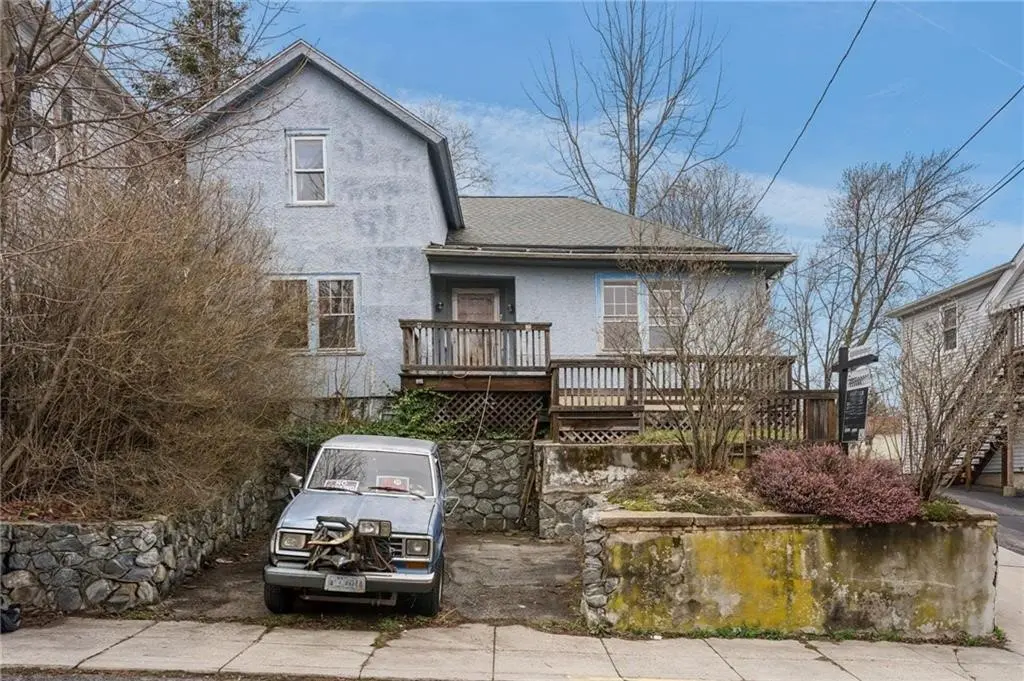
7 Shippee Ave · Warwick, RI
Flood risk 1/10 · Minimal
- FEMA flood zone
- X (unshaded)
- Chance of flooding over 30 yrs
- 0.0%
- Est. flood insurance / yr
- $473 – $860
Fire risk 1/10 · Minimal
- Est. fire insurance / yr
- $835 – $1,551
Heat risk 5/10 · Moderate
- Hot days now (above 95°F)
- 7 days/yr
- Hot days in 30 yrs
- 16 days/yr
Wind risk 6/10 · Moderate
- Chance of severe wind over 30 yrs
- 77.0%
Air-quality risk 2/10 · Minimal
- Unhealthy air days now
- 2 days/yr
- Unhealthy air days in 30 yrs
- 2 days/yr
Risk factors via First Street. Map © Google.
Why this score? — see what drove the B- grade
The composite is a weighted blend of 9 inputs, each scored 0–100. Each bar is that input's sub-score; the figure is the points it added to the 100-point composite (weight × sub-score).
- Cash flow +25.4/30.0
- ARV discount +15.0/15.0
- DSCR +8.4/10.0
- 1% rule +6.7/10.0
- Livability +3.9/5.0
- Rent growth +3.8/5.0
- Condition / age +2.5/5.0
- Schools +1.5/10.0
- Appreciation +0.0/10.0
$299,900
🖨 Deal sheet (PDF) 📄 Offer letter ✓ Due diligence
Multi-family units
County records classify this as Multi-Family (2-4 Unit). Listing-text estimate: 1 unit. estimate disagrees with records
Listing remarks
Solid house built in 1900. Exterior is mostly stucco and with a decorative wood section. First floor unit has 3 beds and an office space. Second floor unit has two beds. Both units are very spacious. There is a two- car garage in the back. The tenant is out, The first floor is in need of a rehab. Second floor unit needs cosmetics, and you could live there while rehabbing the lower unit. Hardwood floors some have apron design and should sand up beautifully. The second floor has forced hot water heat which is two years old. The first- floor steam unit works fine, oil heat, updated electrical panels, the laundry room area has a wall heater. Walk-out basement. Paved driveway. All done over this
Key facts
- 5,924 sq ft lot
- 2 garage spots
- Built 1900
Property features AI
Finance
- Financial info: Two-unit multifamily (one 2-bedroom unit, one 3-bedroom unit) with current rents listed for each unit
- HOA & community: Highway access nearby; Close to public transportation, shopping, restaurants and recreation areas; Near hospital and schools
Exterior
- Parking: Detached garage; Garage (2 covered spaces); Total parking for 6 vehicles
- Utilities: Public water with multiple meters; Sewer connected to public sewer; 100 amp electric service with circuit breakers and separate meters
- Home design: Two-story building; Above-grade finished area approximately 1,954
- Construction: Plaster exterior; Masonry construction; Wood siding; Full unfinished basement with interior and exterior entry
- Exterior features: Deck; Paved driveway; Fenced yard
Interior
- Kitchen: Water heater (building equipment listed)
- Bedrooms: One unit with 2 bedrooms; One unit with 3 bedrooms
- Flooring: Ceramic tile; Hardwood
- Bathrooms: Two full bathrooms (one in each unit)
- Heating & cooling: Forced air heating; Gas heating; Steam heating
- Interior features: Thermal windows; Interior steps; Tub with shower; Cable TV
- Laundry & utility: Common area laundry
Neighborhood map
What this means for you Summary
Snapshot
- This is a 5-bed/2.0-bath multifamily listed at $300k.
Deal economics
- At list price, monthly cash flow is $691 ($8k/yr) — positive.
- The deal already cash-flows at list — no discount required.
- Meets the 1% rule at list price ($4k rent vs $300k).
- Recommended offer: $295k (1.5% below list) — sets the bar for market timing.
- Cap rate 9.1% vs local median 3.7% in Warwick — top-decile yield for the area; either an underpriced asset or a hidden risk that comps aren't pricing in. Stress-test before assuming the spread holds.
Location & tenants
- Location reads 78/100 on livability (#6 in RI, #2,425 nationally) — a middle-class / working-renter tenant base. Strengths: crime A+, commute A+, housing A+; Watch: schools D+, amenities F.
- West Warwick (suburban): math 8% / reading 24% proficiency, ranked #30 of 39 in RI (top 77%) — low school quality limits family demand, transient renter base, plan for 1-2y turnover.
- Market conditions: Rents rising fast (+5.2%/yr); 100 active listings in the ZIP; solid renter incomes; 471 units permitted in Kent County in 2024 (240 in 5+ unit buildings).
- At $3,510/mo this rent would consume 54% of the median local household income ($78k/yr) (locally 1358% of renters already pay >50% of income on rent) — very limited rent-growth headroom before tenants either downsize or default.
Forward outlook
- Local home prices are declining (-3.0%/yr); year-one equity from $2k of loan paydown is wiped out by about $9k of value loss. Plan a longer hold.
- Kent County population projected at -14% by 2050 — secular population decline; favor cash flow + early exit over multi-decade hold.
- At projected returns (-3.0% appreciation + 5.2% rent growth), your $84k cash investment doubles in ~9 years — after that, you're playing with house money.
Negotiation context
- It's been on market 15 days — a 2% lower offer ($295k) is reasonable based on typical stale-listing flexibility.
Risks & watch-outs
- Watch-outs: built in 1900 — expect roof / HVAC / electrical / plumbing capex.
- Climate carrying-cost: major wind risk, 77% chance of damaging wind over 30y; extreme-heat days projected 7→16/yr by 2055 (HVAC capex compounding) — expect insurance premiums to compound above CPI over the hold.
Questions for the listing agent
- Built in 1900 — when were the roof, HVAC, electrical panel, plumbing, and water heater last replaced?
- Is there a deadline driving the sale (1031 exchange, divorce, estate, relocation)? That informs how much negotiation room exists.
- Schools are D-rated, which usually means shorter tenancies and higher turnover. Who's the typical renter profile here, and what's been the actual vacancy rate?
- What's the average days-on-market for RENTAL listings here right now (not sales)? A rising rental-DOM trend means longer vacancies and softer asking-rent achievability than the comps imply.
- What's the recent tenant-quality profile in this submarket — average credit score on applications, eviction rate, late-payment / NSF rate, and stable-employment percentage? A property-management company in the area should have these aggregated.
- How much new apartment / multifamily construction is in the pipeline within 1–3 miles? Heavy new supply (>2% of stock underway) typically softens rents 12–24 months out; light construction supports rent growth.
Investment metrics
- 1% rule
- 1.17% ✓
- Cap rate
- 9.06%
- Cash-on-cash
- 9.87%
- DSCR
- 1.44
- GRM
- 7.1
CMA / ARV
- ARV (on-the-fly)
- $472,868
- Comps found
- 12
Show comp detail 12 sales within ~0.75 mi
| Address | Dist | Beds/Ba | Sqft | Sold | Price | $/sf | Match |
|---|---|---|---|---|---|---|---|
| 25 27 Eddy St | 0.35mi | 5/2.0 | 2,074 (+6%) | 3mo | $535,000 | $258 | 71 |
| 122 Brookside Ave | 0.41mi | 5/3.0 | 2,000 (+2%) | 5mo | $640,000 | $320 | 69 |
| 236 Andrews Ave | 0.28mi | 6/2.0 (+1) | 1,979 (+1%) | 16mo | $479,900 | $242 | 66 |
| 34 36 Willow St | 0.40mi | 6/2.0 (+1) | 1,966 (+1%) | 16mo | $340,000 | $173 | 62 |
| 125 Read Ave | 0.37mi | 4/2.0 (-1) | 1,792 (-8%) | 4mo | $415,000 | $232 | 61 |
| 75 Winthrop Ave | 0.46mi | 4/2.0 (-1) | 1,872 (-4%) | 11mo | $385,000 | $206 | 58 |
| 1301 Main St | 0.24mi | 4/2.0 (-1) | 2,188 (+12%) | 14mo | $514,000 | $235 | 52 |
| 45 Bates Ave | 0.65mi | 4/2.0 (-1) | 1,848 (-5%) | 4mo | $465,000 | $252 | 52 |
| 93 West Warwick Ave | 0.66mi | 4/4.0 (-1) | 1,998 (+2%) | 2mo | $485,000 | $243 | 51 |
| 61 63 Bates Ave | 0.59mi | 4/2.0 (-1) | 1,824 (-7%) | 13mo | $427,000 | $234 | 46 |
| 21 Woodside Ave | 0.65mi | 5/4.0 | 2,233 (+14%) | 1mo | $580,000 | $260 | 37 |
| 1 3 Cross St | 0.72mi | 4/2.0 (-1) | 2,156 (+10%) | 9mo | $492,000 | $228 | 36 |
Match score weights: distance 35% · size 25% · config 20% · recency 20%. Top-matched comps best support the ARV.
Projected returns pro-forma
-3.0% appreciation · 5.25% rent growth · sell at horizon
- IRR
- 1.1%
- Equity multiple
- 1.04×
- Total profit
- $3,595
- Equity at exit
- $44,716
- IRR
- 12.9%
- Equity multiple
- 2.13×
- Total profit
- $94,948
- Equity at exit
- $25,930
Cash invested: $83,972 (down + closing). Projections, not guarantees.
Landlord ↔ Tenant lean methodology
- Overall (STATE)
- 31 Tenant-Leaning
- State Rhode Island
- 31 Tenant-Leaning · D+8
- County
- — inherits STATE
- City
- — inherits STATE
ZIP-level market 02893
- Rents YoY
- 5.2%
- Active inventory
- 100
- Price-to-rent
- 13.8×
Monthly cashflow live
- Estimated rent
- $3,510 high interval (Pro) →
- Mortgage (P&I)
- −$1,573
- Tax from tax record
- −$384 /mo · $4,611/yr
- Insurance
- −$125
- HOA
- −$0
- Vacancy / Maint / Mgmt
- −$737
- Net cashflow
- $691
Break-even live
Sensitivity live
| Price | -10% $861 | -5% $776 | +0% $691 | +5% $606 | +10% $521 |
|---|---|---|---|---|---|
| Rent | -10% $414 | -5% $552 | +0% $691 | +5% $830 | +10% $968 |
| Rate | -1.0pp $842 | -0.5pp $767 | base $691 | +0.5pp $613 | +1.0pp $534 |
2-unit breakdown (identical units grouped — click to expand)
| Units | Beds | Baths | Est. rent |
|---|---|---|---|
| 1× unit | 3 | 1 | $1,810 |
| 1× unit | 2 | 1 | $1,701 |
| Total (2 units) | $3,510 | ||
UW: 25.0% down · 7.5% · 30yr · 1.5% tax · 5.0% vac · 8.0% maint · 8.0% mgmt
Financing live
Cash to close
- Down payment
- $74,975
- Closing costs
- $8,997
- Reserves months
- —
- Total cash needed
- —
Loan-product check · same deal, 3 products live
Conventional
25% down · 7.5% · 30yr
- Down + closing
- —
- Monthly P&I
- —
- Monthly cashflow
- —
- DSCR
- —
- Eligible?
- —
Personal DTI + credit; lowest rate.
DSCR
20% down · 8.5% · 30yr
- Down + closing
- —
- Monthly P&I
- —
- Monthly cashflow
- —
- DSCR
- —
- Eligible?
- —
No personal income docs; deal must DSCR.
Hard money
10% down · 12.0% · 12mo
- Down + closing
- —
- Monthly P&I
- —
- Monthly cashflow
- —
- DSCR
- —
- Eligible?
- —
Short-term bridge; refi at stabilization.
Listing history 2 events
-
2026-04-16status Pending
-
2026-04-01$299,900 Active
ⓘ Source: listings_history table (triggers on properties + properties_extension) + one-shot
backfill from property_details.listing_events for pre-trigger history.
Tax reassessment forecast RI · Partial reset (capped growth)
- Current annual tax
- $4,611 · $384/mo
- Projected year-2 tax
- $4,750 · $396/mo
- Expected delta
- +$139/yr (+$12/mo · 3.0%)
ⓘ Screening estimate from a state-policy table — verify with the county assessor before closing.
Climate risk First Street
- Flood 1/10 Low FEMA zone X (unshaded) · 0% chance over 30 yrs
- Wildfire 1/10 Low
- Heat 5/10 Major 7 d/yr ≥95°F today · 16 d/yr by 30 yrs out
- Wind 6/10 Major 77% chance of damaging wind over 30 yrs
- Air quality 2/10 Low 2 unhealthy d/yr today · 2 by 30 yrs out
Nearby sold comps map
Loading sold comps map…
Walkable amenities ~0.75 mi
Loading nearby amenities…
Taxation est. · year 1
- Rental income
- $42,120
- − Mortgage interest
- −$16,799
- − Property taxes
- −$4,611
- − Insurance
- −$1,500
- − Repairs & maintenance
- −$3,370
- − Management
- −$3,370
- − Depreciation
- −$8,724
- Taxable income
- $3,747
- Est. tax owed @ 24.0%
- −$899
- After-tax cash flow
- $7,393/yr
For passive investors: Depreciation is non-cash, so a rental often shows a tax loss while cash-flowing — sheltering income. Rental losses are passive: they offset passive income freely, and up to $25,000/yr can offset ordinary (W-2) income if you actively participate and your MAGI is under $100k (phasing out to $0 by $150k); unused losses carry forward. On sale, claimed depreciation is recaptured at up to 25%, and gains may owe capital-gains tax (a 1031 exchange can defer both). Figures are a year-1 estimate at your 24.0% rate — not tax advice; consult a CPA.
Schools (NCES district)
- District
- West Warwick
- NCES district ID
- 4401140
- Math proficiency
- 8% ▼ -10.00%
- Reading proficiency
- 24% ▼ -3.00%
- Median HH income
- $50,176
- Composite
- 14.55/100
- National rank
- #9418
- State rank
- #30 of 39 in RI
Livability — Warwick
- Score
- 78/100
- State rank
- #6
- US rank
- #2425
Category grades
Schools grade is shown separately in the Schools card above.
Census & demographics
- County
- Kent County · 90,904 people
- City population
- 108,434
- Metro
- Providence-Warwick, RI-MA
- Population (ZIP)
- 31,173
- Household income
- $77,608
- Rent vs Own
- Severe rent burden
- 1358.0
Population outlook (Kent County) Hauer SSP2
- Today (2025)
- 160,994 people
- By 2030
- 157,428 · -2.2%
- By 2040
- 148,389 · -7.8%
- By 2050
- 137,995 · -14.3%
- By 2075
- 118,536 · -26.4%
- By 2100
- 102,266 · -36.5%
Race, ethnicity, and origin ACS 2023
- Neighborhood character
- Predominantly White (81%)
- Race & ethnicity
- White 81% Hispanic / Latino 11% Two or more races 7% Asian 2% Black 1%
- Hispanic origin (detail)
- Mexican 1% Puerto Rican 4% Dominican 3%
- Common ancestry
- Lithuanian 12% Russian 11% Romanian 5%
- Foreign-born
- 8% · Canada
- Languages at home
- 88% English-only · Spanish 7% Other Indo-European 4% Other Asian/Pacific 1%
Political lean MEDSL · Kent
- 2024 margin
- Toss-up / Even · D 49.9% · R 48.1% · Other 2.0%
- 2008→2024 swing
- -15.6pp toward R · 2008: 17.5pp · 2024: 1.9pp
- All cycles
- 2024: D+1.9 2020: D+7.6 2016: R+0.7 2012: D+18.4 2008: D+17.5
Not yet ingested
- Civics
- —
Market trends
- HPI YoY
- ▼ -358.77%
- Current HPI
- 355.5243
- Rent YoY
- ▲ 5.25%
- Metro
- Providence-Warwick, RI-MA
- State GDP YoY
- ▲ 2.25%
- F500 in state
- 10
Industry mix (Fortune 500 HQ in RI)
| Industry | F500 HQs | Revenue |
|---|---|---|
| Healthcare | 1 | $373B |
|
||
| Food Distribution | 1 | $31B |
|
||
| Aerospace / Defense | 1 | $14B |
|
||
| Financial Services | 1 | $8B |
|
||
| Consumer Goods | 1 | $4B |
|
||
Price history
2 events — show timeline
- 2026-04-16 Pending — RIS
- 2026-04-01 Listed $299,900 RIS
Property tax history
+4.2%/yrLatest (2025): $4,611 · +13.5% YoY. Source: county tax records.
Cash-flow waterfall
monthlySold comps — $/sqft
last 12 mo · ≤1 miLoading sold comps…