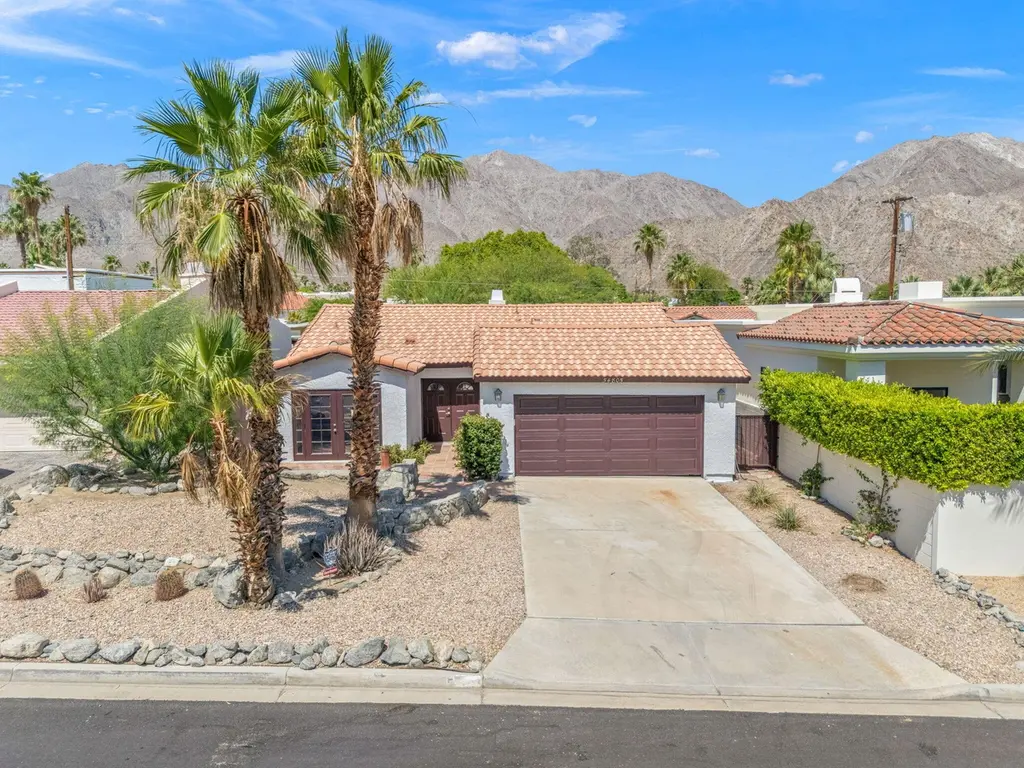
54805 Avenida Carranza · La Quinta, CA
Flood risk 1/10 · Minimal
- FEMA flood zone
- X
- Chance of flooding over 30 yrs
- 0.0%
- Est. flood insurance / yr
- $507 – $1,088
Fire risk 5/10 · Moderate
- Est. fire insurance / yr
- $659 – $1,223
Heat risk 9/10 · Severe
- Hot days now (above 113°F)
- 8 days/yr
- Hot days in 30 yrs
- 22 days/yr
Wind risk 1/10 · Minimal
- Chance of severe wind over 30 yrs
- —
Air-quality risk 4/10 · Minor
- Unhealthy air days now
- 4 days/yr
- Unhealthy air days in 30 yrs
- 5 days/yr
Risk factors via First Street. Map © Google.
Why this score? — see what drove the B grade
The composite is a weighted blend of 9 inputs, each scored 0–100. Each bar is that input's sub-score; the figure is the points it added to the 100-point composite (weight × sub-score).
- Cash flow +28.5/30.0
- ARV discount +15.0/15.0
- DSCR +10.0/10.0
- 1% rule +7.0/10.0
- Rent growth +4.1/5.0
- Schools +3.8/10.0
- Livability +2.9/5.0
- Condition / age +2.5/5.0
- Appreciation +0.0/10.0
$390,000
🖨 Deal sheet (PDF) 📄 Offer letter ✓ Due diligence
Listing remarks
Perched on the top block of the La Quinta Cove, this home presents a rare opportunity for investors or buyers ready to bring a vision to life. This 1812 sq ft home offers 3 bedrooms, 3 bathrooms, and a spacious great room layout with endless potential to re-imagine and modernize. Set in a quiet, elevated location, the property captures the true essence of desert living--peaceful surroundings, minimal traffic, and breathtaking night skies filled with stars. Just moments from scenic hiking trails, it's an ideal setting for those seeking both tranquility and outdoor adventure. The home features a 2-car garage and a generous interior footprint, providing a strong foundation for a custom remodel
Key facts
- Great room layout
- Custom remodel
- 4,792 sq ft lot
Tags
Property features AI
Finance
- Other: Rental restrictions apply; Owner has real estate license; Sale terms: cash; possession at close of escrow; will consider lease; not available for short-term rentals
- HOA & community: No monthly association fees
Exterior
- Parking: Attached garage (2 spaces); Driveway with direct entrance (total 2 parking spaces)
- Security: No security/safety features listed
- Utilities: Water: in street; Sewer: connected and paid; PUD: no
- Home design: Detached single-family home; One story; Front door faces east and west; Property listed as fixer/needs cosmetic repair
- Construction: Stucco exterior; Tile roof; Slab foundation; Year built (assessor)
- Exterior features: Patio (other); Brick and wood fencing; Sprinkler and drip irrigation systems; Mountain view
Interior
- Kitchen: Granite counters
- Flooring: Laminate flooring; Tile flooring
- Bathrooms: Two full bathrooms; One 3/4 bathroom
- Heating & cooling: Forced air heating (electric); Central air conditioning; Ceiling fans
- Interior features: Main level entry; Double-door entry; Unfurnished; Wood-burning fireplace in family room; Breakfast room; Family room
- Laundry & utility: Laundry in a dedicated room
Neighborhood map
What this means for you Summary
Snapshot
- This is a 3-bed/2.0-bath single-family listed at $390k.
Deal economics
- At list price, monthly cash flow is $1k ($15k/yr) — positive.
- The deal already cash-flows at list — no discount required.
- Meets the 1% rule at list price ($5k rent vs $390k).
- Recommended offer: $384k (1.5% below list) — sets the bar for market timing.
- Cap rate 10.2% vs local median 3.3% in La Quinta — top-decile yield for the area; either an underpriced asset or a hidden risk that comps aren't pricing in. Stress-test before assuming the spread holds.
Location & tenants
- Location reads 58/100 on livability (#694 in CA) — a working-class tenant base; expect higher turnover. Strengths: commute A-, employment B+, housing B+; Watch: amenities F, cost of living F, health & safety F.
- Desert Sands Unified (suburban): math 31% / reading 56% proficiency, ranked #199 of 517 in CA (top 38%) — families likely to look elsewhere, expect single-tenant / working-renter base with shorter leases.
- Zoned schools: Benjamin Franklin Elementary (619 students, 78% FRL); La Quinta Middle (math 24% / reading 24%, grade F, #277 of 498 statewide, top 73%, 754 students, 83% FRL); La Quinta High (math 31% / reading 65%, grade D, #380 of 1,170 statewide, top 33%, 2,500 students, 74% FRL) — zoned schools average 78% FRL vs 56% district-wide (22 pts higher); higher-poverty schools than district average — tighter screening recommended.
- Market conditions: Rents rising fast (+6.5%/yr); 660 active listings in the ZIP; 40 comparable units currently listed for rent nearby; rentals lingering (median 45d on market — plan ~5-8 weeks vacancy on turnover, expect pricing pressure); 65% of comp listings sitting > 30 days — soft ceiling on asking rent; solid renter incomes; 9,195 units permitted in Riverside County in 2024 (1,512 in 5+ unit buildings).
- At $4,673/mo this rent would consume 56% of the median local household income ($99k/yr) (locally 1078% of renters already pay >50% of income on rent) — very limited rent-growth headroom before tenants either downsize or default.
Forward outlook
- Local home prices are declining (-3.0%/yr); year-one equity from $3k of loan paydown is wiped out by about $12k of value loss. Plan a longer hold.
- Riverside County population projected at +22% by 2050 — long-run rental-demand tailwind backs the buy-and-hold thesis.
- At projected returns (-3.0% appreciation + 6.5% rent growth), your $109k cash investment doubles in ~7 years — after that, you're playing with house money.
Negotiation context
- It's been on market 16 days — a 2% lower offer ($384k) is reasonable based on typical stale-listing flexibility.
- Current owner paid $85k; list at $390k implies a 359% gain — meaningful room to come down on a strong offer.
Risks & watch-outs
- Climate carrying-cost: moderate wildfire risk; extreme-heat days projected 8→22/yr by 2055 (HVAC capex compounding) — expect insurance premiums to compound above CPI over the hold.
Questions for the listing agent
- Is there a deadline driving the sale (1031 exchange, divorce, estate, relocation)? That informs how much negotiation room exists.
- Schools are D-rated, which usually means shorter tenancies and higher turnover. Who's the typical renter profile here, and what's been the actual vacancy rate?
- What's the average days-on-market for RENTAL listings here right now (not sales)? A rising rental-DOM trend means longer vacancies and softer asking-rent achievability than the comps imply.
- What's the recent tenant-quality profile in this submarket — average credit score on applications, eviction rate, late-payment / NSF rate, and stable-employment percentage? A property-management company in the area should have these aggregated.
- How much new for-sale + rental construction is in the pipeline within 1–3 miles? Heavy new supply typically softens prices + rents 12–24 months out; constrained supply supports both.
Investment metrics
- 1% rule
- 1.20% ✓
- Cap rate
- 10.22%
- Cash-on-cash
- 14.03%
- DSCR
- 1.62
- GRM
- 7.0
CMA / ARV
- ARV (on-the-fly)
- $661,380
- Comps found
- 12
Show comp detail 12 sales within ~0.75 mi
| Address | Dist | Beds/Ba | Sqft | Sold | Price | $/sf | Match |
|---|---|---|---|---|---|---|---|
| 54805 Avenida Carranza | 0.00mi | 3/3.0 | 1,812 (0%) | 0mo | $420,000 | $232 | 96 |
| 54680 Avenida Carranza | 0.08mi | 3/2.0 | 1,898 (+5%) | 4mo | $619,000 | $326 | 85 |
| 54510 Avenida Alvarado | 0.16mi | 3/2.0 | 1,763 (-3%) | 4mo | $715,000 | $406 | 85 |
| 54040 Avenida Diaz | 0.40mi | 3/3.0 | 1,870 (+3%) | 4mo | $767,500 | $410 | 69 |
| 53520 Avenida Ramirez | 0.64mi | 3/2.0 | 1,835 (+1%) | 3mo | $670,000 | $365 | 65 |
| 54065 Avenida Vallejo | 0.39mi | 3/2.5 | 1,647 (-9%) | 1mo | $589,000 | $358 | 64 |
| 54060 Avenida Madero | 0.46mi | 4/3.5 (+1) | 1,870 (+3%) | 2mo | $787,000 | $421 | 61 |
| 53600 Avenida Diaz | 0.64mi | 3/2.0 | 1,704 (-6%) | 2mo | $567,500 | $333 | 59 |
| 54105 Avenida Obregon | 0.35mi | 3/2.0 | 1,583 (-13%) | 4mo | $499,900 | $316 | 59 |
| 54175 Avenida Madero | 0.44mi | 3/2.0 | 1,586 (-12%) | 3mo | $633,500 | $399 | 56 |
| 53840 Avenida Carranza | 0.47mi | 4/3.0 (+1) | 2,000 (+10%) | 0mo | $659,000 | $330 | 51 |
| 53770 Avenida Obregon | 0.50mi | 4/3.0 (+1) | 1,622 (-10%) | 1mo | $640,000 | $395 | 50 |
Match score weights: distance 35% · size 25% · config 20% · recency 20%. Top-matched comps best support the ARV.
Projected returns pro-forma
-3.0% appreciation · 6.45% rent growth · sell at horizon
- IRR
- 7.8%
- Equity multiple
- 1.32×
- Total profit
- $34,776
- Equity at exit
- $58,150
- IRR
- 19.7%
- Equity multiple
- 2.91×
- Total profit
- $208,476
- Equity at exit
- $33,720
Cash invested: $109,200 (down + closing). Projections, not guarantees.
Landlord ↔ Tenant lean methodology
- Overall (STATE)
- 18 Strongly Tenant-Friendly
- State California
- 18 Strongly Tenant-Friendly · D+13
- County
- — inherits STATE
- City
- — inherits STATE
ZIP-level market 92253
- Rents YoY
- 6.5%
- Active inventory
- 660
- Price-to-rent
- 7.0×
Monthly cashflow live
- Estimated rent
- $4,673 high interval (Pro) →
- Mortgage (P&I)
- −$2,045
- Tax from tax record
- −$207 /mo · $2,488/yr
- Insurance
- −$162
- HOA
- −$0
- Vacancy / Maint / Mgmt
- −$981
- Net cashflow
- $1,276
Break-even live
Sensitivity live
| Price | -10% $1,497 | -5% $1,387 | +0% $1,276 | +5% $1,166 | +10% $1,056 |
|---|---|---|---|---|---|
| Rent | -10% $907 | -5% $1,092 | +0% $1,276 | +5% $1,461 | +10% $1,646 |
| Rate | -1.0pp $1,473 | -0.5pp $1,376 | base $1,276 | +0.5pp $1,175 | +1.0pp $1,073 |
UW: 25.0% down · 7.5% · 30yr · 1.5% tax · 5.0% vac · 8.0% maint · 8.0% mgmt
Financing live
Cash to close
- Down payment
- $97,500
- Closing costs
- $11,700
- Reserves months
- —
- Total cash needed
- —
Loan-product check · same deal, 3 products live
Conventional
25% down · 7.5% · 30yr
- Down + closing
- —
- Monthly P&I
- —
- Monthly cashflow
- —
- DSCR
- —
- Eligible?
- —
Personal DTI + credit; lowest rate.
DSCR
20% down · 8.5% · 30yr
- Down + closing
- —
- Monthly P&I
- —
- Monthly cashflow
- —
- DSCR
- —
- Eligible?
- —
No personal income docs; deal must DSCR.
Hard money
10% down · 12.0% · 12mo
- Down + closing
- —
- Monthly P&I
- —
- Monthly cashflow
- —
- DSCR
- —
- Eligible?
- —
Short-term bridge; refi at stabilization.
Rent comps 40 comps
| Address | Beds | Baths | Sqft | Rent | $/sqft | DOM | Units | Dist |
|---|---|---|---|---|---|---|---|---|
| 54925 Avenida Ramirez La Quinta, CA | 3.0 | 3.0 | 1814 | $5,000 | $2.76 | 45d | 1 | 0.08mi |
| 54965 Avenida Vallejo La Quinta, CA | 3.0 | 3.0 | 1918 | $7,500 | $3.91 | 45d | 1 | 0.13mi |
| 54820 Avenida Vallejo La Quinta, CA | 4.0 | 2.0 | 1612 | $6,500 | $4.03 | 45d | 1 | 0.15mi |
| 54560 Avenida Carranza La Quinta, CA | 3.0 | 2.0 | 1517 | $2,625 | $1.73 | 20d | 1 | 0.16mi |
| 54665 Avenida Rubio La Quinta, CA | 3.0 | 2.0 | 1426 | $2,750 | $1.93 | 45d | 1 | 0.16mi |
| 54605 Avenida Vallejo La Quinta, CA | 3.0 | 2.0 | 1771 | $6,500 | $3.67 | 45d | 1 | 0.17mi |
| 54605 Avenida Vallejo La Quinta, CA | 3.0 | 2.0 | 1771 | $6,500 | $3.67 | 6d | 1 | 0.17mi |
| 54865 Avenida Diaz La Quinta, CA | 3.0 | 2.0 | 1434 | $3,000 | $2.09 | 6d | 1 | 0.18mi |
| 54905 Avenida Diaz La Quinta, CA | 3.0 | 2.0 | 1394 | $3,900 | $2.80 | 45d | 1 | 0.18mi |
| 54270 Avenida Alvarado La Quinta, CA | 2.0 | 2.0 | 1454 | $5,000 | $3.44 | 45d | 1 | 0.29mi |
| 54277 Avenida Diaz La Quinta, CA | 3.0 | 2.0 | 1861 | $3,500 | $1.88 | 45d | 1 | 0.33mi |
| 77755 Calle Temecula La Quinta, CA | 3.0 | 2.0 | 2304 | $5,000 | $2.17 | 45d | 1 | 0.34mi |
| 54200 Avenida Cortez La Quinta, CA | 3.0 | 2.0 | 1857 | $6,000 | $3.23 | 45d | 1 | 0.43mi |
| 54190 Avenida Cortez La Quinta, CA | 3.0 | 2.5 | 1992 | $4,200 | $2.11 | 26d | 1 | 0.44mi |
| 54195 Avenida Martinez La Quinta, CA | 3.0 | 2.0 | 1714 | $3,150 | $1.84 | 45d | 1 | 0.47mi |
| 53875 Avenida Rubio La Quinta, CA | 3.0 | 2.5 | 1962 | $6,000 | $3.06 | 45d | 1 | 0.49mi |
| 53860 Avenida Ramirez La Quinta, CA | 4.0 | 5.0 | 1779 | $5,500 | $3.09 | 45d | 1 | 0.49mi |
| 54052 Avenida Martinez La Quinta, CA | 3.0 | 2.0 | 1849 | $3,600 | $1.95 | 6d | 1 | 0.53mi |
| 53755 Avenida Diaz La Quinta, CA | 3.0 | 2.0 | 1325 | $3,085 | $2.33 | 26d | 1 | 0.57mi |
| 53980 Avenida Mendoza La Quinta, CA | 3.0 | 2.0 | 1650 | $4,800 | $2.91 | 45d | 1 | 0.59mi |
| 53980 Avenida Mendoza La Quinta, CA | 3.0 | 2.0 | 1404 | $3,500 | $2.49 | 1d | 1 | 0.59mi |
| 53665 Avenida Vallejo La Quinta, CA | 3.0 | 2.0 | 1248 | $2,600 | $2.08 | 26d | 1 | 0.60mi |
| 53655 Avenida Ramirez La Quinta, CA | 3.0 | 2.0 | 1378 | $3,500 | $2.54 | 45d | 1 | 0.60mi |
| 53805 Avenida Martinez La Quinta, CA | 3.0 | 2.0 | 1412 | $2,495 | $1.77 | 6d | 1 | 0.61mi |
| 53805 Avenida Martinez La Quinta, CA | 3.0 | 2.0 | 1412 | $2,495 | $1.77 | 23d | 1 | 0.61mi |
| 53720 Avenida Madero La Quinta, CA | 3.0 | 2.5 | 1725 | $9,000 | $5.22 | 45d | 1 | 0.62mi |
| 53445 Eisenhower Dr La Quinta, CA | 3.0 | 2.0 | 1797 | $3,900 | $2.17 | 45d | 1 | 0.74mi |
| 53740 Avenida Navarro La Quinta, CA | 3.0 | 3.0 | 1664 | $3,350 | $2.01 | 26d | 1 | 0.75mi |
| 53420 Avenida Velasco La Quinta, CA | 3.0 | 2.0 | 1532 | $4,000 | $2.61 | 45d | 1 | 0.76mi |
| 53360 Avenida Juarez La Quinta, CA | 3.0 | 2.0 | 1621 | $2,900 | $1.79 | 6d | 1 | 0.77mi |
| 53385 Avenida Mendoza La Quinta, CA | 3.0 | 2.5 | 1942 | $3,900 | $2.01 | 45d | 1 | 0.82mi |
| 53440 Avenida Villa La Quinta, CA | 3.0 | 2.0 | 2045 | $3,500 | $1.71 | 45d | 1 | 0.83mi |
| 53170 Avenida Diaz La Quinta, CA | 3.0 | 2.0 | 1724 | $3,500 | $2.03 | 3d | 1 | 0.84mi |
| 53167 Avenida Diaz La Quinta, CA | 3.0 | 2.0 | 1920 | $6,000 | $3.12 | 45d | 1 | 0.86mi |
| 53390 Avenida Navarro La Quinta, CA | 3.0 | 2.0 | 1701 | $4,500 | $2.65 | 6d | 1 | 0.88mi |
| 53390 Avenida Navarro La Quinta, CA | 3.0 | 2.0 | 1701 | $4,500 | $2.65 | 45d | 1 | 0.88mi |
| 52955 Avenida Obregon La Quinta, CA | 4.0 | 2.5 | 1883 | $3,600 | $1.91 | 45d | 1 | 0.96mi |
| 53220 Avenida Navarro La Quinta, CA | 3.0 | 2.0 | 1808 | $5,250 | $2.90 | 45d | 1 | 0.96mi |
| 52680 Avenida Juarez La Quinta, CA | 3.0 | 2.0 | 1440 | $3,500 | $2.43 | 45d | 1 | 1.11mi |
| 52637 Avenida Villa La Quinta, CA | 4.0 | 2.0 | 1410 | $6,000 | $4.26 | 45d | 1 | 1.18mi |
Listing history 12 events
-
2026-06-13statusdays on market $390,000 Pending 16 DOM
-
2026-06-09days on market $390,000 Active Under Contract 13 DOM
-
2026-06-08days on market $390,000 Active Under Contract 12 DOM
-
2026-06-07statusdays on market $390,000 Active Under Contract 11 DOM
-
2026-06-04days on market $390,000 Active 8 DOM
-
2026-06-03days on market $390,000 Active 7 DOM
-
2026-06-01days on market $390,000 Active 6 DOM
-
2026-05-31days on market $390,000 Active 5 DOM
-
2026-05-26$390,000 Active
-
1994-05-26soldstatus $85,000
-
1990-07-31soldstatus $119,500
-
1989-05-10soldstatus $13,000
ⓘ Source: listings_history table (triggers on properties + properties_extension) + one-shot
backfill from property_details.listing_events for pre-trigger history.
Tax reassessment forecast CA · Resets to sale price
- Current annual tax
- $2,488 · $207/mo
- Projected year-2 tax
- $2,964 · $247/mo
- Expected delta
- +$476/yr (+$40/mo · 19.1%)
ⓘ Screening estimate from a state-policy table — verify with the county assessor before closing.
Climate risk First Street
- Flood 1/10 Low FEMA zone X · 0% chance over 30 yrs
- Wildfire 5/10 Major
- Heat 9/10 Extreme 8 d/yr ≥113°F today · 22 d/yr by 30 yrs out
- Wind 1/10 Low
- Air quality 4/10 Moderate 4 unhealthy d/yr today · 5 by 30 yrs out
Nearby sold comps map
Loading sold comps map…
Walkable amenities ~0.75 mi
Loading nearby amenities…
Taxation est. · year 1
- Rental income
- $56,072
- − Mortgage interest
- −$21,846
- − Property taxes
- −$2,488
- − Insurance
- −$1,950
- − Repairs & maintenance
- −$4,486
- − Management
- −$4,486
- − Depreciation
- −$11,345
- Taxable income
- $9,471
- Est. tax owed @ 24.0%
- −$2,273
- After-tax cash flow
- $13,044/yr
For passive investors: Depreciation is non-cash, so a rental often shows a tax loss while cash-flowing — sheltering income. Rental losses are passive: they offset passive income freely, and up to $25,000/yr can offset ordinary (W-2) income if you actively participate and your MAGI is under $100k (phasing out to $0 by $150k); unused losses carry forward. On sale, claimed depreciation is recaptured at up to 25%, and gains may owe capital-gains tax (a 1031 exchange can defer both). Figures are a year-1 estimate at your 24.0% rate — not tax advice; consult a CPA.
Schools (NCES district)
- District
- Desert Sands Unified
- NCES district ID
- 0611110
- Math proficiency
- 31% ▼ -4.00%
- Reading proficiency
- 56% ▲ 7.00%
- Median HH income
- $54,957
- Composite
- 37.77/100
- National rank
- #4346
- State rank
- #199 of 517 in CA
Livability — La Quinta
- Score
- 58/100
- State rank
- #694
- US rank
- #21080
Category grades
Schools grade is shown separately in the Schools card above.
Census & demographics
- Census place
- La Quinta, CA
- County
- Riverside County · 2,287,001 people
- City population
- 38,666
- Metro
- Riverside-San Bernardino-Ontario, CA
- Population (ZIP)
- 38,666
- Household income
- $99,277
- Rent vs Own
- Severe rent burden
- 1078.0
Population outlook (Riverside County) Hauer SSP2
- Today (2025)
- 2,664,475 people
- By 2030
- 2,802,692 · +5.2%
- By 2040
- 3,050,904 · +14.5%
- By 2050
- 3,256,783 · +22.2%
- By 2075
- 3,655,058 · +37.2%
- By 2100
- 3,766,594 · +41.4%
Race, ethnicity, and origin ACS 2023
- Neighborhood character
- Diverse neighborhood (Simpson 0.57)
- Race & ethnicity
- White 54% Hispanic / Latino 37% Two or more races 19% Asian 4% Native American 1% Black 1%
- Hispanic origin (detail)
- Mexican 34%
- Common ancestry
- Romanian 2% Lithuanian 2% Slovak 1%
- Foreign-born
- 15% · Canada, China, Vietnam
- Languages at home
- 71% English-only · Spanish 24% Tagalog/Filipino 1% Chinese 1%
Political lean MEDSL · Riverside
- 2024 margin
- Toss-up / Even · D 48.0% · R 49.3% · Other 2.6%
- 2008→2024 swing
- -3.6pp toward R · 2008: 2.3pp · 2024: -1.3pp
- All cycles
- 2024: R+1.3 2020: D+8.0 2016: D+4.3 2012: R+0.4 2008: D+2.3
Not yet ingested
- Civics
- —
Market trends
- HPI YoY
- ▼ -263.65%
- Current HPI
- 281.8665
- Rent YoY
- ▲ 6.45%
- Metro
- Riverside-San Bernardino-Ontario, CA
- State GDP YoY
- ▲ 3.21%
- F500 in state
- 116
Industry mix (Fortune 500 HQ in CA)
| Industry | F500 HQs | Revenue |
|---|---|---|
| Technology | 27 | $1,492B |
|
||
| Financial Services | 3 | $174B |
|
||
| Retail | 3 | $44B |
|
||
| Insurance | 3 | $26B |
|
||
| Media / Entertainment | 2 | $115B |
|
||
| Pharmaceuticals / Biotech | 2 | $62B |
|
||
Price history
+2900.0% since first listed4 events — show timeline
- 2026-05-26 Listed $390,000 GPSMLS
- 1994-05-26 Sold (Public Records) $85,000 Public Records
- 1990-07-31 Sold (Public Records) $119,500 Public Records
- 1989-05-10 Sold (Public Records) $13,000 Public Records
Property tax history
+2.2%/yrLatest (2025): $2,488 · +3.5% YoY. Source: county tax records.
Cash-flow waterfall
monthlySold comps — $/sqft
last 12 mo · ≤1 miLoading sold comps…