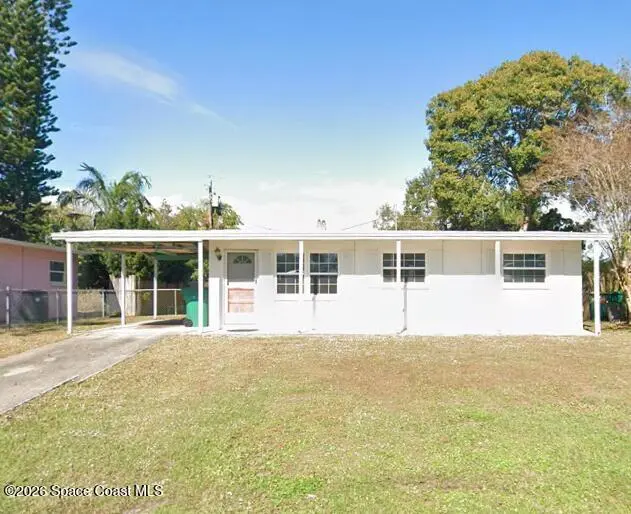
2204 Shelby Dr · Melbourne, FL
Flood risk 1/10 · Minimal
- FEMA flood zone
- X (unshaded)
- Chance of flooding over 30 yrs
- 0.0%
- Est. flood insurance / yr
- $507 – $1,088
Fire risk 2/10 · Minimal
- Est. fire insurance / yr
- $947 – $1,759
Heat risk 10/10 · Severe
- Hot days now (above 105°F)
- 7 days/yr
- Hot days in 30 yrs
- 24 days/yr
Wind risk 10/10 · Severe
- Chance of severe wind over 30 yrs
- 99.0%
Air-quality risk 1/10 · Minimal
- Unhealthy air days now
- 0 days/yr
- Unhealthy air days in 30 yrs
- 0 days/yr
Risk factors via First Street. Map © Google.
Why this score? — see what drove the C- grade
The composite is a weighted blend of 9 inputs, each scored 0–100. Each bar is that input's sub-score; the figure is the points it added to the 100-point composite (weight × sub-score).
- Cash flow +19.6/30.0
- ARV discount +7.5/15.0
- DSCR +6.2/10.0
- 1% rule +5.5/10.0
- Schools +4.7/10.0
- Rent growth +2.6/5.0
- Livability +2.5/5.0
- Condition / age +2.5/5.0
- Appreciation +0.0/10.0
$160,000
🖨 Deal sheet 📄 Offer letter ✓ Due diligence
Listing remarks
3-bedroom, 1-bath concrete block home in the Eau Gallie area of Melbourne. Long-term tenant-occupied property ready for updates and renovation. Roof replaced June 2022 and A/C replaced in 2020. Fenced yard. Built in 1960. Opportunity for investor, starter home, or downsizing buyer looking to customize. Centrally located with convenient access to shopping, dining, and major roadways.
Key facts
- 6,534 sq ft lot
- Parking
- Built 1960
Property features AI
Exterior
- Parking: Attached carport (1 carport space)
- Utilities: Public sewer; Cable available; Electricity connected; Sewer connected; Water connected
- Home design: Single-family residence; One story; Faces south
- Construction: Concrete and stucco construction; Shingle roof
- Exterior features: Back yard fence
Interior
- Kitchen: Electric range; Refrigerator
- Bedrooms: 3 bedrooms
- Flooring: Carpet; Laminate
- Bathrooms: 1 full bathroom
- Heating & cooling: Central heating; Central air
- Interior features: Central heating; Central air; Cable available; Electricity connected; Sewer connected; Water connected
- Laundry & utility: Unfurnished (no included washer/dryer listed)
Neighborhood map
What this means for you Summary
Snapshot
- This is a 3-bed/2.0-bath single-family listed at $160k.
Deal economics
- At list price, monthly cash flow is $185 ($2k/yr) — positive.
- The deal already cash-flows at list — no discount required.
- Meets the 1% rule at list price ($2k rent vs $160k).
- Recommended offer: $158k (1.5% below list) — sets the bar for market timing.
Location & tenants
- Location reads: area grade C — affects rentability + tenant quality, not the cash-flow math above.
- Brevard (suburban): math 53% / reading 57% proficiency, ranked #19 of 73 in FL (top 26%) — acceptable for families but not a draw, mixed tenant base, ~2y average lease.
- Zoned schools: Croton Elementary School (math 59% / reading 54%, grade C+, #816 of 2,144 statewide, top 39%, 488 students, 64% FRL); Lyndon B. Johnson Middle School (math 40% / reading 42%, grade F, #353 of 571 statewide, top 63%, 610 students, 61% FRL) — zoned schools average 63% FRL vs 43% district-wide (20 pts higher); higher-poverty schools than district average — tighter screening recommended.
- Market conditions: Rents flat; 332 active listings in the ZIP; 28 comparable units currently listed for rent nearby; rentals at typical pace (median 24d on market — plan ~3-4 weeks tenant-placement turnaround); 4,602 units permitted in Brevard County in 2024 (702 in 5+ unit buildings).
- This rent runs 31% of the median local income ($65k/yr) — at the standard rent-burdened threshold; future hikes will face affordability resistance.
Forward outlook
- Local home prices are declining (-3.0%/yr); year-one equity from $1k of loan paydown is wiped out by about $5k of value loss. Plan a longer hold.
- Brevard County population projected at +15% by 2050 — modest demand growth; plan on rents tracking national, not racing it.
Negotiation context
- It's been on market 21 days — a 2% lower offer ($158k) is reasonable based on typical stale-listing flexibility.
- 2 sale attempts with the ask held roughly flat each time — persistent listings suggest the price (not the market) is what's stuck; bring a comps-based counter.
- Current owner paid $43k; list at $160k implies a 272% gain — meaningful room to come down on a strong offer.
Risks & watch-outs
- Climate carrying-cost: severe wind risk, 99% chance of damaging wind over 30y; extreme-heat days projected 7→24/yr by 2055 (HVAC capex compounding) — expect insurance premiums to compound above CPI over the hold.
Questions for the listing agent
- Built in 1960 — when were the roof, HVAC, electrical panel, plumbing, and water heater last replaced?
- Is there a deadline driving the sale (1031 exchange, divorce, estate, relocation)? That informs how much negotiation room exists.
- What's the average days-on-market for RENTAL listings here right now (not sales)? A rising rental-DOM trend means longer vacancies and softer asking-rent achievability than the comps imply.
- What's the recent tenant-quality profile in this submarket — average credit score on applications, eviction rate, late-payment / NSF rate, and stable-employment percentage? A property-management company in the area should have these aggregated.
- How much new for-sale + rental construction is in the pipeline within 1–3 miles? Heavy new supply typically softens prices + rents 12–24 months out; constrained supply supports both.
Investment metrics
- 1% rule
- 1.05% ✓
- Cap rate
- 7.68%
- Cash-on-cash
- 4.96%
- DSCR
- 1.22
- GRM
- 7.9
CMA / ARV
No comps found within radius.
Projected returns pro-forma
-3.0% appreciation · 0.53% rent growth · sell at horizon
- IRR
- -11.5%
- Equity multiple
- 0.59×
- Total profit
- $-18,184
- Equity at exit
- $23,857
- IRR
- -6.5%
- Equity multiple
- 0.63×
- Total profit
- $-16,432
- Equity at exit
- $13,834
Cash invested: $44,800 (down + closing). Projections, not guarantees.
Landlord ↔ Tenant lean methodology
- Overall (STATE)
- 87 Strongly Landlord-Friendly
- State Florida
- 87 Strongly Landlord-Friendly · R+3
- County
- — inherits STATE
- City
- — inherits STATE
ZIP-level market 32935
- Rents YoY
- 0.5%
- Active inventory
- 332
- Price-to-rent
- 7.9×
Monthly cashflow live
- Estimated rent
- $1,687 high interval (Pro) →
- Mortgage (P&I)
- −$839
- Tax from tax record
- −$242 /mo · $2,903/yr
- Insurance
- −$67
- HOA
- −$0
- Vacancy / Maint / Mgmt
- −$354
- Net cashflow
- $185
Break-even live
UW: 25.0% down · 7.5% · 30yr · 1.5% tax · 5.0% vac · 8.0% maint · 8.0% mgmt
Financing live
Cash to close
- Down payment
- $40,000
- Closing costs
- $4,800
- Reserves months
- —
- Total cash needed
- —
Loan-product check · same deal, 3 products live
Conventional
25% down · 7.5% · 30yr
- Down + closing
- —
- Monthly P&I
- —
- Monthly cashflow
- —
- DSCR
- —
- Eligible?
- —
Personal DTI + credit; lowest rate.
DSCR
20% down · 8.5% · 30yr
- Down + closing
- —
- Monthly P&I
- —
- Monthly cashflow
- —
- DSCR
- —
- Eligible?
- —
No personal income docs; deal must DSCR.
Hard money
10% down · 12.0% · 12mo
- Down + closing
- —
- Monthly P&I
- —
- Monthly cashflow
- —
- DSCR
- —
- Eligible?
- —
Short-term bridge; refi at stabilization.
Rent comps 28 comps
| Address | Beds | Baths | Sqft | Rent | $/sqft | DOM | Units | Dist |
|---|---|---|---|---|---|---|---|---|
| 2587 Pepper Ave Melbourne, FL | 3.0 | 1.0 | 800 | $1,575 | $1.97 | 23d | 1 | 0.69mi |
| 2794 Rhonda Ln Melbourne, FL | 2.0 | 2.0 | 996 | $1,900 | $1.91 | 23d | 1 | 0.77mi |
| 2659 Burns Ave Melbourne, FL | 3.0 | 1.0 | 1044 | $1,850 | $1.77 | 23d | 1 | 0.78mi |
| 848 Comanche Ave Melbourne, FL | 3.0 | 2.0 | 1080 | $1,950 | $1.81 | 23d | 1 | 0.78mi |
| 2242 Flower Tree Cir Melbourne, FL | 2.0 | 2.0 | 879 | $1,300 | $1.48 | 23d | 1 | 0.78mi |
| 2910 Zephyr Ln Melbourne, FL | 2.0 | 1.0 | 828 | $1,700 | $2.05 | 23d | 1 | 0.82mi |
| 109 San Juan Cir Melbourne, FL | 2.0 | 1.0 | 955 | $1,400 | $1.47 | 21d | 1 | 0.82mi |
| 1225 N Wickham Rd #726 Melbourne, FL | 2.0 | 2.0 | 859 | $1,500 | $1.75 | 21d | 1 | 0.83mi |
| 1688 Eisenhower Ave Melbourne, FL | 3.0 | 1.5 | 988 | $1,700 | $1.72 | 23d | 1 | 0.84mi |
| 196 San Juan Cir Melbourne, FL | 2.0 | 1.0 | 955 | $1,400 | $1.47 | 23d | 1 | 0.86mi |
| 2082 Foxwood Dr Melbourne, FL | 2.0 | 2.0 | 975 | $1,600 | $1.64 | 14d | 1 | 0.92mi |
| 1965 Barkley Ave Melbourne, FL | 3.0 | 1.0 | 1000 | $1,600 | $1.60 | 23d | 1 | 0.95mi |
| 188 Berkshire Ln Melbourne, FL | 3.0 | 2.0 | 1094 | $1,750 | $1.60 | 19d | 1 | 1.00mi |
| 2414 Summerset Dr Melbourne, FL | 2.0 | 2.0 | 1065 | $1,450 | $1.36 | 23d | 1 | 1.01mi |
| 177 Ulster Ln Melbourne, FL | 2.0 | 2.0 | 890 | $1,300 | $1.46 | 23d | 1 | 1.02mi |
| 181 Ulster Ln Melbourne, FL | 2.0 | 2.0 | 890 | $1,400 | $1.57 | 23d | 1 | 1.02mi |
| 254 Ulster Ln Melbourne, FL | 3.0 | 2.0 | 1094 | $1,600 | $1.46 | 14d | 1 | 1.04mi |
| 2420 Central Park Dr Melbourne, FL | 1.0–3.0 | 1.0–2.0 | 1045 | $2,099 | $2.01 | 13d | 11 | 1.05mi |
| 280 Ulster Ln Melbourne, FL | 3.0 | 2.0 | 1094 | $1,600 | $1.46 | 23d | 1 | 1.05mi |
| 189 Cambridge Ln Melbourne, FL | 3.0 | 2.0 | 1094 | $1,600 | $1.46 | 23d | 1 | 1.06mi |
| 217 Bristol Ln Melbourne, FL | 2.0 | 2.0 | 890 | $1,395 | $1.57 | 23d | 1 | 1.08mi |
| 2504 Bogey Ln Apt C Melbourne, FL | 2.0 | 2.0 | 1002 | $1,500 | $1.50 | 23d | 1 | 1.15mi |
| 1252 Ridgewood Dr Melbourne, FL | 3.0 | 2.0 | 1114 | $1,785 | $1.60 | 19d | 1 | 1.16mi |
| 820 N Wickham Rd Melbourne, FL | 1.0–2.0 | 1.0 | 720 | $1,385 | $1.92 | 14d | 8 | 1.23mi |
| 653 Ridge Club Dr #27 Melbourne, FL | 2.0 | 1.5 | 900 | $1,550 | $1.72 | 23d | 1 | 1.44mi |
| 2700 Croton Rd Melbourne, FL | 1.0–2.0 | 1.0–2.0 | 870 | $1,675 | $1.93 | 14d | 1 | 1.45mi |
| 2848 Caribbean Isle Blvd Melbourne, FL | 1.0–2.0 | 1.0–2.0 | 791 | $1,654 | $2.09 | 13d | 13 | 1.47mi |
| 500 N Wickham Rd Melbourne, FL | 2.0 | 2.0 | 1000 | $1,449 | $1.45 | 14d | 8 | 1.49mi |
Listing history 8 events
-
2026-05-19status Pending
-
2026-05-06historical Active Under Contract
-
2026-05-06status Active
-
2026-04-29historical Active Under Contract
-
2026-04-28$160,000 Active
-
1986-08-01soldstatus $43,000
-
1984-11-01soldstatus $42,400
-
1984-04-01soldstatus $39,000
ⓘ Source: listings_history table (triggers on properties + properties_extension) + one-shot
backfill from property_details.listing_events for pre-trigger history.
Tax reassessment forecast FL · Resets to sale price
- Current annual tax
- $2,903 · $242/mo
- Projected year-2 tax
- $2,903 · $242/mo
- Expected delta
- $0/yr ($0/mo · 0.0%)
ⓘ Screening estimate from a state-policy table — verify with the county assessor before closing.
Climate risk First Street
- Flood 1/10 Low FEMA zone X (unshaded) · 0% chance over 30 yrs
- Wildfire 2/10 Low
- Heat 10/10 Extreme 7 d/yr ≥105°F today · 24 d/yr by 30 yrs out
- Wind 10/10 Extreme 99% chance of damaging wind over 30 yrs
- Air quality 1/10 Low 0 unhealthy d/yr today · 0 by 30 yrs out
Nearby sold comps map
Loading sold comps map…
Walkable amenities ~0.75 mi
Loading nearby amenities…
Taxation est. · year 1
- Rental income
- $20,242
- − Mortgage interest
- −$8,962
- − Property taxes
- −$2,903
- − Insurance
- −$800
- − Repairs & maintenance
- −$1,619
- − Management
- −$1,619
- − Depreciation
- −$4,655
- Taxable loss
- −$316
- Est. tax savings @ 24.0%
- +$76
- After-tax cash flow
- $2,296/yr
For passive investors: Depreciation is non-cash, so a rental often shows a tax loss while cash-flowing — sheltering income. Rental losses are passive: they offset passive income freely, and up to $25,000/yr can offset ordinary (W-2) income if you actively participate and your MAGI is under $100k (phasing out to $0 by $150k); unused losses carry forward. On sale, claimed depreciation is recaptured at up to 25%, and gains may owe capital-gains tax (a 1031 exchange can defer both). Figures are a year-1 estimate at your 24.0% rate — not tax advice; consult a CPA.
Schools (NCES district)
- District
- Brevard
- NCES district ID
- 1200150
- Math proficiency
- 53% ▼ -9.00%
- Reading proficiency
- 57% ▼ -4.00%
- Median HH income
- $49,426
- Composite
- 46.86/100
- National rank
- #2370
- State rank
- #19 of 73 in FL
Livability — Melbourne
No livability data for this city. (Only ~50 U.S. cities are tracked.)
Census & demographics
- Census place
- Melbourne, FL
- County
- Brevard County · 602,871 people
- City population
- 178,420
- Metro
- Palm Bay-Melbourne-Titusville, FL
- Population (ZIP)
- 41,965
- Household income
- $64,588
- Rent vs Own
- Severe rent burden
- 1747.0
Population outlook (Brevard County) Hauer SSP2
- Today (2025)
- 623,254 people
- By 2030
- 648,420 · +4.0%
- By 2040
- 690,009 · +10.7%
- By 2050
- 715,669 · +14.8%
- By 2075
- 775,744 · +24.5%
- By 2100
- 776,687 · +24.6%
Race, ethnicity, and origin ACS 2023
- Neighborhood character
- Predominantly White (74%)
- Race & ethnicity
- White 74% Hispanic / Latino 13% Two or more races 9% Black 5% Asian 2%
- Hispanic origin (detail)
- Mexican 3% Puerto Rican 5%
- Common ancestry
- Slovak 2% Romanian 2% Lithuanian 2%
- Foreign-born
- 9% · Canada, Vietnam, Jamaica
- Languages at home
- 88% English-only · Spanish 8% Other Indo-European 1% Tagalog/Filipino 1%
Political lean MEDSL · Brevard
- 2024 margin
- Strong R (+20.8) · D 39.1% · R 59.9% · Other 1.0%
- 2008→2024 swing
- -10.4pp toward R · 2008: -10.4pp · 2024: -20.8pp
- All cycles
- 2024: R+20.8 2020: R+16.4 2016: R+19.8 2012: R+12.7 2008: R+10.4
Not yet ingested
- Civics
- —
Market trends
- HPI YoY
- ▼ -185.48%
- Current HPI
- 308.7443
- Rent YoY
- ▲ 0.53%
- Metro
- Palm Bay-Melbourne-Titusville, FL
- State GDP YoY
- ▲ 3.28%
- F500 in state
- 36
Industry mix (Fortune 500 HQ in FL)
| Industry | F500 HQs | Revenue |
|---|---|---|
| Industrial Technology | 2 | $29B |
|
||
| Insurance | 2 | $17B |
|
||
| Retail | 1 | $60B |
|
||
| Technology Distribution | 1 | $58B |
|
||
| Homebuilding | 1 | $35B |
|
||
| Technology Manufacturing | 1 | $35B |
|
||
Price history
+310.3% since first listed8 events — show timeline
- 2026-05-19 Pending — SCMLS
- 2026-05-06 Contingent — SCMLS
- 2026-05-06 Relisted — SCMLS
- 2026-04-29 Contingent — SCMLS
- 2026-04-28 Listed $160,000 SCMLS
- 1986-08-01 Sold (Public Records) $43,000 Public Records
- 1984-11-01 Sold (Public Records) $42,400 Public Records
- 1984-04-01 Sold (Public Records) $39,000 Public Records
Property tax history
+11.2%/yrLatest (2025): $2,903 · +0.6% YoY. Source: county tax records.
Cash-flow waterfall
monthlySold comps — $/sqft
last 12 mo · ≤1 miLoading sold comps…