1671 468th St · Toeterville, IA
Flood risk 1/10 · Minimal
- FEMA flood zone
- X (unshaded)
- Chance of flooding over 30 yrs
- 0.0%
- Est. flood insurance / yr
- $473 – $860
Fire risk 1/10 · Minimal
- Est. fire insurance / yr
- $902 – $1,676
Heat risk 1/10 · Minimal
- Hot days now (above 98°F)
- 7 days/yr
- Hot days in 30 yrs
- 16 days/yr
Wind risk 2/10 · Minimal
- Chance of severe wind over 30 yrs
- —
Air-quality risk 1/10 · Minimal
- Unhealthy air days now
- 0 days/yr
- Unhealthy air days in 30 yrs
- 0 days/yr
Risk factors via First Street. Map © Google.
Why this score? — see what drove the B- grade
The composite is a weighted blend of 9 inputs, each scored 0–100. Each bar is that input's sub-score; the figure is the points it added to the 100-point composite (weight × sub-score).
- Cash flow +26.5/30.0
- DSCR +9.0/10.0
- ARV discount +7.5/15.0
- Schools +7.0/10.0
- 1% rule +6.8/10.0
- Appreciation +5.0/10.0
- Rent growth +2.5/5.0
- Condition / age +2.5/5.0
- Livability +2.3/5.0
$90,000
🖨 Deal sheet 📄 Offer letter ✓ Due diligence
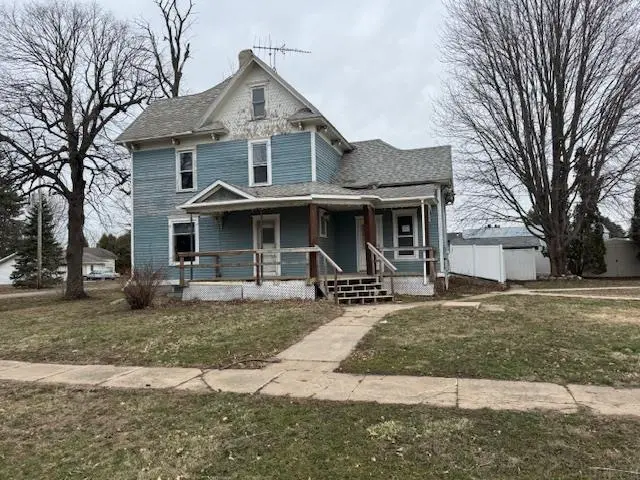
Listing remarks
Two story Victorian style has 2 bedrooms, one bath, hardwood floors, classic open stairway, woodwork, a covered front porch entry, unfinished basement, 10 x 26 rear patio, and detached garage. Has radiant heat, shared well, septic system. All information believed accurate but not guaranteed.
Key facts
- Covered front porch
- Unfinished basement
- Open stairway
Tags
Property features AI
Exterior
- Parking: Detached carport with 2 spaces
- Utilities: Shared well water; Septic tank sewer
- Home design: Single-family residence; Residential property
- Construction: Wood siding
- Exterior features: Shingle roof; Lot approximately 0.4 acres; Lot dimensions about 132 x 132; R-1 zoning
Interior
- Bathrooms: 1 full bathroom
- Heating & cooling: Radiant heating; Natural gas heating; No central air
- Interior features: Unfinished basement; Radiant heating; Natural gas heating; No fireplace; No cooling
Neighborhood map
What this means for you Summary
Snapshot
- This is a 2-bed/1.0-bath single-family listed at $90k.
Deal economics
- At list price, monthly cash flow is $237 ($3k/yr) — positive.
- The deal already cash-flows at list — no discount required.
- Meets the 1% rule at list price ($1k rent vs $90k).
- Recommended offer: $87k (3.0% below list) — sets the bar for market timing.
Location & tenants
- Location reads 46/100 on livability (#970 in IA) — a working-class tenant base; expect higher turnover. Strengths: cost of living A+, crime A; Watch: health & safety C-, amenities F, commute F.
- St Ansgar Community School District (rural): math 84% / reading 82% proficiency, ranked #16 of 289 in IA (top 6%) — strong family-tenant draw, lease renewals of 3-5y typical.
- Zoned schools: St Ansgar Middle School (math 87% / reading 82%, grade A+, #10 of 246 statewide, top 4%, 117 students, 25% FRL); St Ansgar High School (math 82% / reading 87%, grade A, #14 of 336 statewide, top 4%, 171 students, 25% FRL) — zoned schools at 25% FRL track the district average.
- Market conditions: 1 active listings in the ZIP; 41 units permitted in Mitchell County in 2024 (0 in 5+ unit buildings).
Forward outlook
- In year one you build about $3k of equity ($622 loan paydown + $3k appreciation (3.0% local appreciation)).
- Mitchell County population projected to shrink 4% by 2050 — rents likely to lag national; underwrite the cash flow, not the appreciation.
- At projected returns (3.0% appreciation + 3.0% rent growth), your $25k cash investment doubles in ~4 years — after that, you're playing with house money.
- By year 10, paydown + projected appreciation supports a ~$32k cash-out refi (75% LTV) — recoverable capital for the next deal without selling this one.
Negotiation context
- It's been on market 48 days — a 3% lower offer ($87k) is reasonable based on typical stale-listing flexibility.
- 4 sale attempts since 11y ago with the ask held roughly flat each time — persistent listings suggest the price (not the market) is what's stuck; bring a comps-based counter.
Risks & watch-outs
- Watch-outs: built in 1909 — expect roof / HVAC / electrical / plumbing capex.
Questions for the listing agent
- It's been on market 48 days. Have you received any prior offers? Is the seller open to a 3% concession, seller financing, or rate buy-down credit?
- Built in 1909 — when were the roof, HVAC, electrical panel, plumbing, and water heater last replaced?
- Is there a deadline driving the sale (1031 exchange, divorce, estate, relocation)? That informs how much negotiation room exists.
- What's the average days-on-market for RENTAL listings here right now (not sales)? A rising rental-DOM trend means longer vacancies and softer asking-rent achievability than the comps imply.
- What's the recent tenant-quality profile in this submarket — average credit score on applications, eviction rate, late-payment / NSF rate, and stable-employment percentage? A property-management company in the area should have these aggregated.
- How much new for-sale + rental construction is in the pipeline within 1–3 miles? Heavy new supply typically softens prices + rents 12–24 months out; constrained supply supports both.
Investment metrics
- 1% rule
- 1.18% ✓
- Cap rate
- 9.45%
- Cash-on-cash
- 11.29%
- DSCR
- 1.50
- GRM
- 7.1
CMA / ARV
No comps found within radius.
Projected returns pro-forma
3.0% appreciation · 3.0% rent growth · sell at horizon
- IRR
- 18.1%
- Equity multiple
- 2.03×
- Total profit
- $25,944
- Equity at exit
- $40,468
- IRR
- 19.5%
- Equity multiple
- 3.83×
- Total profit
- $71,218
- Equity at exit
- $62,366
Cash invested: $25,200 (down + closing). Projections, not guarantees.
Landlord ↔ Tenant lean methodology
- Overall (STATE)
- 83 Strongly Landlord-Friendly
- State Iowa
- 83 Strongly Landlord-Friendly · R+6
- County
- — inherits STATE
- City
- — inherits STATE
ZIP-level market 50481
- Active inventory
- 1
- Price-to-rent
- 7.1×
Monthly cashflow live
- Estimated rent
- $1,062 medium interval (Pro) →
- Mortgage (P&I)
- −$472
- Tax from tax record
- −$93 /mo · $1,114/yr
- Insurance
- −$38
- HOA
- −$0
- Vacancy / Maint / Mgmt
- −$223
- Net cashflow
- $237
Break-even live
UW: 25.0% down · 7.5% · 30yr · 1.5% tax · 5.0% vac · 8.0% maint · 8.0% mgmt
Financing live
Cash to close
- Down payment
- $22,500
- Closing costs
- $2,700
- Reserves months
- —
- Total cash needed
- —
Loan-product check · same deal, 3 products live
Conventional
25% down · 7.5% · 30yr
- Down + closing
- —
- Monthly P&I
- —
- Monthly cashflow
- —
- DSCR
- —
- Eligible?
- —
Personal DTI + credit; lowest rate.
DSCR
20% down · 8.5% · 30yr
- Down + closing
- —
- Monthly P&I
- —
- Monthly cashflow
- —
- DSCR
- —
- Eligible?
- —
No personal income docs; deal must DSCR.
Hard money
10% down · 12.0% · 12mo
- Down + closing
- —
- Monthly P&I
- —
- Monthly cashflow
- —
- DSCR
- —
- Eligible?
- —
Short-term bridge; refi at stabilization.
Listing history 27 events
-
2026-06-18days on market $90,000 Active 48 DOM
-
2026-06-17days on market $90,000 Active 47 DOM
-
2026-06-16days on market $90,000 Active 46 DOM
-
2026-06-15days on market $90,000 Active 45 DOM
-
2026-06-13days on market $90,000 Active 43 DOM
-
2026-06-12days on market $90,000 Active 42 DOM
-
2026-06-09days on market $90,000 Active 39 DOM
-
2026-06-08days on market $90,000 Active 38 DOM
-
2026-06-07days on market $90,000 Active 37 DOM
-
2026-06-07days on market $90,000 Active 36 DOM
-
2026-06-04days on market $90,000 Active 33 DOM
-
2026-06-02days on market $90,000 Active 32 DOM
-
2026-06-01days on market $90,000 Active 31 DOM
-
2026-05-31days on market $90,000 Active 30 DOM
-
2026-05-31days on market $90,000 Active 29 DOM
-
2026-05-01$90,000 Active
-
2025-09-24price $54,900
-
2025-08-15price $67,900
-
2022-06-29soldstatus $79,000
-
2021-06-14$85,000
-
2020-07-23$79,999
-
2015-11-20soldstatus $75,000
-
2015-06-02$75,000
-
2004-08-13soldstatus $69,900
-
2002-10-14soldstatus $32,031
-
1999-05-01soldstatus $55,000
-
1993-12-01soldstatus $18,500
ⓘ Source: listings_history table (triggers on properties + properties_extension) + one-shot
backfill from property_details.listing_events for pre-trigger history.
Tax reassessment forecast IA · Partial reset (capped growth)
- Current annual tax
- $1,114 · $93/mo
- Projected year-2 tax
- $1,264 · $105/mo
- Expected delta
- +$150/yr (+$12/mo · 13.4%)
ⓘ Screening estimate from a state-policy table — verify with the county assessor before closing.
Climate risk First Street
- Flood 1/10 Low FEMA zone X (unshaded) · 0% chance over 30 yrs
- Wildfire 1/10 Low
- Heat 1/10 Low 7 d/yr ≥98°F today · 16 d/yr by 30 yrs out
- Wind 2/10 Low
- Air quality 1/10 Low 0 unhealthy d/yr today · 0 by 30 yrs out
Nearby sold comps map
Loading sold comps map…
Walkable amenities ~0.75 mi
Loading nearby amenities…
Taxation est. · year 1
- Rental income
- $12,750
- − Mortgage interest
- −$5,041
- − Property taxes
- −$1,114
- − Insurance
- −$450
- − Repairs & maintenance
- −$1,020
- − Management
- −$1,020
- − Depreciation
- −$2,618
- Taxable income
- $1,486
- Est. tax owed @ 24.0%
- −$357
- After-tax cash flow
- $2,488/yr
For passive investors: Depreciation is non-cash, so a rental often shows a tax loss while cash-flowing — sheltering income. Rental losses are passive: they offset passive income freely, and up to $25,000/yr can offset ordinary (W-2) income if you actively participate and your MAGI is under $100k (phasing out to $0 by $150k); unused losses carry forward. On sale, claimed depreciation is recaptured at up to 25%, and gains may owe capital-gains tax (a 1031 exchange can defer both). Figures are a year-1 estimate at your 24.0% rate — not tax advice; consult a CPA.
Schools (NCES district)
- District
- St Ansgar Community School District
- NCES district ID
- 1925200
- Math proficiency
- 84% ▬ 0.00%
- Reading proficiency
- 82% ▲ 2.00%
- Median HH income
- $52,141
- Composite
- 70.36/100
- National rank
- #269
- State rank
- #16 of 289 in IA
Livability — Toeterville
- Score
- 46/100
- State rank
- #970
- US rank
- #26422
Category grades
Schools grade is shown separately in the Schools card above.
Census & demographics
- Census place
- Toeterville, IA
Population outlook (Mitchell County) Hauer SSP2
- Today (2025)
- 10,729 people
- By 2030
- 10,702 · -0.3%
- By 2040
- 10,632 · -0.9%
- By 2050
- 10,346 · -3.6%
- By 2075
- 9,770 · -8.9%
- By 2100
- 8,351 · -22.2%
Not yet ingested
- Political lean
- —
- Race & ethnicity
- —
- Common origin
- —
- Civics
- —
Market trends
- HPI YoY
- —
- Current HPI
- —
- Rent YoY
- —
- Metro
- —
- State GDP YoY
- ▲ 2.48%
- F500 in state
- 4
Industry mix (Fortune 500 HQ in IA)
| Industry | F500 HQs | Revenue |
|---|---|---|
| Financial Services | 1 | $16B |
|
||
| Retail / Convenience | 1 | $15B |
|
||
Price history
+386.5% since first listed12 events — show timeline
- 2026-05-01 Listed $90,000 NEIRBR as distributed by MLS GRID
- 2025-09-24 Price Changed $54,900 NEIRBR as distributed by MLS GRID
- 2025-08-15 Price Changed $67,900 NEIRBR as distributed by MLS GRID
- 2022-06-29 Sold (Public Records) $79,000 Public Records
- 2021-06-14 Listed $85,000 Greater Mason BOR
- 2020-07-23 Listed $79,999 Greater Mason BOR
- 2015-11-20 Sold (MLS) $75,000 NEIRBR as distributed by MLS GRID
- 2015-06-02 Listed $75,000 NEIRBR as distributed by MLS GRID
- 2004-08-13 Sold (Public Records) $69,900 Public Records
- 2002-10-14 Sold (Public Records) $32,031 Public Records
- 1999-05-01 Sold (Public Records) $55,000 Public Records
- 1993-12-01 Sold (Public Records) $18,500 Public Records
Property tax history
+2.9%/yrLatest (2025): $1,114 · +3.9% YoY. Source: county tax records.
Cash-flow waterfall
monthlySold comps — $/sqft
last 12 mo · ≤1 miLoading sold comps…